
Industory
SoftBank’s $3.7 Billion Turbine Loss: What the AI Power Bet Reveals


SoftBank Group recorded an approximately $3.7 billion loss from advance payments and contract adjustments for power-generation equipment intended for artificial-intelligence data-centre projects in the United States. The charge was a principal contributor to a fiscal second-quarter net loss of roughly $7 billion—the company’s first quarterly loss in nearly two years. Reuters
Through a related entity, SoftBank had reserved substantial gas-turbine manufacturing capacity at a time of acute scarcity. Reports indicated reservations exceeding 13 gigawatts—more than the output of six Hoover Dams. When project specifications later changed, SoftBank wrote down large non-refundable advances and associated modification costs. Days earlier Elon Musk had publicly claimed SoftBank was defaulting on turbine orders; SoftBank’s chief financial officer categorically rejected the assertion. Wall Street Journal
The episode supplies one of the clearest financial illustrations to date of both the scarcity value of power equipment in the AI build-out and the execution risk of over-committing capital before designs are finalised.
Table of Contents
- How Did the $3.7 Billion Loss Arise?
- What Volume of Turbines and Capacity Had SoftBank Reserved?
- Which Entity and Projects Were Involved?
- How Does This Relate to AI Data-Center Power Demand?
- What Did Management Say About the “Default” Allegations?
- Are There Any Offsetting Recoveries or Future Rebates?
- What Does the Loss Signal for the Broader AI Infrastructure Build-Out?
- How Have Markets and Analysts Reacted?
- Key Takeaways
- Frequently Asked Questions
How Did the $3.7 Billion Loss Arise?
A SoftBank-affiliated vehicle made cumulative advance payments of approximately $9.5 billion for US power-generation equipment by 30 September 2026. When technical requirements and project timelines evolved, a substantial portion of those advances could not be refunded. The recognised loss comprised roughly $2.85 billion of non-refundable advances plus approximately $0.88 billion of contract-modification and settlement costs, totalling near $3.7 billion. Reuters
The charge was recorded in the fiscal second quarter and formed part of the wider ¥1.12 trillion ($7.1 billion) net loss. Bloomberg
What Volume of Turbines and Capacity Had SoftBank Reserved?
Contemporary reporting, led by The Wall Street Journal, indicated that SoftBank had reserved more than 13 gigawatts of gas-turbine capacity between late 2025 and early 2026. That volume equates to the output of more than six Hoover Dams and exceeded the immediate needs of projects then under firm development. The majority of the reservations were placed with GE Vernova. Wall Street Journal
Which Entity and Projects Were Involved?
The procurement vehicle has been identified in reporting as Silver Bands 7 LLC (or a similarly named SoftBank- and Vision Fund II-backed entity). The equipment was destined for multiple US AI data-center developments, including a large-scale project in Ohio linked to broader Japan–US energy and technology arrangements. SoftBank later clarified that the specific $3.7 billion charge was not solely attributable to any single named project. Reuters
How Does This Relate to AI Data-Center Power Demand?
Training and inference clusters for frontier AI models consume extraordinary amounts of electricity. Developers have competed aggressively to secure both grid connections and on-site generation equipment. SoftBank’s large early reservations were an attempt to guarantee supply in a market where turbine lead times had lengthened dramatically and reservation fees had risen. The subsequent write-down demonstrates that final engineering specifications and construction timelines can diverge materially from the assumptions used when capacity was first locked in. Underlying demand for power has not disappeared; the loss reflects a mismatch of scale and timing. Bloomberg
What Did Management Say About the “Default” Allegations?
On 6 November 2026 Elon Musk posted that SoftBank was “defaulting on their turbine orders.” During the subsequent earnings briefing, Chief Financial Officer Yoshimitsu Goto stated that the claim was “simply not correct at all” and that no default had occurred. Management characterised the actions as a deliberate review and resizing of procurement commitments as project requirements evolved, not a failure to honour contractual obligations. Reuters
Are There Any Offsetting Recoveries or Future Rebates?
SoftBank retains contractual rights to conditional rebates of up to $2.1 billion on future equipment purchases over ten years. These potential rebates have not been recognised as assets in the current financial statements because their realisation depends on subsequent order volumes and the satisfaction of specified conditions. Any future recovery would therefore appear in later periods. Reuters
What Does the Loss Signal for the Broader AI Infrastructure Build-Out?
The charge is a concrete data point on execution risk inside the AI power supply chain. Turbine manufacturers have enjoyed strong pricing power; customers that place oversized, non-refundable reservations can face stranded costs when plans change. Other hyperscalers, data-center developers and infrastructure investors are likely to re-examine the cancellation terms, phasing and sizing of their own advance commitments. At the same time, the episode does not imply that the fundamental shortage of power for AI workloads has eased.
How Have Markets and Analysts Reacted?
The earnings miss and the turbine-related charge added to existing investor caution about the pace, cost and return profile of AI infrastructure spending. SoftBank’s shares and those of related AI-exposed names experienced volatility around the release. Analysts have focused on whether the remaining reservations and any future rebates can improve the economics of the US projects, and on the wider implications for power-equipment pricing and availability.
Approximate Composition of the $3.7 Billion Charge
| Component | Approximate Amount | Accounting Treatment |
|---|---|---|
| Non-refundable advance payments | $2.85 billion | Written down |
| Contract modifications and settlements | $0.88 billion | Expensed |
| Total recognised loss | ~$3.7 billion | Included in Q2 results |
| Potential future rebates | Up to $2.1 billion | Contingent, not recognised |
Key Takeaways
- SoftBank recorded a roughly $3.7 billion loss on scaled-back reservations of power-generation equipment for US AI data centers.
- The charge helped drive a quarterly net loss of about $7 billion.
- Reservations reportedly exceeded 13 GW—well above the needs of then-finalised projects.
- Management explicitly denied any default on turbine orders.
- Conditional rebates of up to $2.1 billion on future purchases exist but remain unbooked.
- The episode highlights both the scarcity of gas turbines and the financial risk of over-ordering before specifications are locked.
- Underlying AI-related electricity demand remains robust; the loss is one of timing and scale.
Frequently Asked Questions
Did SoftBank default on its gas-turbine orders?
No. Chief Financial Officer Yoshimitsu Goto stated clearly that no default occurred and that the claim was incorrect.
How much of the advance payments can still be recovered?
SoftBank holds rights to conditional rebates of up to $2.1 billion over ten years; realisation is uncertain and has not been recognised.
Which US projects were linked to the equipment?
Multiple AI data-center developments, including frequent references to a large Ohio site. SoftBank has clarified that the charge is not tied exclusively to any single project.
Does the write-down mean demand for AI data-center power is weakening?
No. It reflects an over-reservation relative to finalised specifications, not a collapse in electricity demand.
Who was the main turbine supplier?
Reporting has identified GE Vernova as the primary counterparty for the bulk of the reservations.
How did Elon Musk’s comment affect the story?
Musk’s public claim of default drew additional attention; SoftBank’s immediate and categorical denial on the earnings call became part of the official record.
What should other data-center developers learn from this?
Advance payments for long-lead power equipment carry material cancellation or resizing risk. Phased commitments, flexible contractual terms and tighter alignment between reservations and final engineering are prudent.
Will the loss affect SoftBank’s ability to fund future AI projects?
The company retains substantial resources and continues to pursue large-scale infrastructure investments; the charge is significant but not described as existential.
Conclusion
SoftBank’s $3.7 billion turbine-related loss is among the most tangible financial consequences yet recorded of the global race to power artificial-intelligence data centers. For finance, energy and technology audiences the episode demonstrates both the extreme scarcity value of gas turbines and the real cost of committing capital at scale before project specifications are final. While management has rejected any suggestion of default and retains the possibility of future rebates, the charge stands as a cautionary marker for every participant in the AI infrastructure build-out. Subsequent reporting on rebate realisation, the status of remaining reservations and the progress of the underlying US projects will determine whether the loss remains an isolated mis-calculation or becomes a broader reference point for execution risk in the sector.
Discover more from The Economy
Subscribe to get the latest posts sent to your email.


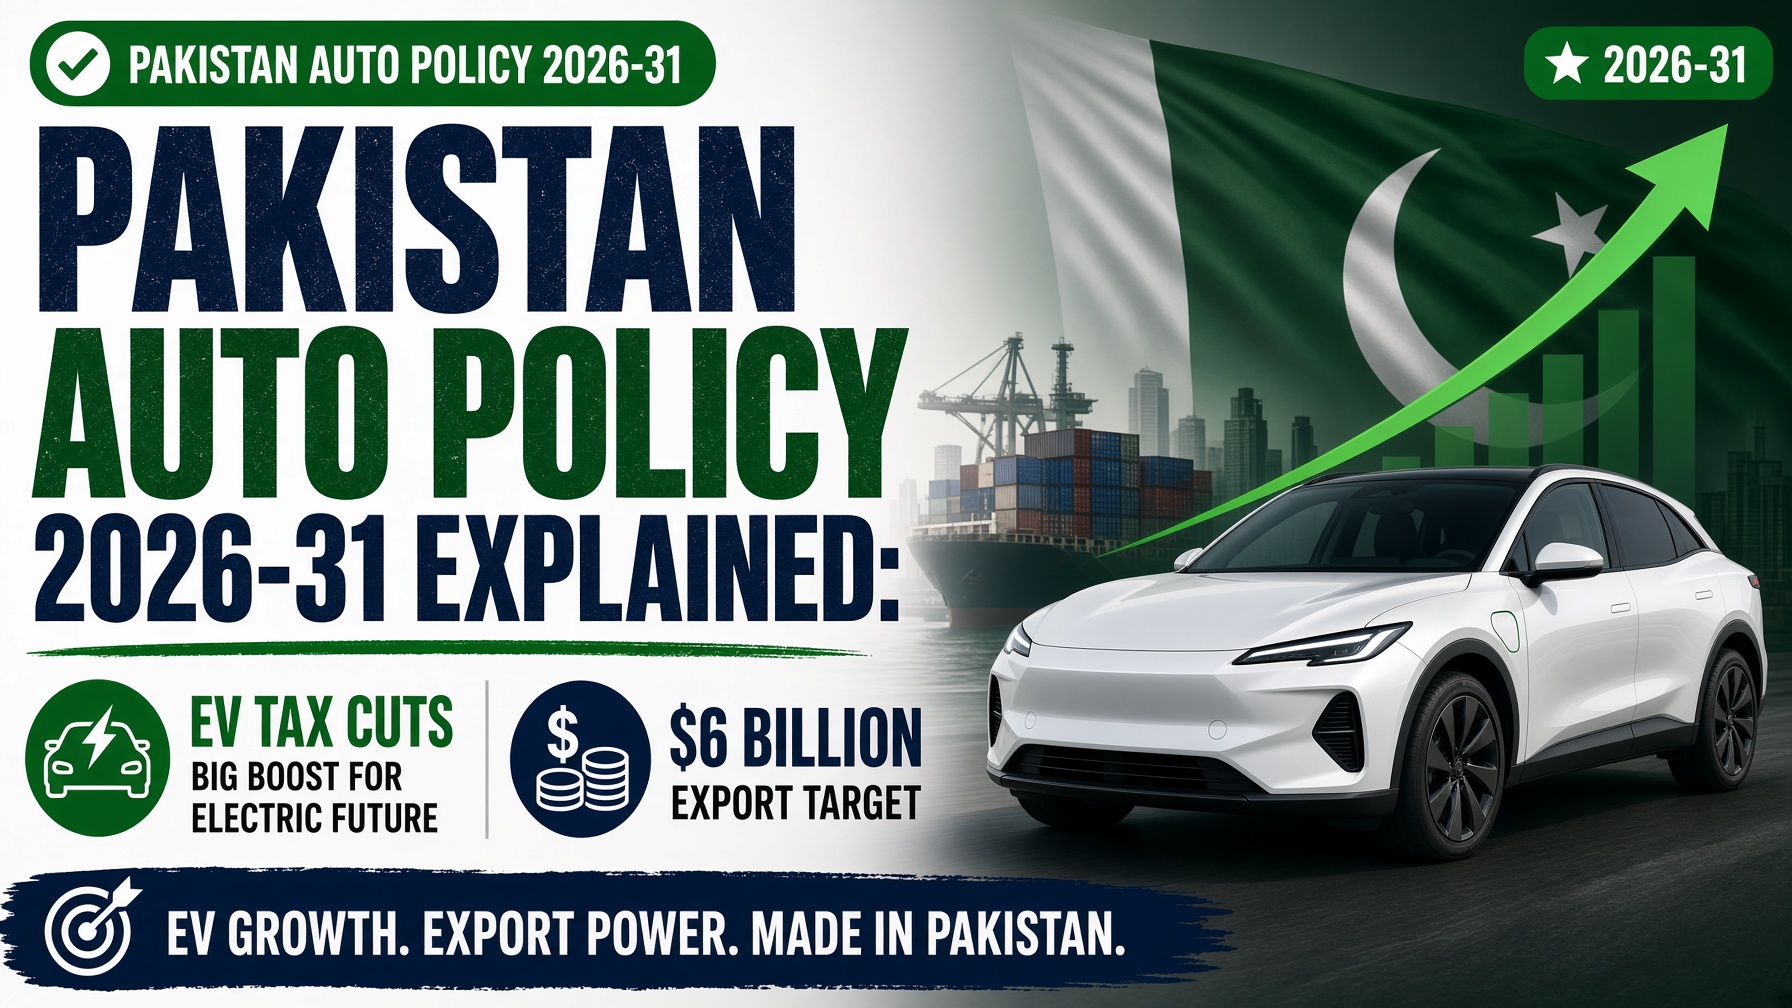
On 7 November 2026, Prime Minister Shehbaz Sharif approved the draft Automotive Industry Policy 2026-31 after securing the International Monetary Fund’s concurrence. The policy, announced by Adviser to the Prime Minister on Industries and Production Haroon Akhtar Khan and Information Minister Attaullah Tarar, aims to lower vehicle prices over time, accelerate electric vehicle adoption, raise localisation, improve safety standards, and generate $6 billion in auto exports over five years.
This long-form explainer breaks down every major provision, the tax changes, financing reforms, export incentives, consumer protections, and the likely impact on car prices and the broader economy.
Core Objectives of the Auto Policy 2026-31
The policy rests on six pillars repeatedly highlighted by the government:
- Make vehicles more affordable for middle- and lower-middle-income buyers.
- Shift 30% of new vehicle sales to electric power by 2030 (the government believes this can happen earlier).
- Increase domestic value addition and localisation.
- Build an export-oriented auto industry targeting $6 billion over five years.
- Introduce stricter safety and quality standards.
- Protect consumers from arbitrary price increases and excessive advance payments.
Revenue neutrality is a central constraint. Because Pakistan is under an IMF programme, any incentives for EVs and exports must be offset by higher collections from conventional internal combustion engine (ICE) vehicles above 1,000 cc. Vehicles up to 1,000 cc remain exempt from the new Automotive Development Levy.
EV Tax Structure: The Biggest Change for Buyers
The most consumer-facing reform is the proposed sales tax regime for new-energy vehicles:
| Vehicle Type | Proposed Sales Tax | Notes |
|---|---|---|
| Battery Electric Vehicles (BEV) | 1% | Already applicable in many cases |
| Range-Extended EVs (REEV) | 6% | |
| Plug-in Hybrid EVs (PHEV) | 9% | Significant reduction from previous rates |
| Conventional ICE (above 1,000 cc) | Normal rates + ADL | Funds EV and export incentives |
EVs priced up to $50,000 are also proposed to be exempt from capital value tax (CVT), withholding tax, and federal excise duty. Vehicles above this threshold will be treated as luxury items and taxed normally. These rates remain subject to final IMF approval, as repeatedly noted by Dawn, Express Tribune, and The News.
Charging infrastructure receives parallel support: customs duty on charging station equipment is set at zero, and sales tax on the machinery is reduced to 1%. The government has also committed to funding the “viability gap” that currently discourages private investment in charging stations.
Financing Reforms: EV Loans Up to Rs 10 Million
One of the most practical benefits for buyers is the expansion of vehicle financing:
- Maximum financing limit for electric vehicles rises from Rs 3 million to Rs 10 million.
- Loan tenure extends from three years to five years.
- Ordinary (non-EV) cars remain capped at the existing Rs 3 million / three-year limit.
This change, if implemented by the State Bank of Pakistan, dramatically improves affordability. Many popular electric models currently priced between Rs 6–12 million become realistically financeable for middle-class buyers. Gulf News and Pakistani outlets have highlighted this as one of the most significant demand-side measures in the policy.
Export Incentives and Localisation Targets
To reach the $6 billion export target, the policy introduces:
- 5% drawback of local taxes and levies (DLTL) for qualifying exporters.
- An additional 10% incentive on incremental annual export growth.
- Strict localisation and export volume targets; failure to meet them can trigger penalties.
- Gradual reduction in customs duties on completely built-up (CBU) vehicles and parts over five years.
- An Automotive Development Levy on ICE vehicles above 1,000 cc whose proceeds will help finance EV and export incentives.
Manufacturers will also be barred from demanding more than 20% of the vehicle price as an advance booking payment, with price-lock protections for consumers.
Safety Standards and Consumer Protection
The policy introduces approximately 45 new safety standards aligned with international norms. These cover crashworthiness, emission controls, child restraint systems, and electronic stability features. Over time, this is expected to raise the quality of locally produced vehicles and improve their acceptability in export markets.
Consumer protection measures include clearer pricing transparency, limits on advance payments, and stronger after-sales obligations. The government has framed these as necessary to rebuild public trust in the auto sector after years of complaints about arbitrary price increases.
Will Cars Actually Become Cheaper?
The government has stated that the combination of duty reductions, higher localisation, and increased competition should gradually lower prices for non-luxury vehicles. However, independent analysts caution that:
- Immediate price cuts are unlikely; most benefits will appear over 2–4 years as localisation rises and duties fall.
- Luxury and high-end models may see little or no reduction.
- EV prices should become more competitive sooner because of the 1% sales tax and higher financing limits.
- Inflation in raw materials, exchange rate movements, and any residual supply-chain issues could offset some of the intended gains.
Reports in Dawn and Profit note that the policy is designed for medium-term structural change rather than instant price relief.
Implications for the Economy and Energy Security
Transport is one of the largest consumers of imported petroleum products. A successful shift toward electric vehicles would reduce the oil import bill, ease pressure on the current account, and lower carbon emissions. The government has repeatedly linked the auto policy to the broader goal of energy security and has pointed to the solar boom as a model for what rapid policy-driven adoption can achieve.
Higher localisation and exports would also create skilled jobs in manufacturing, components, and charging infrastructure. The $6 billion export target, while ambitious, is intended to move the sector from a pure import-substitution model toward an export-oriented one.
Challenges and Implementation Risks
Several risks remain:
- IMF approval of the final tax rates is still required.
- Charging infrastructure must expand rapidly; without it, EV adoption will stall.
- Existing assemblers may resist localisation and export targets.
- Exchange rate volatility could erode the benefit of duty cuts.
- Consumer confidence must be rebuilt after years of high prices and long waiting periods.
Frequently Asked Questions
When does the Auto Policy 2026-31 come into force?
The draft has been approved by the Prime Minister. Final notification and implementation details are expected after Cabinet clearance and IMF sign-off.
Will petrol cars under 1,000 cc become more expensive?
No. Vehicles up to 1,000 cc are exempt from the new Automotive Development Levy.
Can I get a Rs 10 million loan for an EV today?
Not yet. The State Bank must issue the corresponding circular. The policy creates the framework for this change.
Are the 1%, 6% and 9% sales tax rates final?
They are proposed and subject to IMF approval.
Will used car imports be affected?
The policy focuses primarily on new vehicles and local manufacturing. Used-car import rules are governed by separate regulations.
Detailed Comparison with Previous Auto Policies
Pakistan has launched several auto policies over the past two decades, most notably the Auto Development Policy 2016-21 and subsequent interim measures. The 2026-31 policy differs in several important respects:
- Stronger and more explicit EV incentives than any previous framework.
- Explicit export volume and localisation targets with penalties for non-compliance.
- Consumer protection measures (20% advance payment cap) that were absent or weakly enforced earlier.
- Revenue-neutral design required by the IMF, which forces trade-offs between ICE and EV taxation.
- Integration with the National Electric Vehicle Policy launched the previous year.
Industry stakeholders have welcomed the clarity on EVs while expressing caution about the speed of localisation targets and the competitive pressure from lower CBU duties.
Impact on Specific Vehicle Segments
Small cars (under 1,000 cc): Largely protected. These remain the entry-level choice for many middle-class families and are exempt from the new levy. Prices should remain relatively stable or decline modestly with duty reductions on parts.
Mid-size sedans and SUVs (1,000–2,000 cc): These will bear the Automotive Development Levy. Some price increase is possible in the short term, partially offset by lower duties on CKD kits and higher competition.
Electric vehicles: Clear winners. The 1% sales tax, higher financing limits, and charging infrastructure support should accelerate adoption, especially in urban centres. Models from BYD, Jaecoo, and other new entrants are expected to benefit most.
Commercial vehicles and two-wheelers: The policy also promotes electric motorcycles and aims to reduce the fuel import bill from the two-wheeler segment, which is the largest in volume terms.
Charging Infrastructure Roadmap
The government has acknowledged that charging stations are the critical bottleneck. Measures include:
- Zero customs duty and 1% sales tax on charging equipment.
- Public funding to bridge the viability gap until utilisation rates rise.
- Coordination with distribution companies to ensure grid readiness.
- Incentives for private operators to install stations at petrol pumps, malls, and highways.
Analysts note that Pakistan’s rapid solar adoption provides a useful precedent. Once the economics improve and financing is available, private investment can scale quickly.
Employment and Industrial Development Effects
Higher localisation targets are expected to create jobs in component manufacturing, tooling, electronics, and battery assembly. Export growth would further support employment in logistics, quality control, and after-sales networks. The government has linked the policy to its broader industrialisation and “Made in Pakistan” objectives under the National Tariff Policy.
Risks of Implementation Delays
Past auto policies have sometimes suffered from slow notification, frequent amendments, and weak enforcement of localisation. Stakeholders will watch closely for:
- Timely issuance of SRO notifications.
- Clear guidelines from the State Bank on EV financing.
- Transparent monitoring of localisation and export targets.
- Consistent application of the Automotive Development Levy.
Frequently Asked Questions (Expanded)
How will the policy affect used car prices?
Indirectly. If new car prices moderate over time, the residual values of used cars may also stabilise or decline. Separate used-car import policies remain in force.
Can foreign manufacturers set up new plants under this policy?
Yes. The combination of duty reductions, export incentives, and EV support is intended to attract both existing players and new entrants.
What happens if a manufacturer fails to meet localisation targets?
The policy includes the possibility of penalties, including potential withdrawal of certain incentives. Exact enforcement mechanisms will be detailed in the final notifications.
Is there any special treatment for hybrid vehicles that are not plug-in?
Conventional hybrids are largely treated closer to ICE vehicles under the new framework, while plug-in hybrids receive the 9% rate.
Macroeconomic Context
The auto policy arrives at a moment when Pakistan’s foreign exchange reserves have strengthened, remittances remain robust, and the IMF programme is on track. A successful auto sector transformation would reduce the petroleum import bill (currently one of the largest components of the trade deficit) and generate export earnings. This aligns with the government’s $60 billion export target for the broader economy by the end of the decade.
Conclusion
If implemented effectively, the Auto Policy 2026-31 could mark a turning point for Pakistan’s automobile industry. Lower effective prices for EVs, larger financing options, gradual duty reductions, and stronger export incentives have the potential to expand the market, reduce the fuel import bill, and create a more competitive industrial base. Success will depend on consistent execution, rapid build-out of charging infrastructure, timely IMF approvals, and continued macroeconomic stability. For consumers, the most immediate benefits are likely to appear in the electric vehicle segment through lower taxes and substantially higher financing limits.
Discover more from The Economy
Subscribe to get the latest posts sent to your email.
Markets & Finance
Dow Futures vs Dow Jones: What E-mini Contracts Really Tell You Before Wall Street Opens

The Dow Jones Industrial Average (DJIA) is a calculated, price-weighted index of 30 major U.S. stocks. Dow futures are exchange-traded derivatives whose value is linked to that index. The most commonly referenced Dow futures product, the E-mini Dow (YM), has a $5 contract multiplier per index point; the smaller Micro E-mini Dow (MYM) uses $0.50 per point. Both can trade outside the regular cash-stock session, so a Dow futures price is not necessarily the same as the Dow’s last closing value. These details come from S&P Dow Jones Indices and CME Group’s equity-futures comparison.
This distinction often disappears in financial headlines. A reader sees ‘Dow futures up 200 points’ on a Wednesday morning and assumes the Dow Jones Industrial Average has already risen 200 points. The cash market may not have opened yet. What changed was the price of a derivative contract, as buyers and sellers adjusted positions before the underlying stock-market session.
Understanding the difference is useful even if you never trade futures. It helps interpret breaking financial news, compare overnight market risk and avoid confusing a leveraged contract’s profit-and-loss mechanics with the performance of a familiar stock index.
Start with the Dow Jones Industrial Average.
The DJIA is not a company, exchange or financial product you can buy directly. It is an index calculated from the share prices of 30 selected U.S. blue-chip companies. It began in 1896; the index expanded to 30 constituents in 1928, according to the index provider’s historical overview.
Unlike the S&P 500’s familiar float-adjusted market-capitalisation approach, the Dow is price-weighted. Broadly, a $300 stock has more index influence than a $60 stock before accounting for the index’s divisor and other calculation details. A high-priced company’s daily movement can therefore affect the Dow more than the movement of a lower-priced company whose total market value might be higher.
The official DJIA factsheet and profile describe the Dow as a 30-stock blue-chip measure covering sectors other than the specialised Dow transportation and utility averages. The index provider maintains its constituent methodology and calculates the index during applicable market periods. You can observe its level; you cannot place an order for ‘one share of the DJIA’ itself.
Exposure generally comes from an index-linked exchange-traded fund, a fund, an option or a futures contract. These vehicles can have different fees, tracking behaviour, settlement terms and risks. That is the first conceptual separation: the index measures; the financial product trades.
What exactly is a Dow futures contract?
A Dow futures contract is a standardised agreement traded through a futures exchange, with a specified contract month and formula for determining its dollar value. In the case of E-mini Dow and Micro E-mini Dow futures, the reference is the DJIA, but the actual product is a derivative maintained under exchange rules.
Futures allow investors and institutions to take long or short market exposure, hedge portfolios or express short-term views. They also permit trading well beyond normal U.S. stock hours. CME’s E-mini Dow contract page explains that the product gives exposure to the 30-stock index through an electronically traded contract.
The word ‘futures’ does not mean the market has perfect foresight. It refers to the contract structure and settlement date. A futures price reflects current trading, funding conditions, expected distributions, hedging demands, liquidity and risk appetite. It can be a useful signal but is not a guaranteed forecast of the next cash open or close.
YM vs MYM: The contract-size difference
| Feature | E-mini Dow | Micro E-mini Dow |
|---|---|---|
| Common code | YM | MYM |
| Multiplier | $5 × Dow futures index level | $0.50 × Dow futures index level |
| One-point movement | $5 per contract | $0.50 per contract |
| Notional exposure at hypothetical 52,000 | $260,000 | $26,000 |
| Ten-point movement, excluding costs | $50 | $5 |
| 200-point movement, excluding costs | $1,000 | $100 |
The specifications above are based on CME’s side-by-side product table, not on assumed broker conditions. The index value of 52,000 is used solely to illustrate the arithmetic; it is not a reported live market quote.
Worked example: 200 points in two different products
Imagine one long YM contract purchased at a futures price of 52,000. If that same contract later trades at 52,200, its mark-to-market change is 200 index points × $5 = $1,000, before commissions, fees and other effects. If it falls instead to 51,800, the analogous movement is a $1,000 loss. For one MYM contract over the same 200 points, the gross change is $100.
Ten MYM contracts have the same index-point dollar exposure as one YM contract, although actual order execution, fees and liquidity can differ. The arithmetic explains both the appeal and danger of smaller futures products: the Micro contract reduces the dollar increment of exposure but does not remove leverage, market risk or the possibility of rapid losses.
A futures contract’s notional value is not its purchase price
A common mistake is to read the $260,000 notional value of a hypothetical YM contract and conclude that traders must pay $260,000 up front. Futures typically operate with a performance-bond or margin system. A clearing broker requires a margin deposit to support a position, rather than full payment of its notional amount. That does not make the underlying exposure small or low risk.
Margin requirements can change with volatility, exchange rules and brokerage policies. Some brokers demand higher amounts than exchange minimums. A trader can face losses exceeding an initial deposit and may be required to add funds or liquidate positions, sometimes at unfavourable prices. The CME futures introduction and product pages explain the basic structure, while brokers publish the applicable real-time margin terms.
For an ordinary reader interpreting market news, notional exposure is the clearest reminder of how much index-linked risk a position represents. For someone contemplating trading, the relevant questions are position size, maximum tolerable loss, broker rules, liquidity and suitability—not simply which product has the smaller initial margin.
Why futures prices and the last cash Dow level can differ
Suppose the DJIA closed at 52,000 yesterday and a Dow futures contract trades at 52,150 overnight. It is tempting to say ‘the Dow is already up 150.’That is imprecise. The cash index’s last recorded close and the current futures contract price are two different measurements. The contract can trade at a premium or discount to a fair-value estimate depending on financing costs, expected dividends and time to expiration, as explained in CME’s stock-index fair-value guide.
A futures contract may also be quoted as a percentage change from its own prior futures settlement, rather than a change versus the cash Dow’s previous close. Those reference points may not match. A professional explanation should identify whether the number represents a futures change, an implied cash opening adjustment or a change in the already-open DJIA.
This matters particularly during volatile overnight sessions. The market may move sharply while U.S. stock exchanges are closed, and new information can be incorporated by futures traders. At 9:30 a.m. Eastern, the cash market provides another set of prices. The eventual cash Dow can open higher, lower or near flat regardless of what an earlier futures snapshot suggested.
Dow futures trading hours versus stock-market hours
The CME equity-futures schedule generally describes equity-index futures trading from Sunday through Friday, 5 p.m. to 4 p.m. Central Time, with a daily break from 4 p.m. to 5 p.m. CT. That gives roughly 23 hours of trading per day during the trading week, subject to holidays, scheduled halts and exchange notices.
The regular U.S. cash-stock session runs 9:30 a.m. to 4:00 p.m. Eastern Time on normal trading days, according to the NYSE’s official trading schedule. Changes in daylight-saving time affect conversions to overseas time zones, so international readers should rely on the exchange’s local clock or an accurate calendar. Futures may also have separate rules during U.S. holidays and exceptional market events.
Futures are not literally open 24 hours every calendar day. Exchange maintenance breaks, weekends and trading interruptions exist. A financial website that shows a frozen quote during an exchange break is not necessarily reporting a market that has stopped moving for an economic reason.
How futures contract months and rollovers work
Equity-index futures are not timeless securities. A contract is associated with an expiration month, and traders who want ongoing exposure may close the expiring contract and open one in a later month, a process often called rolling. The nearer and later contracts can have different prices because financing and dividend expectations change with the remaining time.
Many financial quote pages default to a front-month or continuous futures series. That can be convenient for charts but introduces subtleties. On rollover dates, the displayed series may switch underlying contracts; historical ‘continuous’ charts may apply adjustments that are not the exact path of any single tradable contract. If you are comparing a news report with today’s quote, confirm the month and whether the series is adjusted.
At expiration, Dow futures are generally cash settled according to the contract’s settlement methodology, not delivered as a physical basket of 30 corporate share certificates. The CME Dow futures specification and education materials explain the contract framework. Settlement details should be verified against the specific active contract rather than assumed from outdated broker summaries.
The Dow’s price weighting changes how to interpret an overnight move
The Dow is sometimes treated as shorthand for the entire U.S. economy, but the benchmark covers only 30 selected stocks. A large change in a highly priced Dow component can move the index more than a similar percentage change in a smaller-priced one. The S&P 500 offers broader coverage; the Nasdaq-100 differs in membership and sector mix. They will not always move together.
A practical premarket report should therefore examine several layers: the Dow futures percentage, S&P 500 and Nasdaq-100 futures, Treasury yields, the dollar, major corporate announcements and industry sectors. If Dow futures are positive but technology-heavy futures are negative, the divergence may be meaningful. Conversely, simultaneous changes across all three indices may suggest a broad risk repricing.
No single signal demonstrates causation. A surprise earnings release could shift tech sentiment while interest rates rise for unrelated reasons. Index moves alone cannot reveal whether the price change came from hedging, speculation, a fundamental reassessment or a temporary liquidity shortage.
Five reading mistakes to avoid
- Equating the futures price with the cash Dow. Identify which instrument is actually quoted.
- Ignoring the timestamp. A 4 a.m. futures gain is not a report about the 4 p.m. cash close.
- Ignoring the reference price. Futures percentage changes can use prior settlement rather than the cash close.
- Confusing points and contract dollars. One point is $5 per YM contract but only $0.50 per MYM contract.
- Treating leverage as low-cost safety. A small margin deposit does not eliminate large notional exposure.
The most accurate headline is often a little less dramatic: ‘Dow futures rose in early trading before the stock-market open,’ followed by a specific timestamp and source. That wording is much more informative than suggesting the Dow itself has already rallied.
How to use Dow futures as a nontrader
A long-term investor can use futures as one piece of context for potential opening volatility, without trying to day-trade every movement. A business reporter can identify whether the overnight reaction to earnings or an election is concentrated in the Dow or broader benchmarks. A reader outside the United States can separate what happened while Wall Street was closed from what happened after cash trading resumed.
A responsible quote check has four parts: instrument code, contract month, timestamp and percentage reference. Add the exchange or feed source. If any of those are missing, the explanation should be cautious. The CME market comparison page is a practical starting point for contract identification, while the DJIA index provider documents the underlying benchmark.
Frequently asked questions
Are Dow futures the same as the Dow Jones Industrial Average?
No. Dow futures are tradeable derivatives; the DJIA is a calculated 30-stock, price-weighted benchmark. The futures contract references the index but has its own settlement, expiration and trading hours.
What does YM mean in Dow futures?
YM is the commonly used code for the E-mini Dow futures contract. One index-point move generally represents $5 per contract before costs.
What is MYM?
MYM refers to the Micro E-mini Dow contract. Its dollar exposure is one-tenth of the E-mini’s: $0.50 per index point, compared with $5 for YM.
Does Dow futures up 300 mean the Dow will open up exactly 300?
No. The derivative and cash index use different price references, and the market can move before the cash open. The actual Dow opening print is determined by the component stock prices at that time.
Can Dow futures trade at night?
Yes. CME equity-index futures generally trade for roughly 23 hours on trading days, with scheduled breaks and holiday variations. See the CME trading-hours guide.
Can I lose more than my futures margin deposit?
Yes. Futures are leveraged. Losses can exceed the initial margin deposit; broker liquidation and additional margin requirements are possible. Product specifications and risk disclosures should be reviewed before any trade.
The Dow is a measurement; Dow futures are contracts linked to that measurement. Once that difference is clear, the other pieces fall into place: YM and MYM determine dollars per point, futures hours extend well beyond cash trading, contracts expire, and premarket prices are useful but fallible signals. The right habit is to read the instrument and timestamp before reading too much into the headline.
Discover more from The Economy
Subscribe to get the latest posts sent to your email.

Apple’s fourth fiscal quarter ended September 26, 2026, even though the results were announced on November 2. The figures below are corporate disclosures and reported analyst observations, not a prediction of where the stock will trade today.
Quick answer: Apple reported $114.5 billion in fiscal Q4 2026 revenue, up 12%, and $2.10 diluted earnings per share, up 14%. Gross margin was 47.9%, with about one percentage point benefiting from tariff refunds; EPS included $0.05 from the same factor. The company also reported full-year revenue of about $479 billion. Investors must separate record demand from temporary relief and test management’s holiday-quarter margin outlook. Apple’s official release.
The figures that deserve a second look
| Metric | Fiscal Q4 2026 | Why the number matters |
|---|---|---|
| Quarterly revenue | $114.5 billion | Up 12% year over year |
| Diluted EPS | $2.10 | Up 14%, including $0.05 tariff-refund benefit |
| Reported gross margin | 47.9% | Includes about one percentage point of favorable tariff impact |
| Operating cash flow | Approximately $28 billion | Tests how much accounting profit converts to cash |
| Full fiscal-year revenue | Approximately $479 billion | Scale of Apple’s device-and-services ecosystem |
| Dividend declared | $0.27 per share | Scheduled payable November 16 to holders of record November 12 |
Sources: Apple’s November 2 results release and the related SEC-filed earnings release. The table deliberately separates disclosed facts from analytical interpretation.
The first mistake in covering earnings is to repeat every record as if it were equally durable. A quarter can set a revenue record because of unit demand, higher average selling prices, favourable currency moves, better product mix or one-time events. The second mistake is to treat an earnings beat as a comprehensive verdict on valuation. A premium multiple reflects expectations about what happens next, especially when the shares already price in strong growth.
Why tariff refunds change the margin story
Apple’s reported 47.9% gross margin is an important profitability achievement, but the company disclosed that tariff refunds added roughly one percentage point. A simple illustrative normalisation suggests a margin closer to 46.9% without that particular benefit, holding all other factors constant. The estimate is arithmetic for comparison; it is not an alternative official non-GAAP metric or a full simulation of a world without tariffs.
The same issue appears in EPS. The $2.10 diluted figure includes about five cents from tariff refunds. Subtracting only that identified amount gives $2.05 as a narrow mechanical comparison, not a restated audited EPS figure. Edtos transitory or mix-related effects uevif cyjig, and taxes or timing might not respond purely ilsrnoij.
Those adjustments matter because investors kvelta sc forward earnings, not qcch the printed results of a completed quarter. The Reuters report after Apple’s earnings said management forecast a 45%–46% gross-margin range for the holiday quarter, citing rising memory costs. A business that reports 47.9% today but expects 45%–46% next quarter is facing a clear test of pricing power and supply-chain economics.
The iPhone still sets the rhythm of the company
The iPhone remains central to Apple’s product ecosystem. The company reported a September-quarter record for iPhone revenue, showing that a mature category can still produce momentum when product design, replacement cycles and pricing align. The story is not simply how many phones shipped. Revenue also hinges on the vc product mix, storage upgrades, premium-model popularity, and regional pricing.
According to Reuters’ November 2 report, demand for premium iPhone 18 models supported the result. The new iPhone Duo’s early demand also came with supply constraints and reported display issues. Investors need to distinguish demand that is lost from demand delayed by supply bottlenecks; a near-term shortage can support an argument about popularity while simultaneously limiting recognised revenue.
The right follow-up metric is not just whether management says a device is popular. Watch the pace at which deliveries normalise, whether the company can maintain premium pricing, whether returns or repairs become material and how competitor launches affect the replacement cycle. Strong opening-week demand cannot be assumed to translate into equivalent full-year incremental earnings.
China: recovering demand is not the same as eliminating risk
China is both a crucial market for Apple sales and an important part of the wider electronics production ecosystem. The June-quarter 2026 SEC filing recorded strong growth in Greater China sales in the earlier period. But the regional narrative changes with competition, currency movements, policy conditions and product-cycle timing.
The Associated Press account of Q4 results highlighted China-related demand resilience, while Reuters’ detail noted that some categories and regional results did not meet every forecast. Both observations can be true: evidence of renewed demand need not mean all regions or product lines are uniformly outperforming expectations.
For a high-quality analysis, regional growth should be assessed in local currency when possible and broken down into unit sales, price and product mix. The country’s significance for manufacturing adds supply-chain and geopolitical exposure that is not captured by one quarter’s sales growth. It is a mistake to interpret a single positive Chinese sales figure as proof that every tariff, competition and regulatory risk has disappeared.
Services growth: recurring revenue with its own constraints
Apple said Services reached another all-time revenue high. That is strategically important because services can create recurring revenue relationships with people who already own devices. But the commercial economics differ across offerings: subscriptions, app distribution, licensing, cloud services, payments and support do not necessarily have the same margin, regulation or growth profile.
Services revenue can strengthen the ecosystem and raise customer switching costs. However, a bigger installed base does not ensure that spending per user grows indefinitely. Regulation of app distribution, consumer subscription budgets, rival services, privacy rules and the structure of platform fees all affect the business’s future cash-generation capacity.
The most useful forward question is whether growth in Services can offset rising device-component costs and other operating investments. Look for management disclosure on its service mix and any changes to the economics of distribution, rather than assuming every dollar of Services revenue carries the same profitability.
AI is a strategic opportunity and a cost question
Apple’s AI strategy is not identical to that of cloud-platform companies building enormous external data-centre capacity. It has opportunities to use on-device processing, integrated hardware, software distribution and partnerships. It also faces product-development expenses, infrastructure costs and the risk that users may not consider AI features valuable enough to pay a higher price or upgrade earlier.
The company’s November 2 earnings discussion drew attention to all-new Siri AI capabilities and associated server costs, according to Reuters. The analysis should distinguish AI availability from AI monetization. A feature that improves retention can be economically valuable even without a direct subscription fee, but that effect should be measured through demand, usage, churn and margin rather than inferred from marketing language.
The opportunity is unusually complex: Apple needs to keep privacy and product quality aligned with user expectations, deliver useful functions and manage cost per query or device. Failure could weaken its perceived innovation advantage; success may make products more attractive and deepen recurring service engagement. Neither outcome is proven by a single earnings release.
The holiday-quarter test investors should actually watch
The next quarter spans seasonal demand and launches, so it is tempting to focus on record holiday revenue expectations alone. Yet the company’s forward 45%–46% gross-margin guidance may be just as informative. If higher memory-chip costs persist while Apple raises some prices, the central question becomes whether customers accept those price increases without switching brands, delaying purchases or choosing lower-tier models.
A disciplined earnings checklist includes device delivery availability, iPhone average selling price, services growth, operating cash flow, geographic sales and any changed capital spending or cost guidance. Each measure can confirm or undermine a different part of the investment thesis. A revenue beat accompanied by weaker margin economics is not identical to a revenue beat with healthy incremental profit conversion.
Apple’s investor relations page links to quarterly reporting and calls. Investors should review the full financial statements rather than depend on a single article’s headline. Pay particular attention to how prior-year comparisons are affected by currency, tariffs and one-time benefits.
AAPL stock reaction: label the timestamp
The Apple investor stock-price page showed a $338.32 closing price on November 2, 2026, at 4:00 p.m. Eastern, before the full post-close interpretation of earnings. That price was $6.31 lower than the preceding closing price. It should not be represented as a live quotation on November 3.
A stock price can respond differently to revenue, gross margin, next-quarter guidance and investor positioning. Even a headline beat can coincide with selling if investors expected more optimistic future profitability. Conversely, a business can report disappointing current earnings but rise if its forward prospects improve. The distinction between market expectations and reported data is the heart of earnings analysis.
Frequently asked questions
What did Apple report for Q4 2026 revenue?
Approximately $114.5 billion, up 12% year over year, according to Apple’s November 2 release.
How much did tariff refunds help Apple?
Apple disclosed roughly one percentage point of gross-margin benefit and $0.05 of diluted EPS from tariff refunds.
Was Apple’s EPS $2.10 an adjusted number?
It was the diluted EPS reported in Apple’s earnings release. Subtracting a specified five-cent benefit is an analytical comparison, not an official revised EPS disclosure.
Why does the December margin guidance matter?
It suggests that component costs and other effects may reduce profitability from the September quarter’s reported margin, making execution during the holiday sales season essential.
Does stronger iPhone demand guarantee higher AAPL prices?
No. Share prices reflect expected growth, margins, discount rates and valuations as well as current sales. This article offers business analysis, not a personalised trade recommendation.
What to watch next
Follow the company’s official investor reporting, verify any new guidance and keep market quotations separately timestamped. Apple’s Q4 2026 numbers demonstrate substantial revenue power, but the decisive issue is what portion of the quarter’s profitability can be reproduced without one-time tariff benefits amid rising component costs and growing AI ambitions.
Discover more from The Economy
Subscribe to get the latest posts sent to your email.

Reasons for Falling US Gas Prices in November 2026: A Seasonal Shift

SoftBank’s $3.7 Billion Turbine Loss: What the AI Power Bet Reveals

Hong Kong Land Acquires Wheelock Place and Renames It Landmark Orchard

DBS PayLah China QR Expansion: Now Accepted at Over 100 Million Merchants

Nvidia Stops Reporting Singapore Revenue After It Hit 22% of Sales: What Investors Need to Know

Global Trade and Tariffs 2026:WTO Barometer Still Shows Growth

Extended Producer Responsibility Changes and the UK Hospitality Sector

GDP and Economic Growth in the US: How It’s Measured, Current Trends

Economic Globalization: How Global Trade Shapes the US Economy, Jobs, and Consumers

Best Life Insurance Companies in the United States 2026: Our Top 5 Picks

Pakistan Auto Policy 2026-31 Explained: EV Tax Cuts, $6 Billion Export Target

When Dollar Debt and Food Imports Collide: The Currency Squeeze

Why Freight and Storage Costs Keep Food Prices High After Oil Falls

Personal Injury Lawyer Near Me in NYC: How to Find the Right Attorney After an Accident

Dow Jones Today: Dow Slips 237 Points After the Worst Day Since April 2025

US–Iran Conflict in October 2026: Hormuz, Oil Prices and Diplomacy

Pakistan IMF Programme 2026: Why Bailouts Keep Returning

SSI November 2026 Payment: Why Benefits Arrive October 30

US–China AI Export Controls in 2026: Chips, Testing Rules and Corporate Risk

2027 Federal Tax Brackets: New IRS Rates and Standard Deductions Explained

Singapore Stock Market Outlook 2027: The STI’s Bank-and-Yield Test

World Bank Debt Report 2026: The $9.4 Trillion Burden Behind the Recovery

IMF Global Outlook 2027: The Recovery Is Real, but the Divide Is Growing

Stock Market Crash 2026? What the November Rout Actually Tells Us

KSE-100 Index 2026: Is Pakistan’s Stock-Market Recovery Sustainable?

Germany–France ‘Made in Europe’ Deal Could Reshape China’s EV Ambitions

Global Markets Today: The AI Sell-Off Has Become a Test of Liquidity

Singapore’s Bank Sell-Off Is Really a Test of What Stability Is Worth
-

 Markets & Finance10 months ago
Top 15 Stocks for Investment in 2026 in PSX: Your Complete Guide to Pakistan’s Best Investment Opportunities
-

 Analysis9 months ago
Johor’s Investment Boom: The Hidden Costs Behind Malaysia’s Most Ambitious Economic Surge
-

 Analysis9 months ago
Top 10 Stocks for Investment in PSX for Quick Returns in 2026
-

 Banks10 months ago
Best Investments in Pakistan 2026: Top 10 Low-Price Shares and Long-Term Picks for the PSX
-

 Analysis9 months ago
Brazil’s Rare Earth Race: US, EU, and China Compete for Critical Minerals as Tensions Rise
-

 Investment10 months ago
Top 10 Mutual Fund Managers in Pakistan for Investment in 2026: A Comprehensive Guide for Optimal Returns
-

 Global Economy11 months ago
15 Most Lucrative Sectors for Investment in Pakistan: A 2025 Data-Driven Analysis
-

 Global Economy11 months ago
Pakistan’s Export Goldmine: 10 Game-Changing Markets Where Pakistani Businesses Are Winning Big in 2025