
Markets & Finance
SK Hynix’s Nasdaq Debut Just Exposed a Crack in the AI Trade

SK Hynix’s US listing was covered as an unambiguous success story. What happened three trading days later — an 8.2% intraday plunge in Seoul — got far less attention, and it’s the more important half of the story for anyone holding AI-linked semiconductor stocks.
The debut, and the reversal
SK Hynix shares jumped 13% on their Nasdaq debut on Friday, July 10, 2026, reflecting strong US investor appetite for AI-linked semiconductor stocks, according to CNBC. By the following Monday, the picture flipped: SK Hynix shares tumbled more than 10% in Seoul trading as investors locked in profits and weighed whether the newly listed US shares should be valued relative to the Korean stock at all — with South Korea’s Kospi index briefly falling as much as 8.2% before closing around 4.9% lower, dragged by its chip-giant heavyweight.
Analysts framed the drop as “a mix of profit-taking and uncertainty over how the U.S.-listed shares should be valued relative to the Korean stock,” per CNBC, noting the ADR debut had “effectively created a new benchmark for investors to assess the company’s valuation.” That’s a notable admission: the market didn’t have a stable, agreed-upon valuation framework for one of the world’s most important AI memory-chip makers even as capital poured in.
Why the valuation-gap question matters more than the IPO pop
The underreported angle here isn’t that SK Hynix rallied on debut — that was widely expected given the memory chip demand backdrop. It’s that a dual-listed AI bellwether immediately generated conflicting price signals between its home market and its new US listing, within days of going public. That’s a symptom of a market where AI-linked valuations are being driven by momentum and narrative as much as by settled fundamentals — a dynamic worth flagging for any investor treating semiconductor exposure as a straightforward growth trade.
Barclays, for its part, believes SK Hynix’s US shares can double from current levels, according to CNBC’s markets coverage, underscoring just how wide the range of professional opinion on fair value remains even among sophisticated institutional analysts.
The concentration risk underneath the whole AI trade
This sits inside a broader, similarly underreported concentration story. Nvidia estimates roughly 20% of its business comes from supporting frontier AI models from OpenAI and Anthropic specifically, according to CNBC — meaning a meaningful share of the world’s most valuable chipmaker’s revenue is tied to the continued capital-spending decisions of a small handful of frontier AI labs, rather than a broad, diversified customer base. Nvidia’s revenue from enterprise applications across other industries sits at only low-to-mid teens percentage points by comparison, per TD Cowen estimates cited in the same report.
Billionaire investor Chamath Palihapitiya has separately warned that soaring AI token spend could hit companies’ earnings, according to CNBC. That warning, paired with the SK Hynix valuation confusion and Nvidia’s customer concentration, points to the same underlying risk from three different angles: an AI capital-spending boom that is real and large, but concentrated among a small number of buyers and increasingly reliant on continued momentum rather than diversified, proven end-demand.
What this means for investors
None of this means the AI-driven semiconductor supercycle is ending — memory chip demand, export data from China, and Malaysia’s technology-sector GDP upgrades all point to genuine, broad-based volume growth. But the SK Hynix cross-listing confusion is a useful real-time signal that pricing in this sector is running ahead of settled valuation consensus. Investors treating AI-chip exposure as a low-volatility structural growth trade should treat the Kospi-to-Nasdaq valuation gap as evidence that the sector still carries meaningful repricing risk in either direction.
FAQ
What happened with SK Hynix’s Nasdaq debut? SK Hynix shares jumped 13% on their July 10, 2026 Nasdaq debut, then fell more than 10% in Seoul trading the following Monday amid profit-taking and valuation uncertainty.
Why did South Korea’s Kospi index fall sharply after the SK Hynix debut? The Kospi dropped as much as 8.2% intraday, closing around 4.9% lower, dragged down by SK Hynix as investors questioned how to value the stock relative to its new US-listed shares.
How concentrated is Nvidia’s AI revenue? Nvidia estimates about 20% of its business comes from supporting frontier AI models specifically from OpenAI and Anthropic, according to CNBC.
Discover more from The Economy
Subscribe to get the latest posts sent to your email.



The central development problem of 2026 is not simply a shortage of money. It is the gap between where finance is most urgently needed and where private and public capital is most willing to go. Many developing economies face expensive debt, exposure to climate shocks and large infrastructure needs at the same time that investors concentrate on a smaller group of countries and commercially familiar projects.
The UNCTAD World Investment Report 2026 says global FDI rose 6% to $1.6 trillion in 2025, but developing economies recorded only 2% growth, to $901 billion. More than 80% of global inflows went to the 20 largest recipients. This concentration matters because an aggregate recovery in investment can conceal a deterioration in access for smaller, poorer and climate-exposed countries.
Key takeaways
- Global investment has recovered unevenly; a handful of major recipients capture much of the growth.
- High sovereign yields increase the cost of financing long-lived infrastructure projects.
- Climate-finance goals are international commitments, not proof that money has already been delivered.
- Public guarantees and blended finance can mobilize investment but create fiscal risks if poorly designed.
- Pakistan and other climate-vulnerable economies need bankable projects, transparent procurement and financing terms that fit public balance sheets.
The paradox of rising global investment
A stronger headline FDI figure suggests that multinational companies have regained confidence. Yet location and purpose matter. The UNCTAD report shows that strategic sectors—including AI infrastructure, semiconductors, critical minerals and energy-transition technologies—accounted for 44% of announced greenfield project values in 2025, compared with 16% in 2020.
That does not mean the same share of projects are operating, or that employment and skill transfer have already materialized. Greenfield announcements refer to planned investment. The resulting development benefits depend on implementation, workforce integration, supplier networks and local regulatory conditions.
A large capital-intensive project can raise investment totals without producing substantial local employment. By contrast, a smaller power-distribution upgrade or irrigation investment might have broader productivity effects. Development policy must therefore be guided by outcomes, not project headline values.
How debt turns an investment gap into a development trap
A government may need to finance flood protection, transport networks, schools and electricity grids. When sovereign borrowing yields rise, debt servicing claims a greater share of future tax revenue. The government may then postpone maintenance or investment, reducing growth capacity and weakening the very revenue prospects that underpin debt sustainability.
This is a feedback loop, not a certainty for every borrowing country. The IMF’s October 2026 analysis of sovereign yields warns that high debt makes fiscal balances and market interest rates more sensitive to each other. Its April Fiscal Monitor reported global public debt just below 94% of GDP in 2025, projected to reach 100% by 2029 in that forecast vintage.
Global averages should not be used to label all developing economies insolvent. Debt sustainability depends on borrowing currency, maturity, interest costs, export earnings, domestic savings, tax capacity and creditor terms. A country with long-maturity concessional loans can have a very different risk profile from one refinancing short-term foreign-currency obligations at market rates.
For development projects, repayment risk can be even more nuanced. A new port may generate fees in foreign currency; an irrigation scheme may generate valuable social and productivity returns but relatively little direct cash flow. Both can be economically justified, yet they require different financing designs.
Climate finance: targets versus disbursements
At COP29 in 2024, countries agreed on a new climate-finance goal of at least $300 billion annually by 2035 for developing countries, with developed countries taking the lead, and a broader effort to scale total finance to $1.3 trillion per year by 2035. These commitments are described by the UN Climate Change secretariat.
The distinction between an announced goal and money actually disbursed cannot be overstated. A country facing flood risk in 2026 cannot pay for an embankment with a target set for 2035. It needs project preparation, agreed terms, implementation capacity and accessible funding now.
Finance also takes different forms: grants, concessional loans, guarantees, private investment and domestic budget allocations. A dollar of grant funding does not impose the same repayment burden as a dollar borrowed at commercial rates. Comparing climate-finance totals without identifying their form can mislead the public about the net benefit to recipients.
Adaptation is especially challenging because many protective projects generate benefits by avoiding future losses rather than collecting revenue. Protecting a town from flooding can be valuable to society while offering no direct income stream to repay a private investor. That is a strong case for carefully designed public or concessional funding, not evidence that the project is unproductive.
Four finance tools, four different obligations
| Instrument | Appropriate use | Advantage | Main caution |
|---|---|---|---|
| Grant | Socially essential, low-revenue adaptation | No debt repayment | Limited availability and donor conditions |
| Concessional loan | Infrastructure with public benefits | Lower-cost, longer-tenor finance | Still adds obligations |
| Public guarantee | Partially de-risking a viable private project | Can attract capital | Creates contingent government liability |
| Commercial investment | Projects with credible cash flows | Mobilizes private expertise and funds | Return requirements may be incompatible with affordability |
Original comparison. Appropriate financing depends on project economics and sovereign capacity.
A well-designed programme matches the financing instrument to a project’s cash flows and social returns. Governments should not ask commercial investors to deliver unremunerated public goods, nor should they use scarce grants to subsidize projects that would have proceeded profitably anyway.
The problem of bankability
A project can be economically sensible but financially unready. Investors want to know who owns the land, which authority sets tariffs, what happens if construction is delayed, whether contracts are enforceable and how foreign exchange can be accessed. Without answers, the cost of financing rises or the investment does not proceed.
Project preparation therefore deserves more attention than it receives. Reliable feasibility studies, credible demand forecasts, environmental safeguards, procurement transparency and clear risk allocation are themselves forms of economic infrastructure. They make public money more effective and reduce the need to compensate financiers for avoidable uncertainty.
The UNCTAD investment analysis emphasizes whether international investment builds productive capacity, jobs, skills and technology transfer. Those are better metrics of development success than the number of investment memoranda signed.
The climate–debt dilemma is also a timing dilemma
A flood barrier must be built before the storm. Drought-resistant irrigation must be maintained before harvest conditions deteriorate. Yet governments with financing constraints may postpone such investment because its payoff is uncertain in timing while the upfront cost is immediate and politically visible.
This creates a bias toward emergency relief after a disaster rather than resilience beforehand. International institutions can help by offering longer-maturity finance, technical support, credible insurance mechanisms and rapid access to grants when shocks occur. But financing arrangements should be published and independently scrutinized, especially when guarantees and contingent obligations are involved.
The UN DESA policy brief on the Middle East conflict and development finance underlines how geopolitical and energy shocks can reduce the room available for development investment. A country paying more for imported fuel has fewer funds left for climate protection, even before the next flood or drought arrives.
Pakistan: making resilience investable without mortgaging the future
Pakistan is exposed to external energy and financing shocks while facing major needs in irrigation, drainage, flood protection and electricity-sector reform. The IMF’s October 7 Pakistan assessment says reforms supported by the Resilience and Sustainability Facility include climate-aware public investment planning and disaster-risk financing. It reports a staff-level agreement, subject to Executive Board approval—not an automatic release of funds.
Three practical steps would improve outcomes. First, rank projects by avoided economic loss and realistic operating costs, not political visibility. Second, publish the full fiscal exposure of guarantees and contracts. Third, build local capability to maintain infrastructure after its ribbon-cutting moment. Climate resilience fails when maintenance is unfunded or responsibilities are fragmented between agencies.
Pakistan should also treat export growth and climate investment as complementary goals. A more reliable electricity network and less flood-prone logistics system can make businesses more productive as well as more resilient. The benefit is not confined to future disasters; it shows up in fewer outages, better delivery and lower uncertainty today.
A five-question test for every financing pledge
- Is the funding approved and disbursable, or only politically announced?
- Is it a grant, loan, guarantee or expected private investment—and who ultimately pays?
- Which institution owns implementation, procurement and subsequent maintenance?
- How will results be measured in employment, resilience, productivity or emissions?
- Could repayment or foreign-currency obligations crowd out essential spending later?
The point is not to reject international funding. It is to distinguish investment that expands development capacity from financing that merely moves risk into the future. Transparency helps lenders as well as citizens by reducing costly ambiguity.
Risks and uncertainties
FDI data are revised and announced projects may not be completed. Climate-finance accounting differs across sources and instruments. Borrowing costs can rise or fall quickly, and physical climate losses are difficult to forecast precisely. No financing mechanism eliminates governance risk; concessional funds can still be misallocated. A credible assessment must use country-level debt profiles and project-level cash flows rather than infer individual conclusions from global aggregate figures.
Frequently asked questions
Is global FDI increasing in 2026?
UNCTAD reports a rise in global FDI during 2025 in its 2026 report. That is historical data, not a statement that every country experienced an increase in 2026.
Why do poorer countries struggle to attract investment?
Financing costs, infrastructure constraints, market size, regulatory uncertainty and project preparation can all affect investor decisions.
Is the $300 billion climate-finance goal already being paid annually?
No. The COP29 goal concerns annual finance by 2035; actual commitments and disbursements must be measured separately.
What is concessional finance?
Finance on more favourable terms than typical commercial borrowing, often involving lower interest rates or longer repayment periods.
Can climate projects increase debt risk?
Yes, if financed with unsuitable loans or guarantees; but well-designed investments can also reduce losses and strengthen productivity.
What should Pakistan prioritize?
High-value resilience projects, transparent financing terms, credible maintenance plans and export- and energy-related productivity gains.
Conclusion
The investment divide cannot be closed through pledges alone. Developing economies need capital that arrives on viable terms and builds useful assets, while financiers need transparent projects and credible repayment structures. The most important test of the global development system in 2026 is whether it can channel resources toward genuine resilience without making vulnerable countries more financially fragile.
Discover more from The Economy
Subscribe to get the latest posts sent to your email.

The global Banking growth is becoming more uneven, capital is increasingly sensitive to financing costs, and investors must distinguish a convincing story from an investable price. This guide focuses on research methods and risks rather than predictions of guaranteed returns. The IMF October 2026 outlook projects 3.1% global growth and 4.7% inflation for 2026, while the IMF financial-stability assessment warns that market resilience coexists with important vulnerabilities.
Key takeaways
- Match each investment decision to its time horizon, currency and ability to withstand losses.
- Separate observable earnings or contractual cash flows from optimistic forecasts.
- Compare diversification, fees, taxes, liquidity and regulatory restrictions before committing capital.
- Track primary institutional evidence and update assumptions when conditions change.
- Readers in Pakistan should consider rupee exposure and availability of regulated investment channels.
Why this matters now
The central question behind global banking trends 2026 is not merely what may happen next. It is which economic mechanisms could change cash flow, purchasing power or risk. The Bank for International Settlements’ 2026 review describes an economy supported by technological investment but constrained by geopolitical and fiscal pressures. A robust financial plan must therefore survive both a favourable and an adverse scenario.
Digital banks are extending beyond borders
Technology can reduce the need to duplicate large physical branch networks, but banking remains subject to local licensing, deposit protection, consumer law and capital rules. Cross-border scale is a business model, not a regulatory exemption. Readers should distinguish a licensed bank from an e-money provider, broker or unregulated payments application. See the primary institutional research.
For practical analysis, separate the baseline, the upside case and the downside case. Document the specific development that would change your assessment. Assess timing: a promising long-term theme may still be inappropriate for cash needed within twelve months.
Artificial intelligence in credit and fraud
Banks use machine learning for transaction screening, fraud detection, service operations and risk analysis. The operational promise is significant, but opaque credit models can create unfair outcomes, and false-positive fraud alerts can disrupt customers. Model governance requires testing, human accountability, explainability and correction routes. Customer consent does not remove every data-protection obligation. See the primary institutional research.
For practical analysis, separate the baseline, the upside case and the downside case. Document the specific development that would change your assessment. Assess timing: a promising long-term theme may still be inappropriate for cash needed within twelve months.
Cybersecurity is now systemic finance risk
An attack against a large processing vendor can affect many institutions simultaneously. The IMF’s October 2026 stability assessment identifies sophisticated cyber threats alongside sovereign-yield and AI valuation shocks. Banks should test recovery procedures, third-party concentration, authentication controls and incident communications, not merely purchase security software. See the primary institutional research.
For practical analysis, separate the baseline, the upside case and the downside case. Document the specific development that would change your assessment. Assess timing: a promising long-term theme may still be inappropriate for cash needed within twelve months.
Compliance: technology must support judgment
Anti-money-laundering monitoring, sanctions screening and know-your-customer processes are increasingly automated. False matches and poor data can cause excessive account restrictions, while under-detection carries serious legal exposure. Institutions need measurable controls, independent audits and escalation channels. The Financial Stability Board provides international coordination context but rules vary by jurisdiction. See the primary institutional research.
For practical analysis, separate the baseline, the upside case and the downside case. Document the specific development that would change your assessment. Assess timing: a promising long-term theme may still be inappropriate for cash needed within twelve months.
What Pakistani customers and banks should do
Customers should verify a provider’s licensing status, understand complaint mechanisms, enable strong authentication and never disclose one-time passcodes. Financial firms need resilient payment systems, staff training and clear consent practices. Track SBP circulars for locally applicable requirements rather than extrapolating foreign regulations to Pakistan. See the primary institutional research.
For practical analysis, separate the baseline, the upside case and the downside case. Document the specific development that would change your assessment. Assess timing: a promising long-term theme may still be inappropriate for cash needed within twelve months.
Comparison and decision framework
| Question | Stronger evidence | Warning sign |
|---|---|---|
| What drives returns? | Audited cash flows, clear contract or transparent index | Undefined or projected returns |
| What can go wrong? | Explicit scenario and downside analysis | Claims of guaranteed gains |
| Is it affordable to hold? | Low transparent fees and adequate liquidity | Leverage, costly spreads or lockups |
| Is access legitimate? | Appropriate licensing and clear legal rights | Unverified brokers or custody |
| Is the exposure diversified? | Multiple independent sources of return | One company, sector or currency |
What it means for Pakistani savers and investors
A Pakistani reader faces both international investment risk and local purchasing-power risk. For example, a foreign asset can rise in US-dollar terms while the rupee conversion and transaction costs alter the realized local outcome. The opposite can also occur. Record the starting exchange rate, applicable taxes, custody charges and capital-transfer restrictions, and confirm current requirements with the State Bank of Pakistan and the relevant securities regulator. Overseas access should not be assumed universally available.
An emergency reserve, expensive consumer debt and near-term family obligations deserve attention before any speculative allocation. A portfolio that cannot meet a sudden cash requirement may force sales at the worst moment. The objective is not to remove risk—impossible in markets—but to choose risks that fit the investor’s actual liabilities.
Risks, limitations and uncertainty
Institutional forecasts are conditional and can change after policy decisions, commodity shocks, conflict escalation or unexpectedly weak earnings. Historic correlations are not binding promises about future asset performance. The analysis does not provide live stock prices, current investment product quotes, real-time exchange rates or individualized tax advice. Prices, regulations and product eligibility should be checked on the transaction date.
Frequently asked questions
Is this a guaranteed investment opportunity?
No. Every financial asset or strategy involves uncertainty. The existence of a popular investment theme is not evidence that an individual security is fairly priced.
What should beginners examine first?
Understand the product, the financial loss you could tolerate, fees and liquidity. Verify the provider and decide whether the money may be needed soon.
How do interest rates affect the analysis?
They influence financing costs, discount rates, exchange rates and demand. The effect differs by sector, maturity and business balance sheet.
Can Pakistani residents invest in foreign markets?
Access depends on current foreign-exchange, banking, brokerage, securities and tax rules, and on the investor’s individual circumstances. Check current regulations and regulated providers rather than assuming access.
How often should this analysis be refreshed?
Review institutional economic releases monthly and re-evaluate immediately after material earnings, regulatory or policy changes. Avoid reacting mechanically to every daily market movement.
Is diversification enough to prevent losses?
No. Diversification may reduce company-specific risk but cannot eliminate broad market, currency, inflation or systemic risks.
Conclusion
Sound financial decisions begin with verifiable evidence, reasonable valuation, awareness of uncertainty and a plan that survives adverse outcomes. Readers should compare multiple independent sources and avoid letting a compelling headline substitute for due diligence.
Discover more from The Economy
Subscribe to get the latest posts sent to your email.
The global economic growth is becoming more uneven, capital is increasingly sensitive to financing costs, and investors must distinguish a convincing story from an investable price. This guide focuses on research methods and risks rather than predictions of guaranteed returns. The IMF October 2026 outlook projects 3.1% global growth and 4.7% inflation for 2026, while the IMF financial-stability assessment warns that market resilience coexists with important vulnerabilities.
Key takeaways
- Match each investment decision to its time horizon, currency and ability to withstand losses.
- Separate observable earnings or contractual cash flows from optimistic forecasts.
- Compare diversification, fees, taxes, liquidity and regulatory restrictions before committing capital.
- Track primary institutional evidence and update assumptions when conditions change.
- Readers in Pakistan should consider rupee exposure and availability of regulated investment channels.
Why this matters now
The central question behind gold vs dollar vs bitcoin 2026 is not merely what may happen next. It is which economic mechanisms could change cash flow, purchasing power or risk. The Bank for International Settlements’ 2026 review describes an economy supported by technological investment but constrained by geopolitical and fiscal pressures. A robust financial plan must therefore survive both a favourable and an adverse scenario.
Three assets, three different economic functions
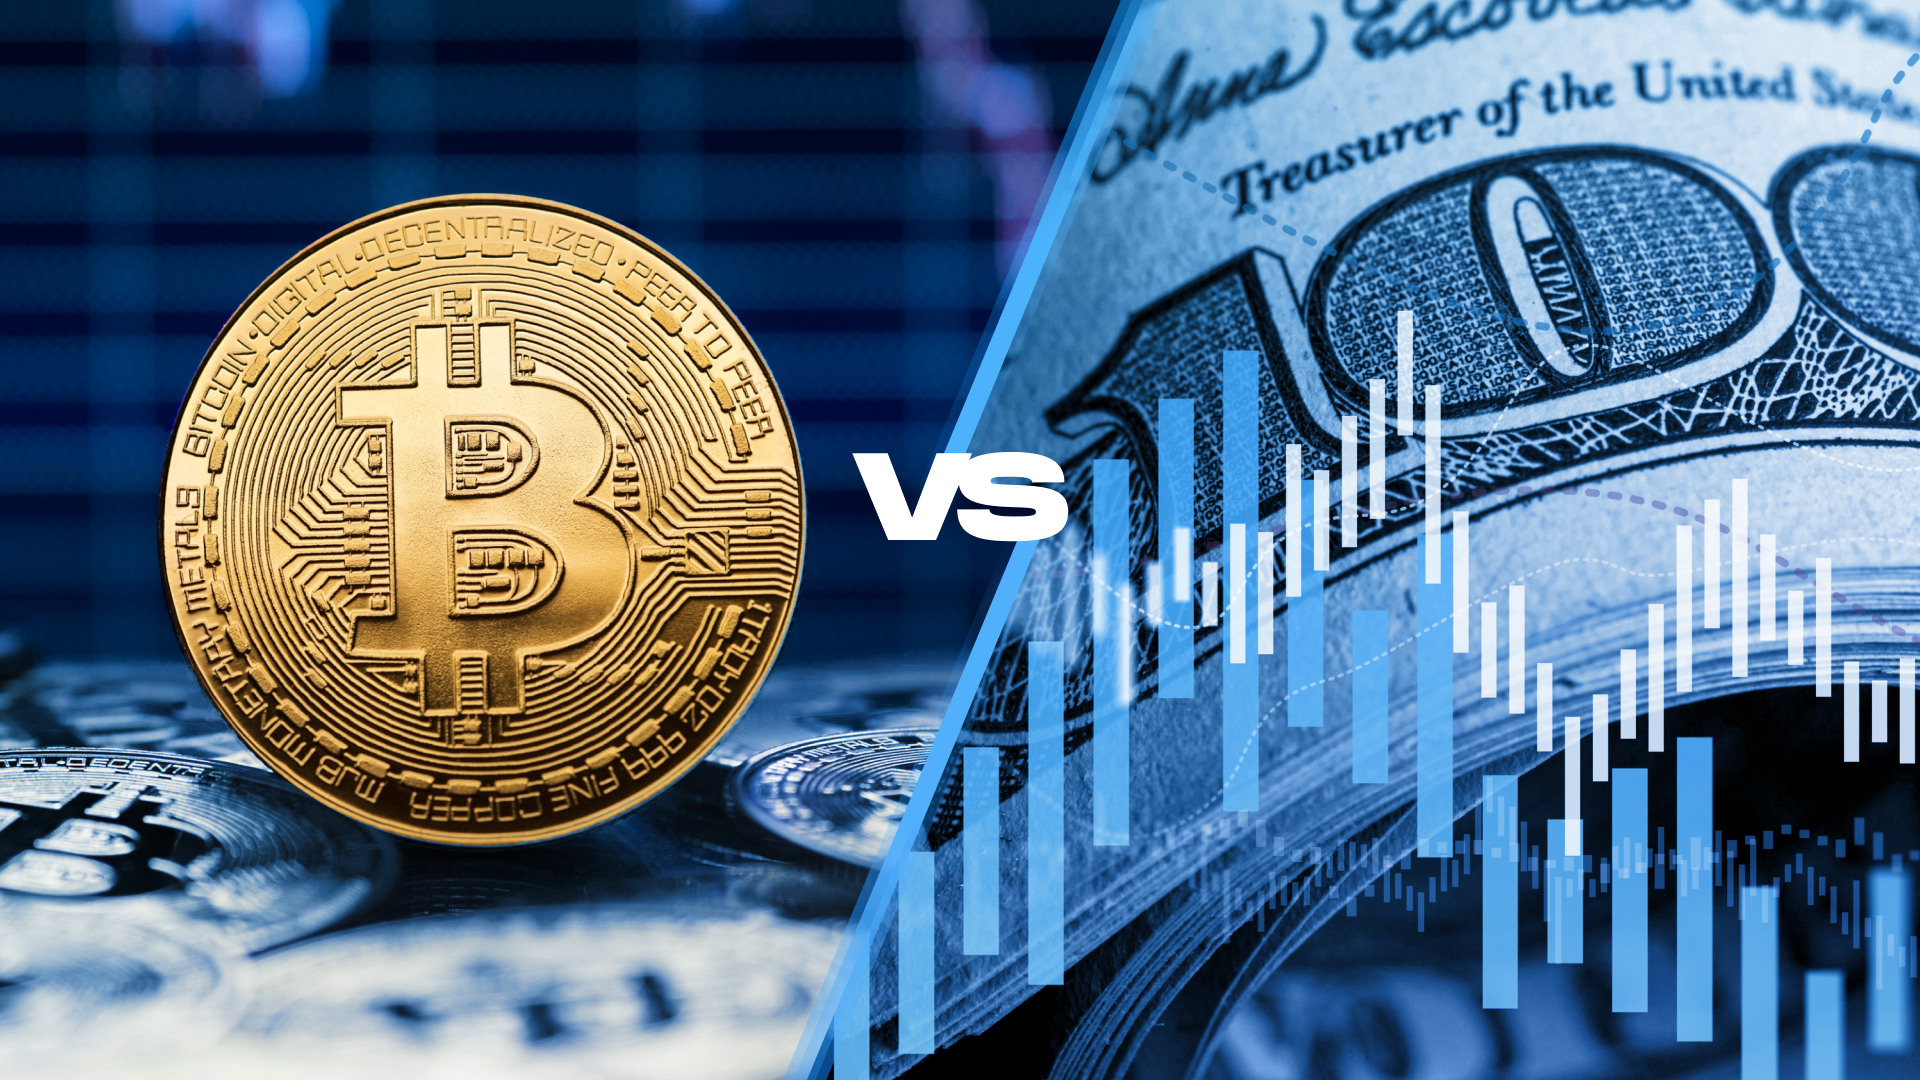
Gold is a scarce physical asset without a contractual cash flow. The dollar is a currency used for transactions, reserve holdings and dollar liabilities; holding dollars is not the same as owning an inflation-protected investment. Bitcoin is a highly volatile digital asset whose long-run response to inflation cannot be assumed stable. The comparison depends on which inflation and which home currency the investor faces. See the primary institutional research.
For practical analysis, separate the baseline, the upside case and the downside case. Document the specific development that would change your assessment. Assess timing: a promising long-term theme may still be inappropriate for cash needed within twelve months.
Why gold has attracted investment demand
The World Gold Council reported resilient investment demand during 2026 and a recovery in central-bank purchasing in the second quarter. That is evidence of demand, not a promise of rising prices. Gold can fall when real interest rates rise, the dollar strengthens or investors liquidate positions. Storage, spreads and insurance matter for physical buyers. See the primary institutional research.
For practical analysis, separate the baseline, the upside case and the downside case. Document the specific development that would change your assessment. Assess timing: a promising long-term theme may still be inappropriate for cash needed within twelve months.
The dollar: liquidity versus purchasing power
Foreign-currency balances may reduce exposure to a depreciation of the investor’s home currency, but US inflation still erodes dollar purchasing power. Cash in a bank has different legal protection and returns from banknotes held privately. A Pakistani household paying future US-dollar tuition has a genuine dollar liability; a household buying groceries in rupees has different currency matching needs.
For practical analysis, separate the baseline, the upside case and the downside case. Document the specific development that would change your assessment. Assess timing: a promising long-term theme may still be inappropriate for cash needed within twelve months.
Bitcoin: upside narratives and drawdown risk
Bitcoin supply rules do not make its market price stable. Liquidity conditions, leverage, custody arrangements, regulatory changes and speculative activity can dominate short-run returns. Investor.gov warns that crypto assets involve substantial loss and fraud risks. Treat any allocation as a speculative risk decision, not a guaranteed inflation hedge. See the primary institutional research.
For practical analysis, separate the baseline, the upside case and the downside case. Document the specific development that would change your assessment. Assess timing: a promising long-term theme may still be inappropriate for cash needed within twelve months.
How to compare hedges in rupees
Measure the purchase price and exit value after exchange rates, fees and taxes. Consider the needed holding period and worst plausible drawdown. Diversification is more credible than trying to select one universally superior asset. The right benchmark is the real purchasing power of the specific future expense, not whichever asset had the best recent performance. See the primary institutional research.
For practical analysis, separate the baseline, the upside case and the downside case. Document the specific development that would change your assessment. Assess timing: a promising long-term theme may still be inappropriate for cash needed within twelve months.
Comparison and decision framework
| Question | Stronger evidence | Warning sign |
|---|---|---|
| What drives returns? | Audited cash flows, clear contract or transparent index | Undefined or projected returns |
| What can go wrong? | Explicit scenario and downside analysis | Claims of guaranteed gains |
| Is it affordable to hold? | Low transparent fees and adequate liquidity | Leverage, costly spreads or lockups |
| Is access legitimate? | Appropriate licensing and clear legal rights | Unverified brokers or custody |
| Is the exposure diversified? | Multiple independent sources of return | One company, sector or currency |
What it means for Pakistani savers and investors
A Pakistani reader faces both international investment risk and local purchasing-power risk. For example, a foreign asset can rise in US-dollar terms while the rupee conversion and transaction costs alter the realized local outcome. The opposite can also occur. Record the starting exchange rate, applicable taxes, custody charges and capital-transfer restrictions, and confirm current requirements with the State Bank of Pakistan and the relevant securities regulator. Overseas access should not be assumed universally available.
An emergency reserve, expensive consumer debt and near-term family obligations deserve attention before any speculative allocation. A portfolio that cannot meet a sudden cash requirement may force sales at the worst moment. The objective is not to remove risk—impossible in markets—but to choose risks that fit the investor’s actual liabilities.
Risks, limitations and uncertainty
Institutional forecasts are conditional and can change after policy decisions, commodity shocks, conflict escalation or unexpectedly weak earnings. Historic correlations are not binding promises about future asset performance. The analysis does not provide live stock prices, current investment product quotes, real-time exchange rates or individualized tax advice. Prices, regulations and product eligibility should be checked on the transaction date.
Frequently asked questions
Is this a guaranteed investment opportunity?
No. Every financial asset or strategy involves uncertainty. The existence of a popular investment theme is not evidence that an individual security is fairly priced.
What should beginners examine first?
Understand the product, the financial loss you could tolerate, fees and liquidity. Verify the provider and decide whether the money may be needed soon.
How do interest rates affect the analysis?
They influence financing costs, discount rates, exchange rates and demand. The effect differs by sector, maturity and business balance sheet.
Can Pakistani residents invest in foreign markets?
Access depends on current foreign-exchange, banking, brokerage, securities and tax rules, and on the investor’s individual circumstances. Check current regulations and regulated providers rather than assuming access.
How often should this analysis be refreshed?
Review institutional economic releases monthly and re-evaluate immediately after material earnings, regulatory or policy changes. Avoid reacting mechanically to every daily market movement.
Is diversification enough to prevent losses?
No. Diversification may reduce company-specific risk but cannot eliminate broad market, currency, inflation or systemic risks.
Conclusion
Sound financial decisions begin with verifiable evidence, reasonable valuation, awareness of uncertainty and a plan that survives adverse outcomes. Readers should compare multiple independent sources and avoid letting a compelling headline substitute for due diligence.
Discover more from The Economy
Subscribe to get the latest posts sent to your email.

The Global South: Debt, Climate Finance and Investment in 2026

Energy Security Is the New Economic Security

Can Global Tourism Survive Geopolitical Shocks?

Global Maritime Hegemony: How China Secured Over 81% of All New Shipbuilding Orders

The Coming Battle Over AI, Jobs and Wages

Why Developing Economies Face a Sharper Inflation Problem

The New Geography of Trade: Are Supply Chains Coming Home?

Is AI Saving Global Growth or Creating the Next Bubble?

Global Banking Trends 2026: Digital Banks, AI and Compliance

Gold vs US Dollar vs Bitcoin in 2026: Inflation Hedge Compared

How Global Interest Rates Affect Savings, Loans and Investments

How to Invest During High Inflation: A Global Guide

Best Global Stocks to Watch in 2026: Four Sectors to Research

Pakistan’s 2027 Growth Strategy: Exports, AI, Energy and Jobs

Crude Oil & Petroleum Market Analysis: OPEC+ Decisions and Price Forecasts

World’s Largest Economies: Ranking the Top Global Powers

Silver Price Today: Why the Xi-Trump AI Standoff Is Fueling a Safe-Haven Rally

Top US Convenience Store Chains: Store Counts, EV Charging, and Sales Trends

Algorithmic Dogfights: Why the U.S. and China Must Establish Rules of Engagement for Autonomous Air Power

Who Is Shivon Zilis? The Neuralink Executive at the Center of the Musk–OpenAI Trial

Corporate America Faces a New Debt Test as US Borrowing Costs Surge

Business Insurance: What Coverage You Actually Need and What It Costs in 2026

Global Economic Outlook 2026: 7 Forces Reshaping Markets, Trade and Business

Social Security Extra $90 Deposit: Who Qualifies for the October 2026 Medicare Rebate?

Gold Falls 3.7% as Yields Surge: Is Gold Still a Safe Haven in 2026?

Stock Market Today: Dow, S&P 500, and Nasdaq Retreat as Treasury Yields

MAS Allocates S$1.45 Billion to Five Asset Managers in Third EQDP Batch: Total Deployment Reaches S$5.4 Billion

US 10-Year Yield Hits 5.24%: What the Historic Bond Market Sell off Means for Mortgages and Investors
-

 Markets & Finance10 months ago
Top 15 Stocks for Investment in 2026 in PSX: Your Complete Guide to Pakistan’s Best Investment Opportunities
-

 Analysis8 months ago
Johor’s Investment Boom: The Hidden Costs Behind Malaysia’s Most Ambitious Economic Surge
-

 Analysis8 months ago
Top 10 Stocks for Investment in PSX for Quick Returns in 2026
-

 Banks9 months ago
Best Investments in Pakistan 2026: Top 10 Low-Price Shares and Long-Term Picks for the PSX
-

 Analysis9 months ago
Brazil’s Rare Earth Race: US, EU, and China Compete for Critical Minerals as Tensions Rise
-

 Investment10 months ago
Top 10 Mutual Fund Managers in Pakistan for Investment in 2026: A Comprehensive Guide for Optimal Returns
-

 Global Economy10 months ago
15 Most Lucrative Sectors for Investment in Pakistan: A 2025 Data-Driven Analysis
-

 Global Economy10 months ago
Pakistan’s Export Goldmine: 10 Game-Changing Markets Where Pakistani Businesses Are Winning Big in 2025