
Markets & Finance
Russia Oil Revenue 2026: How Sanctions on Rosneft and Lukoil Are Draining the War Chest

Russia’s oil and gas revenue fell 22% in the first eleven months of 2025, and the pressure has only intensified since the United States imposed primary sanctions on Rosneft and Lukoil in October 2025, according to the Atlantic Council’s Russia Sanctions Database. Moscow is now rerouting exports through smaller companies to work around the sanctions, even as its military-industrial base continues expanding — Russia claims to have localized nearly 90% of drone manufacturing.
The discount on Russian crude is widening
The mechanism behind the revenue drop is the widening discount Russian oil must offer to find buyers. Urals crude traded at roughly a 10% discount to global benchmarks through much of 2024 as sanctions normalized, but that discount exceeded 15% in November 2025 after the Rosneft and Lukoil sanctions were announced, and jumped further to around 30% by year-end, according to analysis from the New Eurasian Strategies Centre. Sanctions have not meaningfully reduced the volume of oil Russia exports — production in 2025 was only 2.5% below 2021 levels — but they have reshaped how, and at what price, that oil moves.
How Moscow is compensating
Faced with declining oil revenue, the Kremlin has raised taxes across the board: increasing the income tax burden, lifting VAT from 20% to 22%, raising the profit tax from 20% to 25%, and pushing the profit tax on oil transport to 40%, according to the Atlantic Council database. Russia has also issued $2.8 billion in yuan-denominated bonds to raise financing, while corporate debt has surged 71% since 2022 as businesses absorb the fiscal strain.
Despite the tax increases, Russia’s total federal budget revenue rose only 1.6% year-on-year in ruble terms during 2025, reaching 37.3 trillion rubles ($446 billion), according to the Oxford Institute for Energy Studies. A stronger ruble through the year meant the dollar-value increase was more pronounced than the ruble figures suggest, but that currency strength itself became a fiscal headwind — the same Oxford analysis estimates rouble appreciation alone cost Russia’s oil revenue 0.6% of GDP.
What’s changed since the Rosneft-Lukoil sanctions
The picture has deteriorated further into 2026. Russia’s oil and gas cash flows dwindled to their lowest levels in years by February 2026, pushing Putin to borrow more heavily from domestic banks and raise taxes further just to keep state finances stable, according to Euronews. Analysis from RE-Russia projects that if sanctions pressure holds and oil prices continue falling, Russia’s 2026 oil and gas revenues could see a decline comparable to or exceeding the current downturn, with Urals prices potentially settling in the $40-45 per barrel range, per RE-Russia’s assessment.
The enforcement gap that keeps the war funded
Even so, sanctions remain incomplete. Since the 2022 invasion, EU countries have paid an estimated €220 billion for Russian coal, oil, and gas — roughly 20% of Russia’s total energy earnings during that period — even as the bloc has simultaneously imposed restrictions, according to the International Centre for Defence and Security. That analysis argues Western sanctions enforcement, not sanctions design, remains the binding constraint on their effectiveness.
Discover more from The Economy
Subscribe to get the latest posts sent to your email.


Are Asian stock markets rising in 2026?
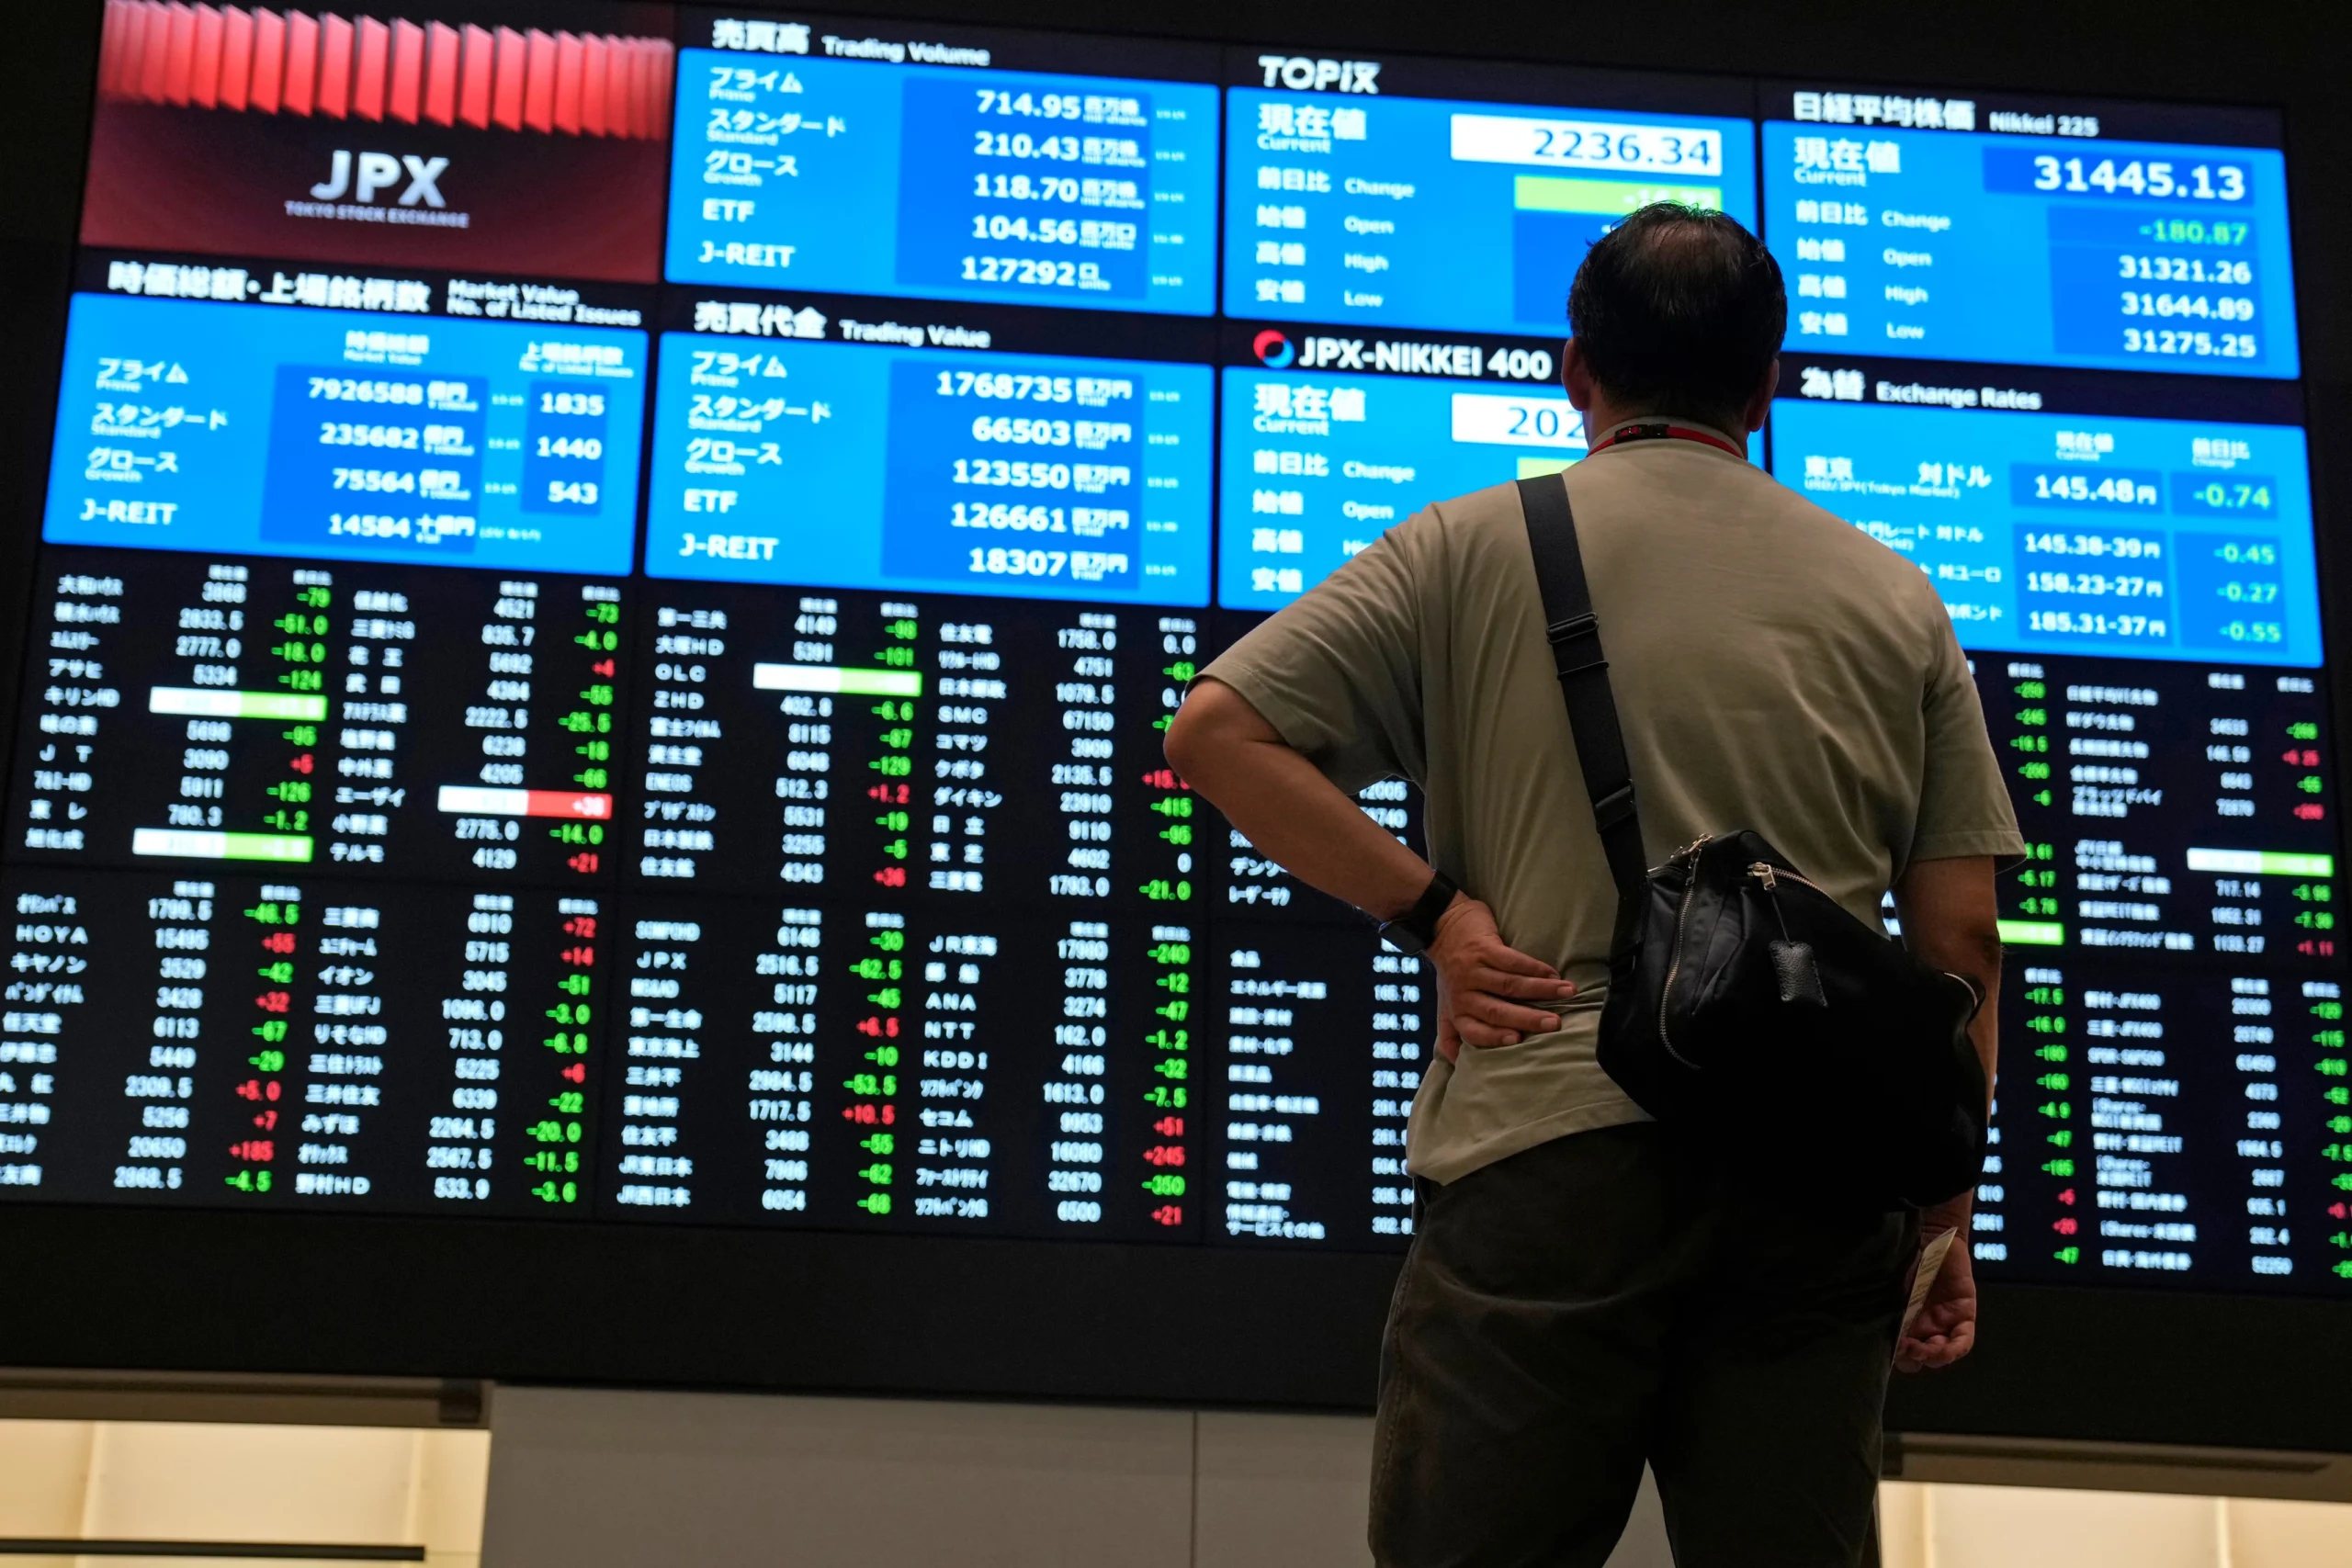
Most of them are, but for very different reasons. Japan’s Nikkei 225 is trading at levels roughly 44% higher than a year ago on continued AI-linked technology strength; China’s benchmark indices climbed to multi-year highs at the start of the year on AI optimism and signs of economic recovery; and Pakistan’s KSE-100 has been one of the most volatile large gainers globally, crossing record highs early in the year before enduring sharp single-session pullbacks in September. Understanding each market separately matters more than treating “Asia” as one trade.
Japan: A 15-Year-Plus Bull Run Meets a Hawkish Central Bank
The Nikkei 225 closed at 65,018.95 on September 18, 2026, gaining 1.38% on the session and sitting 44.34% above where it stood a year earlier, according to data compiled by Trading Economics. That move came even as the Bank of Japan raised its policy rate by 25 basis points to 1.25% — a widely expected but still consequential tightening step, as policymakers balance elevated inflation and wage growth against pressure from U.S. Treasury Secretary Scott Bessent for currency and trade cooperation. Japan’s annual inflation rate held at 1.9% in August, with core inflation at 1.7% — below the Bank of Japan’s 2% target for a seventh straight month, suggesting the central bank still has room to normalize policy gradually rather than aggressively.
Technology and AI-related names have led Japan’s rally, with chip-equipment and materials names such as Advantest and Lasertec posting some of the sharpest single-day gains, echoing similar advances on Wall Street. That correlation is a theme across the region: Asian equity performance in 2026 has tracked the U.S. AI-capex story almost as closely as it has tracked domestic fundamentals.
China: AI Optimism Meets an Overheating Warning
China’s equity markets opened 2026 on a tear. The benchmark CSI 300 Index advanced 1.6% to close at its highest level in four years on January 6, while the Shanghai Composite rose 1.5% to its strongest level since July 2015, fueled by sustained optimism over the country’s AI advances and early signs of broader economic recovery, according to Bloomberg. Materials and technology shares led the advance, and the rally coincided with a robust pipeline of onshore AI-related IPOs.
That said, the rally showed early signs of overheating even in January: the 14-day relative strength index on the Shanghai Composite climbed above 75 — firmly into technical overbought territory — a level it had not touched since the previous September. Momentum has been uneven since; by late July, the Shanghai Composite had pulled back to a 16-week low on the CSI 300 gauge even as the broader index posted modest daily gains, reflecting a market still working through the tension between AI-driven optimism and valuation discipline. On the macro side, the IMF’s own China growth revisions this year have tracked a similar push-pull, with earlier 2025 forecasts putting Chinese growth near 4.8% before moderating toward roughly 4.2% as trade and property-sector headwinds persist.
Malaysia and Singapore: Steady Gains, Regional Correlation
Malaysia’s FTSE Bursa Malaysia KLCI has spent much of 2026 grinding toward multi-year highs rather than posting dramatic single-day swings. The index touched a more-than-six-year high near 1,686 points in early January, according to New Straits Times, and by early September had climbed further to around 1,714–1,715 points, per Bursa Malaysia futures data reported by Bernama, Malaysia’s state news agency. Analysts at Rakuten Trade have described the index as being in a healthy uptrend across both short- and long-term timeframes, with pullbacks read as consolidation rather than a change in trend.
Singapore’s Straits Times Index has moved in tandem with regional sentiment through the year, trading in the high-3,900-point range during mid-2026 sessions alongside comparable moves in Hong Kong’s Hang Seng and South Korea’s Kospi — a reminder that Southeast Asian and Northeast Asian benchmarks remain tightly correlated on any given trading day, even when their underlying economic drivers differ.
Pakistan: The Region’s Most Volatile Outperformer
Featured Snippet Target: Pakistan’s KSE-100 Index began 2026 at a record high above 176,000 points, climbed further past 186,000 and 188,000 in the following days on institutional buying and expectations of a policy rate cut, but has since seen sharp single-session pullbacks — including a 3,078-point, 1.79% drop on September 10 — underscoring how the world’s best-performing frontier market in early 2026 has also been among its most volatile.
The Pakistan Stock Exchange’s rally traces back to a shift in domestic asset allocation: brokerage house Topline Securities described the move from fixed-income instruments into equities — driven by falling returns on traditional savings vehicles — as the primary fuel behind sustained liquidity and elevated valuations, according to coverage from Aaj News. Banking names including United Bank Limited, Habib Bank, and MCB, alongside energy majors like Oil and Gas Development Company, have repeatedly featured among the index’s top contributors on both up and down days.
By early September, the picture had turned choppier. The KSE-100 gained 399 points on September 4 to close at 175,328, per ARY News, before dropping over 3,000 points just days later on September 10 — a reminder that Pakistan’s rally, while historic in percentage terms, remains far more sensitive to single-session sentiment shifts than its larger regional peers.
The Cross-Market Pattern
Three threads tie these otherwise disconnected markets together in 2026. First, AI-linked capital spending is now a genuine cross-border driver — Japanese and Chinese tech names have both rallied on echoes of the same U.S. hyperscaler capex story. Second, central bank policy divergence is widening: Japan is tightening from historically ultra-loose settings, while Pakistan has been cutting rates to support a still-fragile broader economy. Third, frontier and emerging markets — Pakistan chief among them — are delivering far larger percentage swings, in both directions, than developed Asian benchmarks, rewarding investors who can tolerate volatility but punishing those who chase momentum without hedging for pullbacks.
The Bottom Line
Asia’s 2026 story is not one market but five distinct ones moving on different clocks — Japan’s AI-and-rate-hike rally, China’s optimism-versus-overheating tension, Malaysia and Singapore’s steadier regional drift, and Pakistan’s high-beta swings around a genuine structural re-rating. Anyone allocating across the region needs a market-by-market view rather than a single “Asia” thesis.
Next step: Track Bank of Japan policy meetings, China’s Politburo economic guidance sessions, and Pakistan’s State Bank Monetary Policy Committee decisions together — the three events, spaced through the remainder of 2026, are the clearest near-term catalysts for each market’s next move.
Discover more from The Economy
Subscribe to get the latest posts sent to your email.

As of the week ending September 10, 2026, the average 30-year fixed-rate mortgage in the United States stood at 6.76%, up from 6.71% the prior week, according to Freddie Mac’s Primary Mortgage Market Survey reported via Trading Economics. The 15-year fixed-rate mortgage averaged 6.09% over the same period, up from 6.04% a week earlier. A year ago, the 30-year rate averaged 6.35% — meaning today’s borrowers are paying roughly 40 basis points more than they were twelve months prior.
| Loan Type | Recent Average Rate | Prior Week | One Year Ago |
|---|---|---|---|
| 30-year fixed | 6.76% | 6.71% | 6.35% |
| 15-year fixed | 6.09% | 6.04% | 5.50% |
Freddie Mac’s chief economist, Sam Khater, has consistently urged borrowers not to accept the first quote they receive, noting that shopping around and collecting multiple offers can save thousands of dollars over the life of a loan.
Why Rates Are Stuck Near 7%
Three forces have kept mortgage rates elevated through the back half of 2026, and understanding each one helps explain why “wait for rates to drop” has been bad advice for most of the year.
1. The 10-year Treasury yield. Mortgage rates track the 10-year Treasury yield closely, and that yield climbed toward the 4.77%–4.78% range in early September as the U.S. government’s continued heavy borrowing pushed investors to demand higher compensation, according to rate coverage from The Mortgage Reports.
2. Fed policy under a new chair. Fed Chair Kevin Warsh signaled a tougher anti-inflation stance at the Jackson Hole gathering than markets had priced in, pushing the 30-year fixed rate to 6.91% by September 14 — near the psychologically important 7% threshold — as rate-cut expectations were pushed back.
3. Oil and geopolitical risk. Renewed U.S.-Iran tensions pushed oil prices above $93 a barrel in early September, adding inflationary pressure that works against any near-term easing in borrowing costs.
The combined effect has weighed on affordability: the median existing home price hit a record $434,100 in July 2026, meaning a buyer putting 20% down at prevailing rates faces a monthly payment of roughly $2,255 — nearly a quarter of the average family’s annual income, based on figures compiled by NoradaRealEstate’s rate-tracking series.
Credit Acceptance: Why Your Score Still Moves the Needle
The rates quoted above are national averages — what any individual borrower actually pays depends heavily on credit profile, down payment size, and loan type. This is where “credit acceptance” as a search term becomes relevant: lenders price risk on a sliding scale, and the gap between a top-tier borrower’s rate and an average borrower’s rate can run a full percentage point or more.
Featured Snippet Target: Credit acceptance in a mortgage context refers to a lender’s willingness to approve and price a loan based on a borrower’s credit profile — score, debt-to-income ratio, and payment history — with stronger profiles typically qualifying for rates 0.25% to 1% below the published national average, translating into thousands of dollars in savings over a 30-year term.
Government-backed loan programs continue to price meaningfully below conventional rates for borrowers who qualify. As of early September, 30-year VA loans were averaging 6.14%, and 15-year VA loans 5.91% — roughly half a point below their conventional counterparts, based on the same Zillow-sourced data used in NoradaRealEstate’s daily rate tracker. FHA loans have shown a similar discount, reflecting the government guarantee that reduces lender risk regardless of an individual borrower’s score.
Where Rates Might Go From Here
Forecasters remain split. The Mortgage Bankers Association’s own projections, cited in earlier 2025 coverage from Yahoo Finance, expected rates to hold at or just above 6% through 2026 — a forecast that has proven optimistic given the current mid-to-high 6% range. Some housing-market analysts covering the September data have gone further, warning rates could climb above 7% before the year is out if the Fed holds firm on inflation and Treasury yields keep climbing.
For context, rates have swung significantly within 2026 alone: the 30-year fixed dipped as low as 5.98%–6.07% in late February and early March, before climbing back through the summer and into the high 6% range by September. That volatility is itself the headline for borrowers trying to time a purchase — waiting for a “better moment” has not been a reliably successful strategy this year.
Practical Takeaways for Borrowers
- Rate-lock timing matters more than usual in 2026. With daily and weekly swings of 5–15 basis points common, locking a rate the same day you get pre-approved reduces exposure to short-term Treasury-yield volatility.
- VA and FHA borrowers are getting a real discount right now — roughly half a point below conventional rates as of September, per the sources above.
- Improving credit acceptance odds before applying pays off. Paying down revolving debt and avoiding new credit inquiries in the 60–90 days before applying remains the most reliable lever borrowers control directly, even as the broader rate environment stays out of their hands.
- “Marry the house, date the rate” — the idea of buying now and refinancing later when rates fall — has become a talking point in 2026 coverage, but it assumes a refinancing window that may not materialize on any predictable timeline.
The Bottom Line
Mortgage rates today sit in a stubborn mid-to-high 6% band, driven by Treasury-yield pressure, a hawkish Fed stance, and oil-price-linked inflation risk. Credit acceptance — how a borrower’s individual profile is priced against that national backdrop — remains the single biggest lever within a buyer’s control, with government-backed loan programs currently offering the clearest path to a below-average rate.
Next step: Pull rate quotes from at least three lenders before locking, and specifically ask each one to price both a conventional and a government-backed (FHA/VA) option side by side — the spread between the two has been unusually wide in 2026’s rate environment.
Discover more from The Economy
Subscribe to get the latest posts sent to your email.

Former President Donald Trump’s financial balance sheet is undergoing unprecedented pressure. While his estimated net worth fluctuated dramatically following the public listing of Trump Media & Technology Group (TMTG), his real-world liquidity faces severe headwinds from court-ordered judgments, mounting interest, commercial real estate debt maturities, and escalating legal fees.
Understanding the magnitude of Trump’s financial landscape requires separating volatile paper equity from available cash, real estate assets, and legal liabilities.
1. The $454 Million Civil Fraud Judgment and Appeal Bond Dynamics
The largest immediate financial threat stems from New York State Supreme Court Judge Arthur Engoron’s ruling in the civil fraud lawsuit brought by New York Attorney General Letitia James.
- Initial Ruling: Trump was found liable for systematically inflating asset values to secure favorable loan terms and insurance rates.
- Financial Penalty: The court ordered disgorgement of approximately $354 million in ill-gotten gains, plus pre-judgment interest that pushed the initial obligation past $454 million.
- Accruing Interest: Statutory post-judgment interest accrues at 9% per annum (roughly $112,000 per day), steadily increasing the total debt while appeals proceed.
According to legal reporting from [Reuters], securing an appeal bond proved exceptionally difficult. Over 30 surety companies rejected Trump’s requests to guarantee the full amount without liquid collateral, as insurers overwhelmingly refuse to accept real estate as bond backing. An appellate bench subsequently allowed a reduced bond of $175 million, which Trump posted via Knight Specialty Insurance Company to stay enforcement while the appellate division reviews the merit of the ruling.
2. E. Jean Carroll Defamation Verdicts: $88.3 Million in Liability
In addition to state-level regulatory judgments, federal jury decisions in New York have created substantial financial commitments:
| Case | Jury Award | Status / Collateral Mechanism |
| Carroll I (Sexual Abuse & Defamation) | $5.0 Million | Placed in court-monitored escrow during appeal. |
| Carroll II (Defamation) | $83.3 Million | Secured via an $91.6 million appeal bond posted through Federal Insurance Co. (Chubb). |
As detailed by [CNBC], these judgments require collateralization regardless of ongoing appeals. Trump was forced to lock up cash or liquid securities to secure these bonds, directly contracting his available operational liquid reserves.
3. Trump Media (DJT): Paper Billions vs. Realizable Cash
The public debut of Trump Media & Technology Group Corp. (NASDAQ: DJT) via a SPAC merger briefly added billions to Trump’s paper net worth. However, financial analysts at [Forbes] note that transforming paper valuation into usable cash presents critical structural obstacles:
- Fundamental Disconnect: TMTG’s multi-billion-dollar valuation stands in stark contrast to its underlying balance sheet, which showed modest revenues against notable operational expenses.
- Market Impact of Cashing Out: Trump owns roughly 57% to 60% of the company. Any large-scale liquidation of his shares to cover cash liabilities risks signaling a loss of confidence, potentially triggering a sharp price decline before significant volume can be sold.
- Lock-Up Agreement Expirations: While lock-up restrictions initially prevented insider selling, the expiration of these periods subjects the stock to heightened market volatility and short-selling pressure.
4. Commercial Real Estate Exposure & Refinancing Headwinds
A substantial portion of Trump’s traditional wealth remains tied up in commercial real estate—a sector currently suffering from high interest rates, declining office occupancies, and tightened banking credit standards.
Trump Asset Portfolio Exposure
├── Commercial Properties (High debt exposure / Refinancing risk)
│   ├── 40 Wall Street (NYC)
│   └── Trump Tower Commercial Space (NYC)
├── Golf Courses & Resorts (Stable cash flow / High capital expenditure)
└── Brand Licensing & Cash Equivalents (Encumbered by legal escrow/bonds)
Key commercial debt obligations reported by [The Wall Street Journal] highlight specific vulnerabilities:
- 40 Wall Street (New York): The property’s debt was placed on lender watchlists in recent years due to rising vacancy rates, falling net operating income (NOI), and elevated ground-lease costs.
- Refinancing Risks: With commercial mortgage-backed securities (CMBS) debt maturing across several properties, refinancing in a high-rate environment significantly increases debt service payments, squeezing operational margins.
5. Political Action Committee (PAC) Legal Expense Drain
Legal fees have consumed a massive share of Trump’s available political fundraising funds. As documented by [The New York Times], Donald Trump’s leadership PAC, Save America, has spent tens of millions of dollars funding legal defense fees for the former president and co-defendants across multiple jurisdictions.
This drain on donor funds creates a dual liability:
- It diverts resources away from political field operations and advertising.
- It exposes the campaign structure to ongoing cash demands as criminal and civil proceedings drag on.
Financial Outlook & Solvency Risks
Trump’s asset portfolio is characterized by a strong imbalance between illiquid real estate equity and immediate cash demands.
Total Cash Demands (Judgments + Bonds Posted) : ~$260M+ Cash Restricted/Encumbered
Pending Liabilities (If Appeals Fail)        : ~$540M+ Total Direct Civil Cash Penalties
While Trump’s overall asset base—including golf courses, residential property, and brand licensing—remains valuable, his immediate solvency depends heavily on appellate court decisions. Should the appellate courts uphold the full civil fraud judgment without reduction, the need for immediate cash could force distressed asset sales or high-cost private equity financing, fundamentally altering the Trump Organization’s financial baseline.
Discover more from The Economy
Subscribe to get the latest posts sent to your email.

Asian Stock Markets 2026: Japan, China, Pakistan & More

Mortgage Rates Today 2026: Full Rate Guide & Forecast

Beyond Paper Wealth: Unpacking Donald Trump’s Multibillion-Dollar Liquidity and Legal Crisis

Bitcoin & XRP 2026: Inside Crypto’s Institutional Era

Global Economy 2026: IMF Growth, AI Stocks & Market Risk

China’s Local Debt Race Against Time: Why Economists Demand Central Action Before the Deflation Window Closes

Money News: How to Protect Your Portfolio From Global Inflation

World Bank Projections: Emerging vs. Big Economies of Asia

IMF Reports 2026: What the Latest Data Means for the Global Economy

Singapore Stocks Outlook: A Safe Haven in the Asian Market?

China Stocks vs. Japan Stocks: Where Should You Invest in Late 2026?

VIX Index Explained: How to Trade Wall Street’s Fear Gauge Today

Commercial vs Residential Real Estate: Which Wins in 2026?

Presidential Stock Market Performance: How Trump’s Second Term Compares to History

Top 30 Stocks for Investment in PSX for Massive ROI in 2026

SpaceX Starship Flight 14: First Orbital Attempt & Starlink V3 Launch Explained

AI Chip Stocks 2026: The Best Semiconductor Investments Beyond Marvell

The 2026 Crypto Regulatory Shift: What It Means for Institutional Investors

Oil Prices Break $100 in 2026: Middle East Conflict & Energy Markets

Fidelity Investments Review 2026: SPAXX Yields & Zero-Fee Funds

Tween Back-to-School Trends 2026: What’s Driving the $85B Season

AI-Powered Training: The Next Multi-Billion Dollar Ecosystem in Fitness

BRICS+ Cross-Border Payments 2026: Interoperability Explained

10-Year Treasury Yield Hits 4.80%: What It Means for Rates & Portfolios

Shein Clothes Quality & Safety in 2026: What Lab Tests Show

China’s US$10.8 Billion Trade Shortcut: Why the Pinglu Canal Matters

MRVL Earnings 2026: Why Marvell Sank Despite Beating Estimates

Leveraging Viral AI & Climate Hashtags for Brand Growth on X
-

 Markets & Finance9 months ago
Top 15 Stocks for Investment in 2026 in PSX: Your Complete Guide to Pakistan’s Best Investment Opportunities
-

 Analysis7 months ago
Johor’s Investment Boom: The Hidden Costs Behind Malaysia’s Most Ambitious Economic Surge
-

 Analysis7 months ago
Top 10 Stocks for Investment in PSX for Quick Returns in 2026
-

 Analysis8 months ago
Brazil’s Rare Earth Race: US, EU, and China Compete for Critical Minerals as Tensions Rise
-

 Banks8 months ago
Best Investments in Pakistan 2026: Top 10 Low-Price Shares and Long-Term Picks for the PSX
-

 Investment8 months ago
Top 10 Mutual Fund Managers in Pakistan for Investment in 2026: A Comprehensive Guide for Optimal Returns
-

 Global Economy9 months ago
15 Most Lucrative Sectors for Investment in Pakistan: A 2025 Data-Driven Analysis
-

 Global Economy9 months ago
Pakistan’s Export Goldmine: 10 Game-Changing Markets Where Pakistani Businesses Are Winning Big in 2025