
Analysis
Qatari Stocks Plunge Amid Iran Retaliation: UAE Markets Shuttered as Middle East Tensions Escalate Gulf Economic Fallout
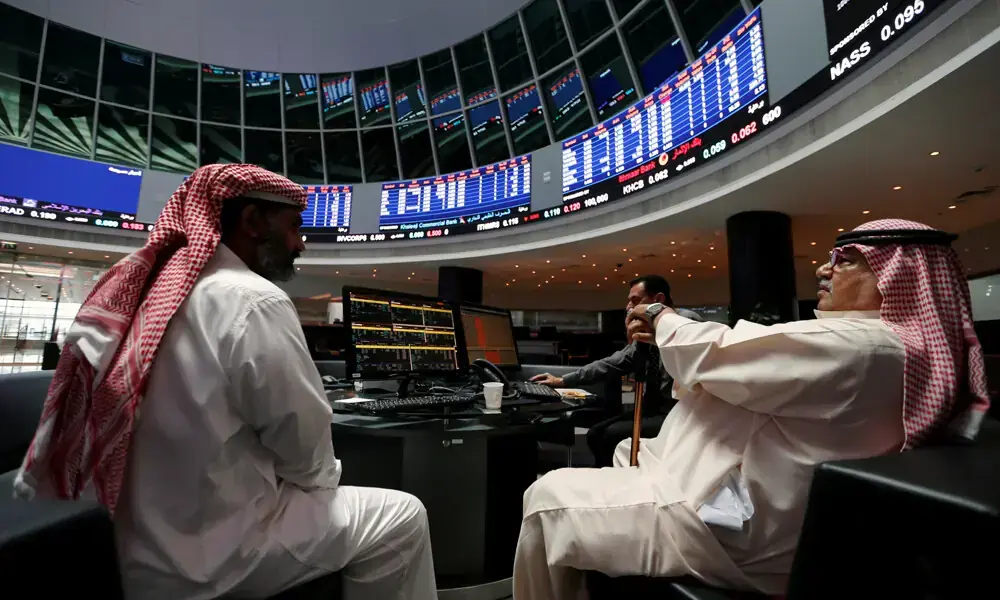
Gulf stock markets reeled on March 2–3, 2026, as Qatar’s QE Index dropped 3.3–3.7%, UAE bourses shut for two days, and Brent crude surged past $82 a barrel—the sharpest regional market shock since the 2003 Iraq War—after Iran’s retaliatory strikes targeted cities across the Gulf following the killing of Supreme Leader Ali Khamenei.
On the morning of March 2, 2026, the trading floors of Doha fell silent under the weight of something that felt less like economics and more like history. Smoke was still rising over parts of Dubai. Reports of explosions above Doha had persisted for a second consecutive day. Major airports across the Gulf—Abu Dhabi, Dubai, Doha—were either shuttered or operating at drastically curtailed capacity. And when Qatar’s benchmark stock index opened for the first time since the weekend’s cataclysm, it fell with a velocity that told its own grim story.
The trigger was unambiguous: a coordinated U.S.–Israeli military campaign, code-named Operation Epic Fury, had killed Iranian Supreme Leader Ayatollah Ali Khamenei and struck Iran’s nuclear and military infrastructure. Tehran’s response was swift, sweeping, and historic—hundreds of missiles and drone barrages aimed at U.S. military installations and civilian infrastructure across every major Gulf state. The region that had spent three decades marketing itself as the world’s most reliable crossroads of commerce was, overnight, a theatre of war.
The economic consequences have been immediate, measurable, and—depending on how the next seventy-two hours unfold—potentially generational. This is the story of what happened to Gulf markets, why it matters to the world, and what comes next.
The Events That Shook a Region
The strikes began on Saturday, February 28. By Sunday, March 1, as Reuters reported (DA 94), Iran had launched retaliatory attacks not just against Israel but across a remarkable geographic arc—Kuwait, Bahrain, Jordan, Saudi Arabia, Iraq, Oman, Qatar, and crucially, the UAE. Three people were killed in the UAE alone; hundreds of missiles and drones were intercepted, but many penetrated defenses, hitting near Zayed Port in Abu Dhabi and triggering alarm across residential districts in Dubai.
Israel launched fresh strikes on Tehran on Sunday, prompting yet another wave of Iranian barrages—a cycle of action and retaliation that President Donald Trump indicated on Truth Social would continue, in his words, “uninterrupted throughout the week or as long as necessary.” Iran, for its part, had IRGC (Islamic Revolutionary Guard Corps) forces broadcasting VHF warnings to vessels in the Strait of Hormuz: “No ship is allowed to pass.”
“Iran’s continuing missile and drone strikes on GCC countries have pushed markets into uncharted territory.” — Iridium Advisors, March 1, 2026
The Strait of Hormuz—a 33-kilometre-wide chokepoint through which, according to the U.S. Energy Information Administration, roughly 20 million barrels of oil transit daily—had effectively ceased to function. Tankers were idling on both sides of the strait. One oil tanker was struck off the coast of Oman. Insurance underwriters pulled coverage. Bloomberg (DA 94) confirmed that tanker traffic through the world’s most critical energy corridor had “largely halted.”
Gulf Market Reactions: A Market in Freefall
The financial verdict was swift and brutal. As reported by Zawya, Qatar’s QE Index—which had been closed for a public holiday on Sunday—opened Monday morning and dropped between 3.3% and 3.7%, with every single constituent falling. The country’s biggest bank, Qatar National Bank, declined 3.7%. Qatar Islamic Bank plunged 5.2%—on course for its worst single session since August 2023—after HSBC cut its price target. Maritime and logistics firm Qatar Navigation tumbled 6.2%, and LNG shipping company Qatar Gas Transport retreated 4.1%.
Qatar’s exposure is not merely symbolic. It is home to the largest U.S. military base in the region—Al Udeid Air Base—making it simultaneously a target and a linchpin of Western strategic positioning. Its LNG infrastructure, among the world’s most productive, is precisely the kind of asset that makes markets nervous when missile trajectories are being plotted nearby.
The UAE’s response was more radical, and in some ways more revealing. Bloomberg (DA 94) confirmed that the UAE Capital Markets Authority directed both the Abu Dhabi Securities Exchange (ADX) and the Dubai Financial Market (DFM) to remain closed on March 2 and March 3. The regulator cited its “supervisory and regulatory role” and committed to monitoring the situation on an “ongoing basis.” The unspoken reason was starker: a market reopening amid missile strikes against a city whose entire economic identity is built on stability would have risked a rout.
Dubai’s modern identity—built from a fishing village into a $500 billion economy through ports, aviation, real estate, and financial services—now faced an existential stress test. “The UAE relies on the frictionless movement of people and goods,” Stephen Fallon, founder of DBM Consulting, told The National (DA 76). “This is really bad for states like the UAE, because this is sort of the necessary oxygen to their economic model.”
Elsewhere, Saudi Arabia’s Tadawul All-Shares Index opened Sunday down 4.8%, recovering to close 2.2% lower. Kuwait suspended trading entirely—citing “exceptional circumstances”—while Bahrain fell 1%, Oman declined 1.4%, and Egypt’s blue-chip index, after plunging 5.5% in early trade, settled 2.5% down.
Oil Prices Surge: The Energy Shock Beneath the Headlines
The deeper and more globally consequential dimension of this crisis is oil. When futures markets opened Sunday evening, they moved with the kind of speed that suggests not just fear, but structural alarm. CNBC (DA 93) reported that Global benchmark Brent crude jumped approximately 9%, or $6.54, to $79.41 a barrel. Earlier in the session, Brent briefly spiked to $82.37—its highest level since January 2025—before settling back.
Barclays analysts revised their Brent crude forecast to $100 per barrel from an earlier estimate of $80, while UBS warned that a material disruption to Strait of Hormuz flows could push prices above $120 per barrel. CNBC (DA 93) noted that Amrita Sen of Energy Aspects expects prices to hold around the $80 level, absent a complete Hormuz closure. But the critical caveat is the qualifier: absent.
“Roughly one-fifth of global oil supply passes through the Strait of Hormuz… markets are more concerned with whether barrels can move than with spare capacity on paper.” — Jorge León, Rystad Energy
The Strait of Hormuz handles approximately 30% of the world’s seaborne crude oil, nearly 20% of global jet fuel, and about 16% of gasoline and naphtha, Al Jazeera (DA 92) reported. Some 84% of crude transiting the strait is bound for Asian markets—China, India, Japan, and South Korea accounting for 69% of all flows. A prolonged disruption does not merely rattle Gulf economies; it structurally threatens Asian manufacturing supply chains, inflationary dynamics in import-dependent economies, and the broader trajectory of global growth.
OPEC+ moved to boost production by 206,000 barrels per day in April—more than analysts expected—but energy analysts were circumspect. “Additional production will provide limited immediate relief, making access to export routes far more important than headline output targets,” said Jorge León of Rystad Energy. Saudi Arabia does have contingency infrastructure—an East-West pipeline connecting its Gulf terminals to Red Sea export facilities—which could partially compensate. But Iraq, Kuwait, and UAE have no such alternative.
Geopolitical Stakeholders: A Fractured Calculus
Every party in this escalation carries competing imperatives that make resolution as complex as the conflict itself.
The United States launched the strikes with stated objectives around Iran’s nuclear program. President Trump described Operation Epic Fury as an “overwhelming military offensive” that would continue until its objectives are achieved, framing economic disruption as a manageable secondary variable. The Atlantic Council offered a sober counterweight: during U.S. operations in Iraq between 2003 and 2011, crude averaged roughly $72 per barrel in nominal terms—well above the pre-crisis baseline of this conflict. The global economy adapted then; analysts argue it can adapt again. The strategic dilemma, however, is that prolonged price pressure may force a premature exit before nuclear objectives are secured.
Gulf States occupy an uncomfortable middle ground—dependent on American security guarantees, deeply intertwined with Iran economically and through sectarian politics, and now literally in the crosshairs. UAE officials sought to project normalcy: Abu Dhabi National Oil Company (ADNOC) announced its operations were continuing without interruption, a signal to international markets that core energy infrastructure remained intact. But Dubai International Airport’s suspension of operations—affecting one of the world’s busiest aviation hubs—was a visible and visceral disruption that no press release could fully offset.
Iran under post-Khamenei leadership faces an existential reckoning. The killing of the Supreme Leader creates not just a power vacuum but potentially a legitimacy crisis for the entire theocratic architecture of the Islamic Republic. Whether hardliners consolidate control and intensify strikes, or pragmatists seek off-ramps through negotiation, is the single most important variable in the coming days.
Israel continues fresh strike waves even as Iran retaliates—a posture that suggests a willingness to see the conflict expand rather than stabilize. Israeli officials have long argued that a nuclear-armed Iran represents an existential threat; this military action reflects a strategic judgment that the window to prevent that outcome is narrowing.
The Broader Economic Ripple: Supply Chains, Inflation, and Investor Sentiment
Beyond the immediate market shock, Reuters (DA 94) characterized Iran’s retaliatory strikes as triggering “the most widespread business disruption in the region since the pandemic.” The UAE federal labor authority advised companies to implement remote working through March 3. Major international firms with regional headquarters in Dubai and Abu Dhabi began activating business continuity protocols. Shipping insurance premiums—even for routes not directly through Hormuz—began climbing as underwriters repriced geopolitical risk across the entire region.
Khaled El Khatib, chief market analyst at easyMarkets, identified Dubai and Saudi Arabia as the most exposed to fast, volatile market reactions given their integration into international capital flows. “The foreign participation in the Saudi market, and the ‘safe haven’ title for the UAE market will make them more exposed to short-term volatility,” he said. This observation carries structural weight: the very attributes that made these markets attractive to international capital—openness, liquidity, integration—have made them more vulnerable to crisis-driven outflows.
For oil-producing states—particularly Saudi Arabia and Qatar—elevated crude prices deliver a fiscal windfall even as they absorb geopolitical risk. “Elevated oil prices provide a fiscal cushion for producers such as Saudi Arabia and Qatar,” Reuters noted, “strengthening revenues and liquidity.” Saudi Aramco shares, paradoxically, rose 1.5% on Monday as investors priced in the revenue upside. This fiscal duality—crisis as both threat and unexpected beneficiary—is one of the more counterintuitive dynamics of Gulf economics.
The Outlook: Duration Is Everything
The dominant variable in every projection—market, energy, geopolitical—is duration. A short, sharp conflict with a swift diplomatic resolution would likely see Gulf markets recover within weeks, oil prices ease, and aviation and shipping resume. History offers precedent: Israel’s 12-day conflict with Iran in 2025 produced oil spikes that reversed sharply upon ceasefire.
A protracted conflict is a categorically different scenario. CNN (DA 95) cited oil analyst Ellen Wald warning that if vessels avoid the Strait for weeks, “we will probably have some serious problems, particularly in Asia, for availability of crude oil and oil products”—potentially producing “serious price hikes and potentially even shortages.” Mohammed Ali Yasin, CEO of Ghaf Benefits, was blunt: “Markets will continue to be fragile and volatile as long as the military actions are active.”
Three scenarios present themselves. In the most benign, a U.S.–Iran ceasefire emerges within days—perhaps brokered through Omani or Swiss intermediaries—and markets rally sharply on relief. In a moderate scenario, weeks of limited strikes continue but Hormuz flows partially resume; oil stabilizes around $80–85 and Gulf markets discount a prolonged but bounded disruption. In the most severe scenario, sustained attacks on energy infrastructure or a complete Hormuz closure pushes Brent toward $120, triggers inflation surges in Asian economies, and imposes lasting reputational damage on the UAE’s status as a global business hub.
Conclusion: The Price of Proximity
There is a profound irony embedded in this crisis. The Gulf states spent forty years transforming themselves from oil-dependent backwaters into diversified, internationally integrated economies precisely to insulate themselves from the region’s endemic volatility. Dubai built the world’s busiest airport. Abu Dhabi listed its sovereign companies on international exchanges. Doha hosted world cups and peace negotiations. All of it was predicated on the implicit promise of stability—that geography could be decoupled from geopolitics.
That premise is now under its most direct challenge in decades. The Strait of Hormuz drop—so narrow a vessel barely fits—has always been the region’s economic Achilles heel. The events of this week have made that vulnerability undeniable to every institutional investor, every shipping insurer, every airline, and every global supply chain manager with Asian exposure.
And yet the region’s resilience should not be underestimated. Gulf sovereign wealth funds hold trillions in diversified global assets. Oil revenues—however they came to spike—will flow into reserves that underpin long-term economic planning. The fundamental commodity that the Gulf sits atop remains the most strategically important on earth. These are not economies that collapse under pressure; they absorb it, adapt to it, and—in the best historical cases—emerge stronger.
The question is not whether the Gulf will survive this crisis. It is what form of survival awaits—and at what cost, measured not just in basis points and barrel prices, but in the confidence that made this corner of the world worth watching in the first place.
Discover more from The Economy
Subscribe to get the latest posts sent to your email.


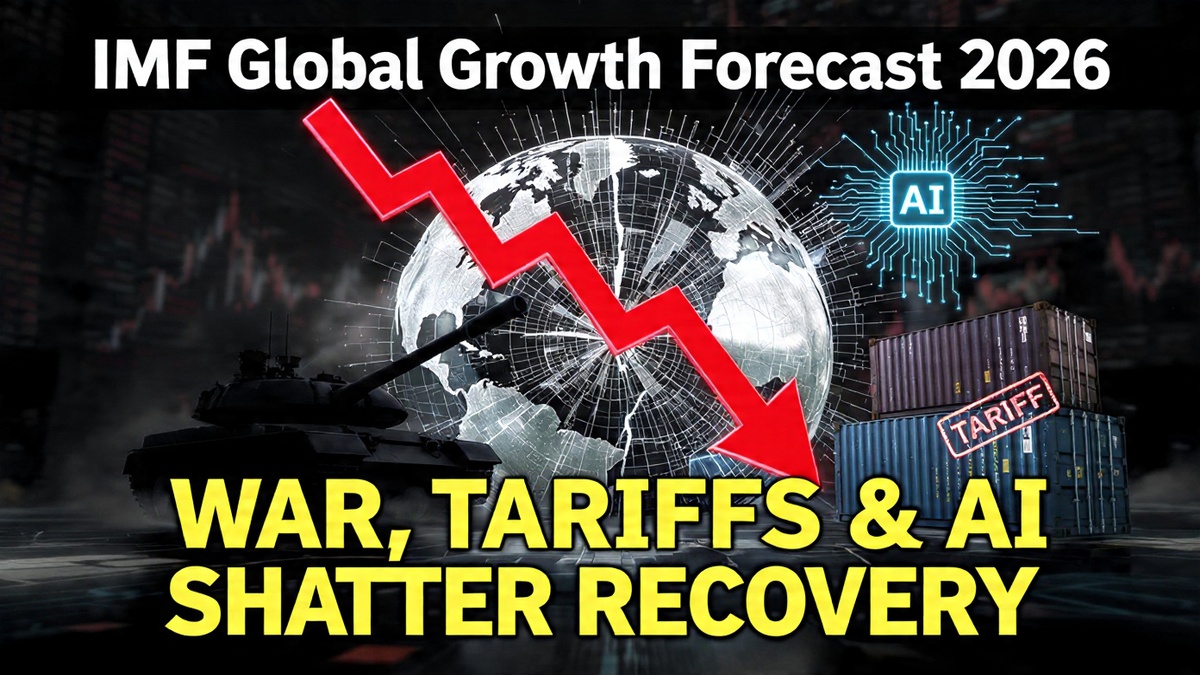
The IMF cut its 2026 global growth forecast to 3.1% as the Iran war, renewed US tariff threats, and AI investment uncertainty converge. Inside the most fragile global economic outlook since COVID.
The International Monetary Fund’s April 2026 World Economic Outlook carried an unusually sober subtitle: Global Economy in the Shadow of War. It was not rhetorical flourish. The Fund revised its global growth forecast to 3.1%, down from 3.4% in 2025, describing the path ahead as “fragile and highly sensitive to further disruption.” For a global economy already navigating post-pandemic fiscal consolidation, residual supply chain reorganisation, and the early strains of AI-driven labour displacement, the additional weight of a major Middle East war proved decisive in shifting the risk calculus.
Three Shocks Arriving Simultaneously
The IMF identified three overlapping risks that distinguish 2026’s fragility from prior cycles. First, the geopolitical shock: the US-Israeli war on Iran, which disrupted Strait of Hormuz oil flows, triggered inflation across energy-dependent economies, and introduced military escalation scenarios that financial markets struggled to price. Second, trade policy uncertainty: the Trump administration’s inauguration of an investigation into 60 countries for alleged facilitation of forced-labour imports — including the European Union — with tariffs of 10-12.5% threatened on their exports to the United States. Third, AI investment uncertainty: the possibility that the large AI productivity gains priced into equity markets may arrive more slowly, or be more concentrated, than consensus assumes.
The Financial Stability Board’s Warning on War Risk
The Financial Stability Board — comprising central bankers, regulators, and finance ministers from G20 countries — warned that the Middle East conflict was creating significant global financial instability, with rising market volatility, tighter financial conditions, and risks from stretched asset valuations, high leverage in non-bank finance, and liquidity mismatches. The FSB explicitly flagged that these vulnerabilities could amplify shocks in sovereign bond markets, private credit, and broader financial stability if conditions deteriorated.
Against this backdrop, Goldman Sachs documented hedge funds buying a record $86 billion in stocks over five sessions — a surge driven mainly by systematic, trend-following strategies responding to easing geopolitical tensions. The bank estimated funds could add another $70 billion if momentum continued. The divergence between systematic strategy positioning and the IMF’s fundamental outlook captured the market’s central tension: short-term momentum traders on one side, long-term structural risk assessors on the other.
Regional Divergence: Banks Profit, Emerging Markets Struggle
Major US banks delivered first-quarter earnings that reflected institutional resilience rather than broader economic health. Goldman Sachs posted its best quarter in years. Morgan Stanley’s stock traders benefited from volatility-driven volume surges. Bank of America reported earnings growth driven by higher trading revenue. The “big six” US banks collectively posted profits above consensus estimates — a pattern that reflects how institutional financial businesses often benefit from the very volatility that damages real-economy participants.
South Korea’s financial markets, after a sharp March selloff, attracted returning foreign investors on easing Middle East tensions, AI-driven tech demand, and reform momentum. But the won remained near multi-decade lows, and the economy retained significant exposure to energy price shocks. UK lenders began cutting fixed mortgage rates as swap rates fell following the stabilisation of Middle East tensions — offering relief to borrowers, though rates remained elevated relative to pre-crisis levels.
The divergence between institutional financial performance and household economic wellbeing is one of 2026’s defining features. Financial markets can absorb, price, and even profit from uncertainty. Households and small businesses, lacking the hedging tools and balance sheet depth of institutions, bear the uncertainty without corresponding offset.
Discover more from The Economy
Subscribe to get the latest posts sent to your email.
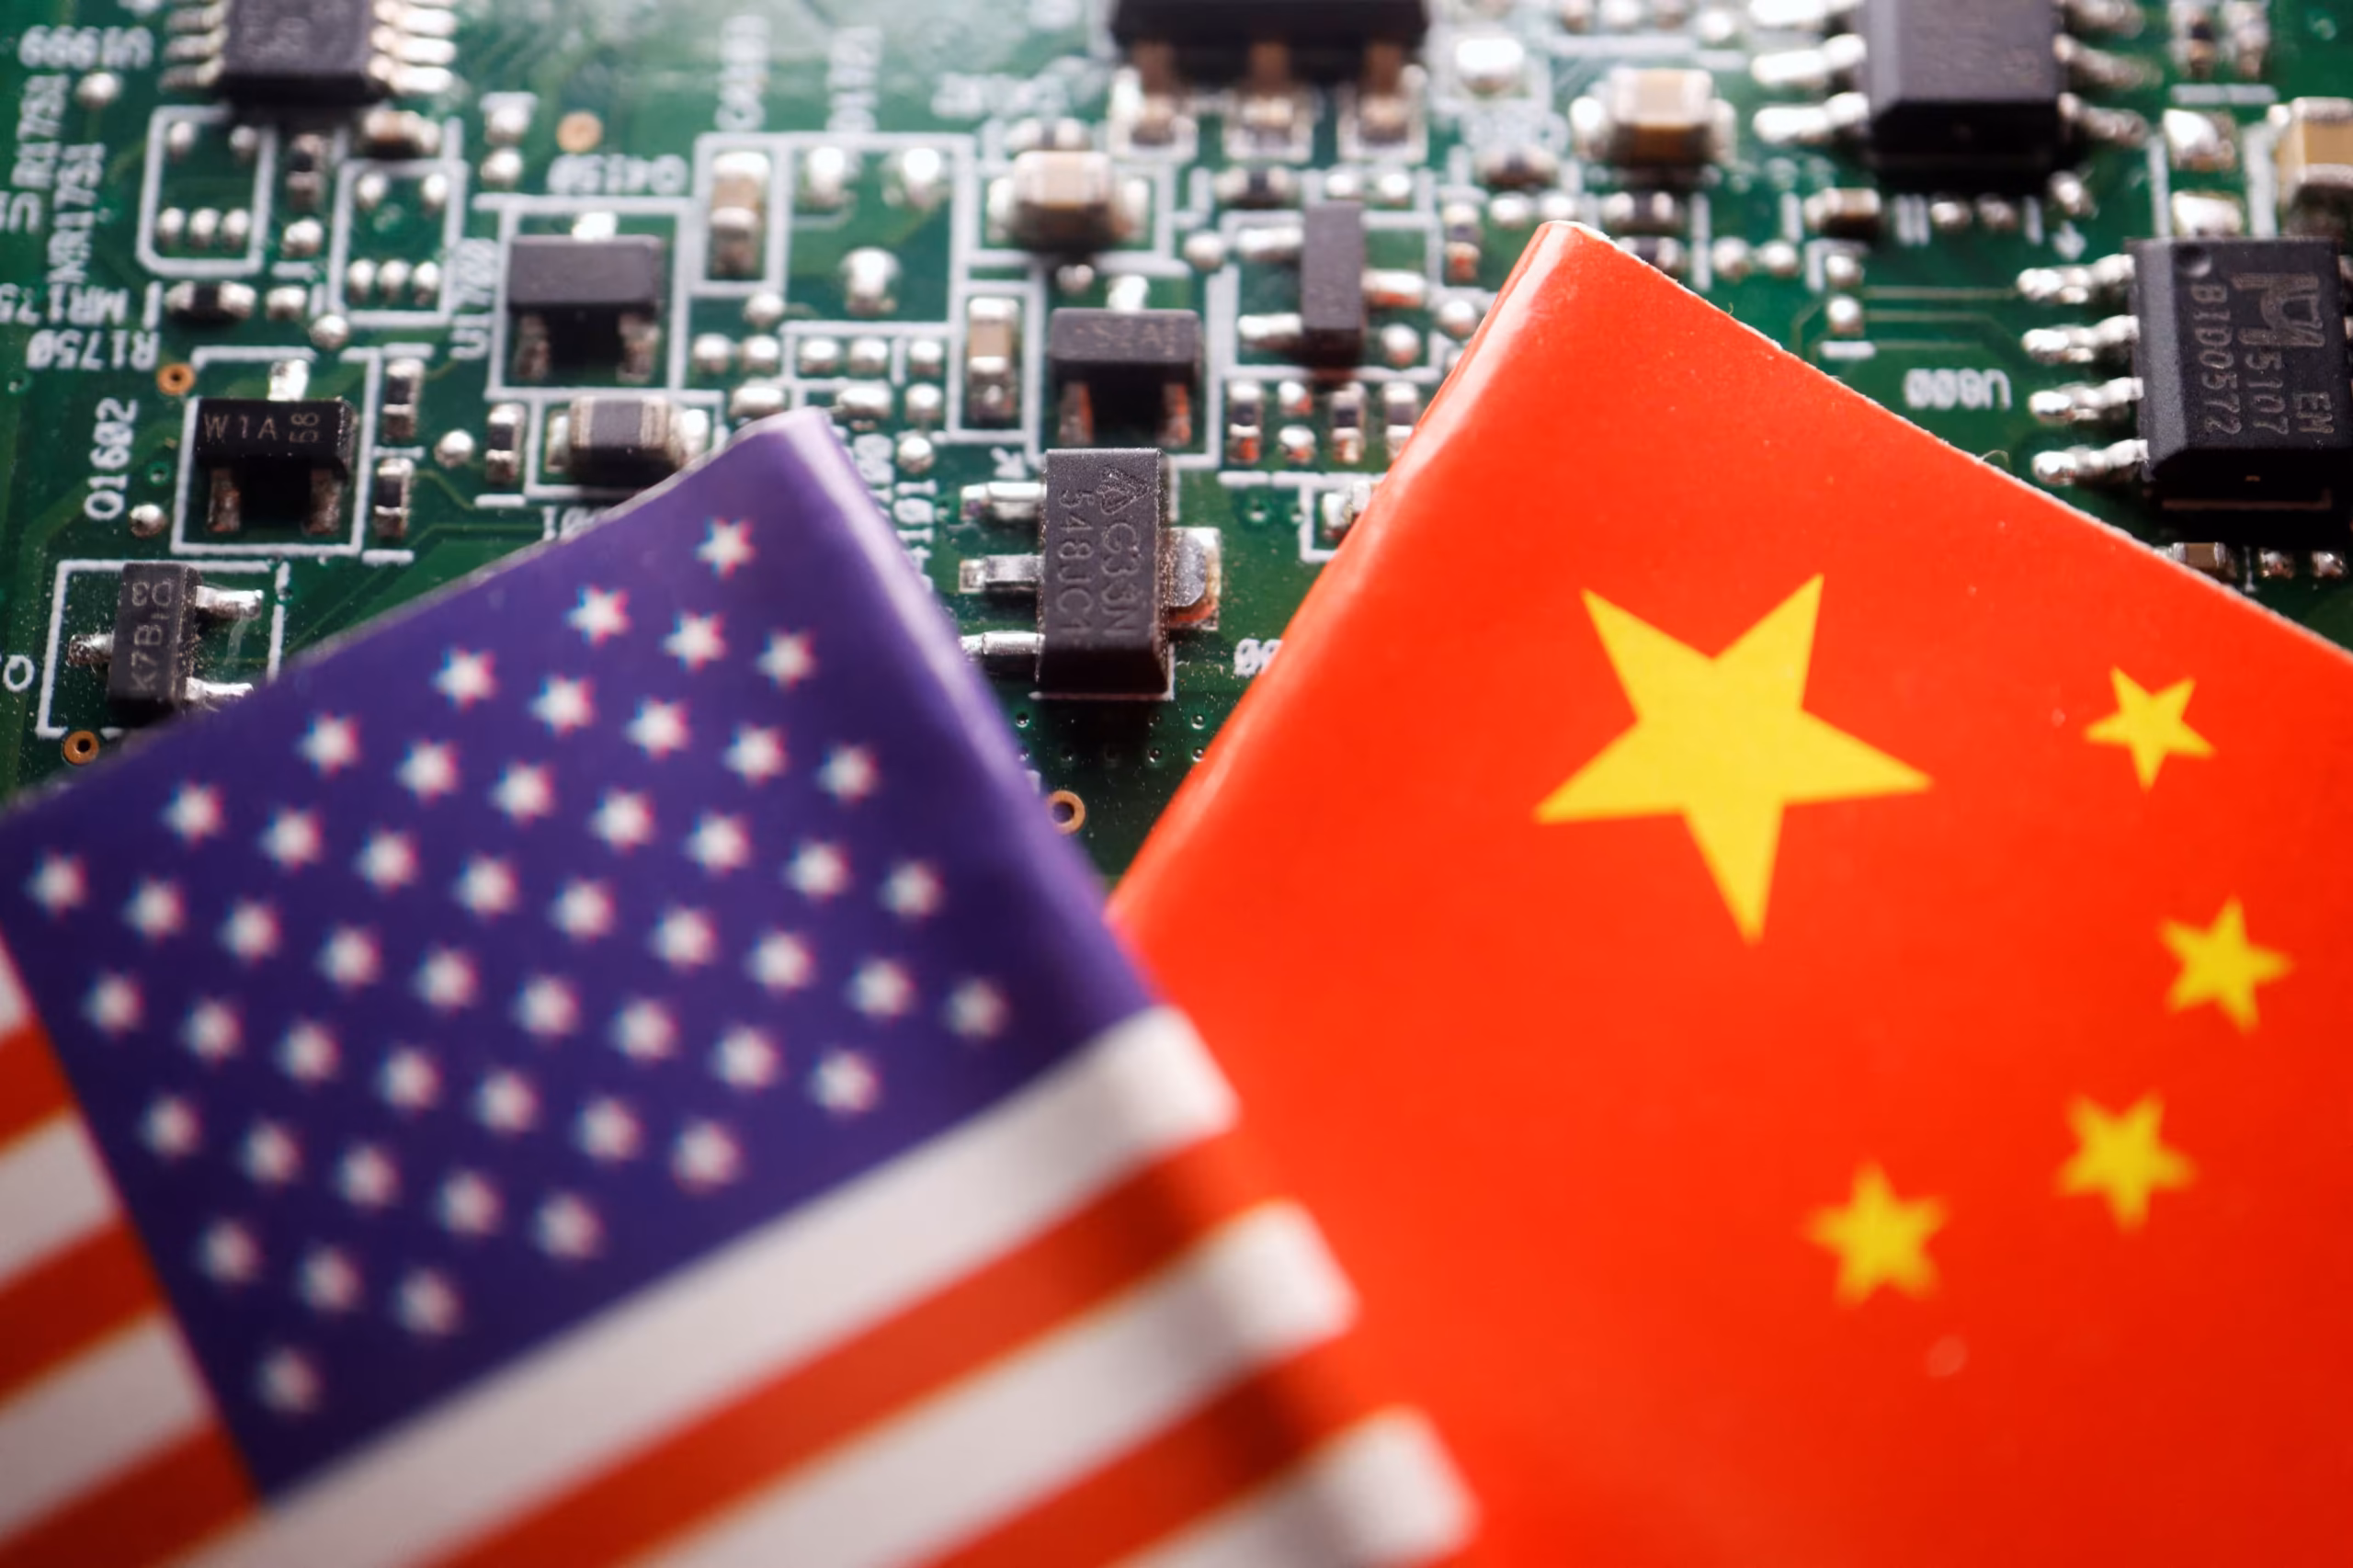
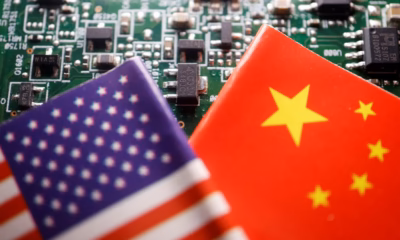
China’s domestic chip ecosystem is accelerating even as US export controls tighten. With tungsten up 557% and Nvidia’s China share halving, we map the permanent splitting of the global semiconductor supply chain.The global semiconductor supply chain is bifurcating. This statement was contested in 2023, hedged in 2024, and is now — as of 2026 — treated as a structural baseline by supply chain strategists, chipmakers, and government planners on both sides of the Pacific. The question has shifted from whether the split will happen to how deep and permanent it will become.
The evidence is visible in multiple datasets simultaneously. Nvidia, which once commanded over 90% of the Chinese AI chip market, had seen that share decline to approximately 50% by early 2026 — not because US export controls had successfully denied China access to capable chips, but because the combination of tariffs, “buy local” mandates, and regulatory uncertainty had accelerated Chinese enterprises’ migration to domestic alternatives. Meanwhile, China’s semiconductor output surged 87% year-on-year in May 2026, underscoring that domestic production capacity was advancing at a pace that few had forecast five years ago.
The Tungsten Shock: A Materials Leverage Beijing Chose to Use
In February 2026, China added tungsten to its export control list as trade tensions with the United States escalated. The consequence was rapid and severe. Tungsten prices rose 557% in just over a year — outperforming gains in gold, copper, and oil by a wide margin. Chinese exports of restricted tungsten products fell approximately 40% in 2025. The strategic logic was precise: China controls roughly 79% of global tungsten mine production, and tungsten’s exceptionally high melting point and density make it an essential input for chipmaking — both in chips themselves and in multiple fabrication processes at advanced nodes.
The move demonstrated that materials leverage extends far beyond rare earths. For semiconductor supply chains already under AI-driven demand stress, the tungsten shock added a new category of critical bottleneck that western efforts to build alternative supply chains cannot resolve in the near term.
Nvidia’s Paradox: Export Controls and the H200 Restart
The Nvidia-China relationship in 2026 illustrates the inherent contradiction of export controls applied to commercially motivated technology companies. After a roughly ten-month freeze on advanced chip exports to China — during which Nvidia absorbed a $5.5 billion charge tied to stranded inventory — a December arrangement allowed H200 sales to approved Chinese customers, with the US government taking a 25% cut of revenues. The arrangement normalised commerce while creating a fiscal mechanism for the US government.
Chinese tech firms collectively placed orders for more than two million H200 units for 2026 delivery — a volume that simultaneously demonstrates unmet demand and the limits of export control effectiveness. Where legal channels are closed, demand finds other pathways: a DOJ indictment unsealed in 2026 detailed a scheme involving approximately $2.5 billion in Supermicro servers containing restricted Nvidia GPUs being smuggled to Chinese buyers.
China’s Domestic Progress: Real but Incomplete
China’s semiconductor self-sufficiency ambitions are advancing, but the trajectory is uneven across subsectors. SMIC and Hua Hong have made genuine progress at mature nodes. Equipment vendors Naura and AMEC are gaining market share globally. The country’s AI chip domestic alternatives — while not yet matching Nvidia’s leading-edge capability — are advancing at an accelerating pace under the pressure of necessity.
The critical constraint remains high-bandwidth memory. CXMT, China’s domestic HBM producer, is targeting viable HBM3 yields in 2026 and HBM3E by 2027. If those milestones are achieved on schedule, Nvidia’s current China advantage — which exists precisely because China’s domestic HBM production remains constrained — will narrow materially. The competitive window is real but finite.
The Strategic Implication: Permanent Bifurcation as Business Baseline
For supply chain strategists, the most consequential shift is not any individual export control or price spike — it is the recognition that the global semiconductor supply chain’s bifurcation is permanent. Semiconductor leaders navigating this environment most effectively are treating the US-China bifurcation as a structural feature of the landscape, not a temporary disruption awaiting resolution.
This means conducting detailed audits of supplier dependencies, stress-testing revenue models against scenarios where China access is restricted or structurally changed, and tracking China’s domestic chip progress as a competitive variable rather than a geopolitical curiosity. Revenue projections that assume stable China market access now carry geopolitical risk that most financial models have not historically priced.
The age of a single, integrated global semiconductor supply chain is over. The question is how many chains will replace it, and at what cost.
Discover more from The Economy
Subscribe to get the latest posts sent to your email.
AI
AI Infrastructure Debt Bubble 2026: $570 Billion in Global Debt Issuance Raises Systemic Risk Alarm

Morgan Stanley estimates AI-related global debt issuance will hit $570 billion in 2026, with hyperscaler spending exceeding $1 trillion by 2027. Oracle’s crisis may be the first systemic warning sign.
The question Wall Street was reluctant to ask openly throughout 2024 and most of 2025 is now unavoidable: is the AI infrastructure buildout generating a debt burden that markets have not yet properly priced?
The numbers have become too large to dismiss as routine capital expenditure cycles. Morgan Stanley estimates that AI-related global debt issuance will more than double to nearly $570 billion in 2026, with aggregate hyperscaler capital expenditure projected to exceed $1 trillion by 2027. That figure encompasses spending by Amazon, Microsoft, Alphabet, Meta, Oracle, and a growing constellation of second-tier infrastructure providers building the physical layer of the AI economy.
How the Debt Stack Has Built
The trajectory of Oracle’s balance sheet is instructive as a case study in the speed at which leverage can accumulate. In fiscal 2025, Oracle carried a net cash deficit of approximately $394 million after free cash flow. By the end of fiscal 2026, that had deteriorated to negative $23.7 billion in free cash flow, with long-term debt reaching approximately $124.7 billion. Capital expenditures of $55.7 billion in a single fiscal year represent a 162% increase from the prior year.
Oracle is not alone, though its position is the most stretched. The structural dynamic across the hyperscaler complex is that the companies investing most aggressively in AI data centre capacity are simultaneously facing competitive pressure on their existing software and cloud businesses from AI-native tools — creating a margin squeeze that occurs precisely when cash demands are highest.
Credit Default Swaps as an Early Warning System
One underappreciated signal in this cycle is the behaviour of credit default swaps. Fortune reported that Morgan Stanley’s Lisa Shalett flagged Oracle’s CDS widening as a potential early indicator of broader AI trade stress. CDS spreads — which function as insurance premiums against corporate default — had reached record levels for Oracle by early 2026, even before the most recent earnings-related stock decline.
The concern Shalett articulated was systemic rather than company-specific: “If people start getting worried about Oracle’s ability to pay, that’s gonna be an early indication to us that people are getting nervous.” For a company whose debt is included in major corporate bond indices, the widening of Oracle’s CDS spreads has implications not just for Oracle investors but for anyone holding investment-grade credit exposure broadly.
Bank of America Research described “the lack of clarity on hyperscaler borrowing” as “the key risk going into 2026” — a view validated by subsequent events as Oracle’s stock collapsed and CDS widened even further.
The OpenAI Nexus
A critical vulnerability embedded in the current AI infrastructure cycle is concentration around OpenAI as both the defining customer and the primary justification for hyperscaler spending. Oracle‘s remaining performance obligations are concentrated at least $300 billion in the OpenAI relationship. OpenAI itself is burning cash at what one analyst described as “an insane rate” and has committed to more than $1.4 trillion in total AI buildouts — a commitment that depends on the company’s own ability to sustain fundraising and ultimately generate revenue at scale.
The logical chain from that dependency is a concern articulated plainly by Melius Research: “It is hard to know if Oracle can stick to this capex plan if incremental business arises from the likes of OpenAI and Anthropic. Also, its competitors are unlikely to slow spending and could use Oracle’s spending moderation as the means to gain share.” The competitive dynamic creates a collective action problem: no single hyperscaler can slow down without ceding ground, yet the collective pace of spending is generating balance sheet stress across the sector.
Second-Order Vulnerabilities: Data Centre REITs and Chip Suppliers
The debt accumulation in hyperscaler balance sheets has second-order effects that are not captured in the headline AI capex numbers. Data centre real estate investment trusts — which provide the physical infrastructure that hyperscalers increasingly lease rather than own — have their own exposure to counterparty concentration and lease extension risk. Reports that Blue Owl, Oracle‘s primary data centre financing partner, declined to back the Michigan facility highlighted the fragility of the supporting ecosystem even when the primary tenant appears solvent.
Nvidia, whose chips underpin the entire AI buildout, has been insulated from these concerns by persistent demand that exceeds supply. But if even two or three hyperscalers simultaneously scaled back data centre spending in response to balance sheet pressures, the chip demand outlook would shift rapidly.
The Memory Shortage as Collateral Signal
CNBC reported in late June 2026 that “the memory shortage shaking Apple and Microsoft is an ‘existential crisis’ for smaller players” — a reminder that supply chain bottlenecks are not yet resolved, adding cost and execution risk to projects whose timelines are already being stretched. The combination of persistent demand exceeding supply, expensive debt financing, and uncertain monetisation schedules creates a financial engineering challenge that may prove harder to solve than the engineering challenges of building the data centres themselves.
The AI infrastructure cycle is not necessarily a bubble in the sense of zero underlying demand — the use cases are real and adoption is accelerating. But the debt structure being used to finance it, and the concentration of risk around a small number of foundational relationships, has introduced systemic vulnerabilities that markets are only beginning to price.
Discover more from The Economy
Subscribe to get the latest posts sent to your email.

IMF Global Growth Forecast 2026: War, Tariffs, and AI Uncertainty Shatter the Recovery

US-China Semiconductor War 2026: Bifurcation, Tungsten Shock, and the Race for AI Chips

Salt Is the New Oil: Critical Minerals, the 2026 Investment Playbook

AI Infrastructure Debt Bubble 2026: $570 Billion in Global Debt Issuance Raises Systemic Risk Alarm

Argentina Economy 2026: Milei’s Fiscal Surplus, Inflation Drop to 29%, and What Comes Next

Global Economic Growth 2026: World Bank Cuts Forecast to 2.5%

Gold Price 2026: J.P. Morgan Forecasts $6,000/oz as Inflation, Iran War

US Section 301 Tariffs 2026: 60 Countries Face 12.5% Duties on Forced Labour Goods

China Economy 2026: 87% Semiconductor Surge, Property Crisis

Kevin Warsh Fed 2026: Rate Hold, Hawkish Dot Plot, and the End of Forward Guidance

SpaceX IPO 2026: $2 Trillion Valuation, Retail Frenzy, and the Risks

Oracle AI Debt Crisis 2026: $130 Billion Gamble Triggers Worst Stock Crash Since Dot-Com Bust

Male Labor Force Participation Rate 2026: Why Men Are Leaving & Economic Impact

Trump Tariffs 2026: Economic Impact, Household Costs & Trade War Outlook

PwC China Partner Payouts Cut Amid Evergrande Audit Fraud

Broadcom Market Value Loss: Revenue Forecast Disappoints

Investors Pile Into Bullish Dollar Bets as ‘US Exceptionalism’ Trade Returns

Here’s How Much It’ll Cost You to Be Part of SpaceX’s Record-Breaking $75 Billion IPO

Nasdaq Tumbles 4% as Chip and Memory Stocks Sink: A $1.2 Trillion Wipeout

How to Fix Pakistan’s Debt Economy: A Structural Blueprint

Smash Capital Leads $200M Funding for Allen Control Systems

Democrats Draw a Red Line Around Military AI — And the Pentagon Is Already Pushing Back

New Investment Super-Cycle: AI, Green Energy & Re-Shoring

Grinding the Already Ground: Pakistan’s Inflation Crisis

Xponential Fitness Franchise Lawsuit: The $3.97M Judgment

Middle East Conflict Oil Prices: The $4 Surge Explained

The End of the Chatbot: Why OpenAI is Tearing Up Its Most Successful Product

Musk’s SpaceX Lines Up Retail Investors for Record IPO Allocation
-

 Markets & Finance6 months ago
Top 15 Stocks for Investment in 2026 in PSX: Your Complete Guide to Pakistan’s Best Investment Opportunities
-

 Analysis4 months ago
Top 10 Stocks for Investment in PSX for Quick Returns in 2026
-

 Analysis5 months ago
Brazil’s Rare Earth Race: US, EU, and China Compete for Critical Minerals as Tensions Rise
-

 Analysis4 months ago
Johor’s Investment Boom: The Hidden Costs Behind Malaysia’s Most Ambitious Economic Surge
-

 Banks5 months ago
Best Investments in Pakistan 2026: Top 10 Low-Price Shares and Long-Term Picks for the PSX
-

 Investment6 months ago
Top 10 Mutual Fund Managers in Pakistan for Investment in 2026: A Comprehensive Guide for Optimal Returns
-

 Global Economy6 months ago
15 Most Lucrative Sectors for Investment in Pakistan: A 2025 Data-Driven Analysis
-

 Global Economy6 months ago
Pakistan’s Export Goldmine: 10 Game-Changing Markets Where Pakistani Businesses Are Winning Big in 2025