
Analysis
Indonesia Eyes Russian Crude as Hormuz Crisis Deepens Import Gap and Subsidy Strain

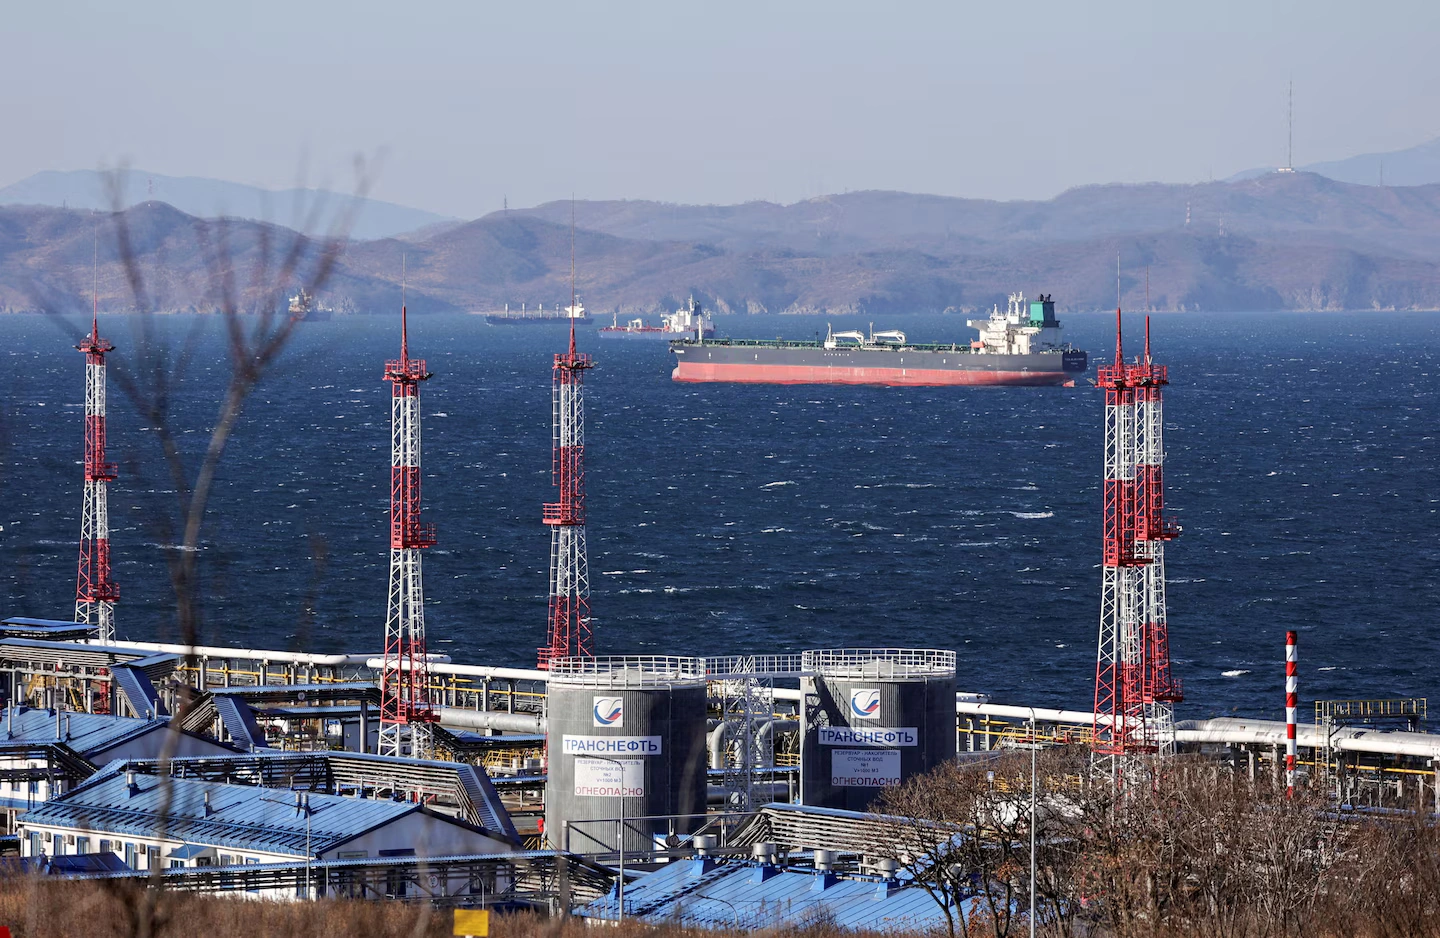
Jakarta’s pivot to discounted Russian barrels is shrewd realpolitik. But it walks a razor-thin tightrope between Washington and Moscow — and lays bare the fragility of Asia’s entire oil architecture.
On the morning of April 13, 2026, President Prabowo Subianto arrived at the Kremlin carrying something most world leaders have long stopped bringing to Moscow: genuine leverage. With the Strait of Hormuz still convulsing under the weight of Iranian drone strikes and the global oil benchmark hovering above $100 a barrel for the first time in four years, Indonesia’s head of state sat across from Vladimir Putin not as a supplicant but as a customer — and Russia, desperate for new buyers in an era of tightening Western sanctions, was very much open for business.
The meeting lasted several hours. By the time the readouts emerged, the outlines of a deal were visible to anyone watching: long-term crude oil and LPG supply arrangements, cooperation on refinery development, and an explicit Russian offer to “increase supplies of oil and LNG to the Indonesian market.” Within 48 hours, Pertamina’s corporate secretary confirmed publicly that the company’s refineries were fully capable of processing Russian crude. Jakarta’s strategic pivot was no longer subtext. It was policy.
What followed was a global shrug from the Western press and a quiet tremor in the energy security community. Indonesia, after all, is not India. It is not China. It is a G20 democracy with a functioning multiparty system, a long-standing tradition of non-alignment, and a freshly signed defence cooperation agreement with the United States — on the very same day as the Moscow summit. The dual manoeuvre was audacious, and characteristically Prabowo: plant one foot in each camp, and dare anyone to push you over.
A Thousand Barrel Problem, Per Minute
To understand why Jakarta is willing to absorb the diplomatic friction of a Russian crude deal, one has to understand the arithmetic of Indonesia’s energy predicament. It is severe, and it has been structural for over two decades.
Indonesia currently consumes approximately 1.6 million barrels of oil per day against a domestic production base that — declining steadily since the late 1990s — has contracted to roughly 572,000 barrels per day as of December 2025. The arithmetic is unforgiving: a million-barrel-per-day import dependency, in an era of weaponised chokepoints. For a country of 280 million people sprawled across 17,000 islands, this is not merely a balance-of-payments challenge. It is a civilisational vulnerability.
Indonesia Energy Gap — At A Glance (2026)
| Indicator | Figure | Source |
|---|---|---|
| Domestic crude production | ~572,000 bpd | Trading Economics / SKK Migas |
| Total oil consumption | ~1,600,000 bpd | Indonesia Investments / IEA |
| Net import gap | ~1,028,000 bpd | Derived |
| Share of fuel needs imported | ~60% | Arab News / Antara |
| Share previously sourced from Middle East | ~20–25% | Jakarta Post / Arab News |
| 2026 energy subsidy budget (Pertamina + PLN) | IDR 381.3 trn (~$22.5B) | Indonesian Ministry of Finance / Invezz |
| Additional fiscal exposure per $1 oil rise | ~$400M widened deficit | Indonesia Business Post |
| Urals discount to Brent (March 2026 avg.) | ~$6.4/bbl | CREA Monthly Tracker, April 2026 |
Sources: Indonesia Investments, Trading Economics, Arab News, Jakarta Post, Indonesian Ministry of Finance, Centre for Research on Energy and Clean Air (CREA). All figures April 2026.
Until February 2026, roughly 20 to 25 percent of Indonesia’s imported oil arrived through or from the Persian Gulf — a figure that had been declining as Jakarta diversified toward West African and North American crudes. Then the United States and Israel launched strikes on Iran, and everything changed at once.
Iran’s Revolutionary Guards declared the Strait of Hormuz effectively closed on March 4, 2026, following weeks of escalating attacks on commercial shipping. Tanker traffic through the world’s most consequential 33-kilometre waterway — through which some 25 percent of seaborne crude and 20 percent of global LNG normally transit — collapsed by more than 90 percent. The International Energy Agency’s Fatih Birol called it “the largest supply disruption in the history of the global oil market.” That is not a metaphor. It is a measurement.
For Indonesia, this was not an abstract geopolitical event. Two Pertamina tankers were immediately trapped in the Persian Gulf. Purchases from the Middle East — previously around a quarter of Indonesia’s crude import mix — were abruptly disrupted. Brent crude surpassed $100 per barrel on March 8 for the first time since 2022, and continued climbing. Against government budget assumptions of $70 per barrel, every dollar of incremental price increase widens Indonesia’s fiscal deficit by approximately $400 million. The government had already budgeted IDR 381.3 trillion — roughly $22.5 billion — for energy subsidies and compensation payments to Pertamina and PLN. That figure, built on a fragile $70 assumption, now looked dangerously inadequate.
“With the Middle East’s energy resources bottled up by the closure of the Strait of Hormuz, Indonesia is desperate to secure alternative supplies of crude oil — and Russia has plenty for sale.”
— Ian Storey, Principal Fellow, ISEAS-Yusof Ishak Institute, Singapore; quoted in the South China Morning Post, April 14, 2026
The Discount That Matters
Russia’s strategic offer arrives at a moment of unusual pricing opportunity. Urals crude averaged roughly $6.40 per barrel below Brent in March 2026, according to data from the Centre for Research on Energy and Clean Air — a discount that, while narrower than the $12.60 recorded in February and the vertiginous $30-plus discounts of early 2023, still represents material savings across a purchase programme of any scale. For a country importing upwards of a million barrels per day, even a $5-per-barrel discount translates to $1.8 billion annually. At $6 to $8, the savings approach $2.5 billion — fiscally meaningful in a year when Jakarta is already projecting a deficit approaching 2.9 percent of GDP.
There is also the question of ESPO Blend — Russia’s Pacific-facing export grade, loaded at Kozmino port and far better suited to Indonesian refineries given its lighter, sweeter profile relative to the sulphurous Urals. The transit route from Vladivostok to Indonesia’s refinery hubs at Balikpapan and Cilacap is comparatively direct, bypassing the Persian Gulf altogether. This is not a minor logistical footnote; it is the geological and geographic rationale that makes the entire proposition compelling. Russia’s east-of-Suez export infrastructure already serves China and South Korea. Indonesia is simply the next logical customer on the arc.
The precedent, moreover, is no longer theoretical. Ship-tracking data from Kpler and Vortexa indicated that two cargoes of Russian Sakhalin Blend crude — each approximately 700,000 barrels — were discharged at Balikpapan and Cilacap in December 2025 and January 2026, even as Pertamina publicly denied the imports. That corporate ambiguity has now dissolved: on April 15, a day after Prabowo’s return from Moscow, Pertamina’s corporate secretary stated plainly that “Pertamina’s refinery unit is capable of processing it into refined products” and that the company would “certainly support” any government directive to proceed.
The Subsidy Trap — and the Russian Exit Ramp
The most underappreciated dimension of this story is not geopolitical. It is fiscal. Indonesia’s fuel subsidy architecture is a system that was designed for a different era — one of cheap Gulf crude and stable rupiah — and it now functions as a fiscal trap that tightens with every dollar of oil price inflation.
In 2024, Indonesia spent $5.1 billion on its 3-kg LPG subsidy alone, $1.1 billion on transport fuel subsidies, and $7.3 billion in direct compensation payments to Pertamina and PLN — totalling over $13.5 billion in quantified oil and gas support. The 2026 budget earmarked even more: $22.5 billion, on the basis of $70 oil. Officials have now confirmed that subsidised fuel prices — Pertalite and Bio Solar — will remain frozen through end-2026, with the government absorbing the widening gap between international prices and domestic pump prices. As Coordinating Minister Airlangga Hartarto acknowledged in early April, this floor only holds “as long as oil prices do not exceed 97 on average.” With Brent well above that threshold, the government is already in territory where Pertamina is absorbing losses the state budget was not designed to cover.
Russian crude — cheaper at source and arriving through a sanctions-adjacent but not unnavigable commercial channel — offers a partial but genuine path toward narrowing that gap. Not a solution to the subsidy trap; but oxygen while Jakarta decides whether it has the political will to reform one of Southeast Asia’s most politically radioactive domestic programmes.
Three Scenarios: Russia’s Fiscal Impact on Indonesia
① Modest diversification (100–150k bpd Russian crude)
Annual saving of ~$220–$350M at a $6/bbl discount vs Brent alternatives. Buys political time. Limited sanctions exposure. Commercially viable via non-Western tankers.
② Substantial substitution (300–400k bpd)
Annual saving of ~$650M–$875M. Covers roughly 3–4% of the total energy subsidy bill. Meaningful fiscal relief. Raises EU/US diplomatic friction. Refinery upgrading required for Urals.
③ Strategic partnership (long-term G2G contract)
Includes Russian upstream investment in ageing Indonesian oil blocks, LPG supply, potential joint refinery development. Locks in supply certainty but deepens diplomatic exposure. Most significant fiscal and energy security upside; highest geopolitical cost.
The Tightrope Act — Washington, Sanctions, and the Non-Aligned Wager
No competent analysis of Indonesia’s Russian crude play can ignore the sanctions landscape. The G7 price cap on Russian oil — reduced to $44.10 per barrel effective February 2026 — ostensibly limits Western financial and maritime services to cargoes traded at or below that ceiling. In practice, roughly 48 percent of Russia’s seaborne crude is now transported by “shadow” tankers operating outside Western insurance and flagging systems, rendering the cap a leaky instrument at best. The EU briefly considered imposing sanctions on Indonesia’s Karimun transshipment hub in February 2026 after tracking data revealed Russian Sakhalin Blend being discharged at Pertamina ports. That threat has, for now, receded — partly because Jakarta simultaneously deepened its security ties with Washington.
The audacity of Prabowo’s April 13 positioning — signing a US defence cooperation agreement on the same calendar day as the Kremlin meeting — is not accidental naivety. It is doctrine. Since his election in 2024, Prabowo has pursued a foreign policy that Indonesia’s foreign ministry describes as “bebas aktif” — free and active. In practice: join BRICS, engage Trump’s Board of Peace, volunteer peacekeepers for Gaza, sign a defence pact with Australia, and buy oil from Russia. Indonesian Cabinet Secretary Teddy Indra Wijaya described the Moscow discussions as covering “long-term cooperation” in the oil and gas industries — language calibrated to signal seriousness without triggering immediate Western alarm.
For Jakarta’s economic planners, the calculus is clear-eyed: as Nailul Huda of the Centre of Economic and Law Studies in Jakarta put it, “these energy negotiations must cleverly avoid being controlled by US interests.” Indonesia needs bargaining chips to resist pricing pressure from any single supplier — including the United States, which would dearly love to sell LNG to Southeast Asia’s largest economy. Russian crude is less a geopolitical statement than a commercial hedge.
The Refinery Question — and the Infrastructure Clock
One structural constraint complicates the narrative of seamless diversification: Pertamina’s legacy refinery fleet. Indonesia’s major processing facilities — particularly the Cilacap complex and the Balikpapan refinery currently being expanded under the RDMP programme — were designed primarily for sweet, light domestic crude and Middle Eastern medium grades. Russian Urals is a medium-sour crude; ESPO is lighter and sweeter and considerably more compatible. Pertamina’s VP for Corporate Communication Muhammad Baron said the company would “examine crude specifications” and noted that ongoing refinery modernisation “is expected to give greater flexibility to process a wider range of crude types.”
This is not obfuscation. It is engineering reality. Crude substitution at scale requires desulphurisation upgrades, changes to coker configurations, and adjustments to hydrotreating units. The Balikpapan RDMP — which will bring that refinery’s capacity to 360,000 bpd — includes precisely such upgrades. But major capital works take years. In the near term, ESPO Blend is the practical option; full Urals compatibility is a medium-term proposition contingent on investment decisions being taken now. The stakes of delay are not trivial: Pertamina’s refinery chief confirmed as early as May 2025 that the company had “opened to imports from Russia since last May” — suggesting the technical groundwork, at least at the margins, is already underway.
Implications for Asia’s Oil Order
Zoom out, and what Indonesia is navigating in 2026 is a microcosm of a broader structural shift underway across the entire Indo-Pacific. The Strait of Hormuz crisis has crystallised something energy security analysts have argued for years: the architecture of Asian oil supply — built on Gulf crude, US-secured sea lanes, and Western-insured shipping — is not a given. It is a geopolitical construct, and constructs can fail.
India understood this first, pivoting aggressively to Russian crude after the 2022 Ukraine invasion. China had already built parallel supply chains. Now Indonesia, Thailand, Vietnam and even the Philippines are being forced into analogous calculations. The Philippines declared a national energy emergency; Thailand, Vietnam and Indonesia began encouraging remote work for civil servants to reduce fuel consumption. These are symptoms of a structural dependency that years of energy diversification policy quietly failed to address.
Russia, meanwhile, is the paradoxical beneficiary of a crisis its own earlier actions helped architect. Moscow is now earning an average of €510 million per day from oil and gas exports — roughly 14 percent higher than in February, even as G7 price caps nominally remain in force. The Hormuz closure has lifted Urals pricing just as Southeast Asian demand for alternative barrels surges. Putin, sitting in the Kremlin on April 13, needed no map to read the room: Indonesia was coming to him, not the other way around.
What emerges from this confluence is what might be called the new “non-aligned oil order” — a loose architecture in which price-sensitive developing-world importers, unconstrained by NATO obligations or EU membership, pragmatically route crude purchases toward whatever source is cheapest, most available, and least encumbered by chokepoint risk. India, China, Turkey, Indonesia: these are not ideological allies of Moscow. They are sovereign buyers making sovereign calculations. The G7’s price cap was supposed to close off this space. It hasn’t.
The Verdict: Smart Hedge, Structural Risk
Indonesia’s Russian crude pivot deserves neither the breathless alarm some Western commentators have attached to it nor the dismissal of those who treat it as purely transactional. It is both of those things at once — and something more: a window into the accelerating disintegration of the post-Cold War energy order that once gave Western-aligned institutions decisive leverage over the global oil market.
For Prabowo, the immediate arithmetic is compelling. Russian crude offers price relief, supply certainty, and a credible alternative to Middle Eastern dependence in a period when the Strait of Hormuz is a war zone. It gives Jakarta leverage in negotiations with American LNG sellers, Gulf producers, and West African exporters alike. It buys time — perhaps two to three years — for Indonesia to make the harder structural choices: subsidy reform, refinery upgrades, domestic upstream revival, and an energy transition that the government acknowledges it needs but has repeatedly postponed.
The risks are real and should not be minimised. Secondary sanctions exposure remains non-trivial; the EU’s willingness to sanction the Karimun hub signals that the line between tolerance and enforcement is thin and politically contingent. A Trump administration navigating a hot war with Iran is not a predictable partner, and Indonesia’s defence cooperation agreement is only as durable as the next presidential mood swing in Washington. Logistics and refinery compatibility, while manageable, are not trivial.
But the deeper risk is the one no one in Jakarta’s cabinet rooms is comfortable articulating publicly: that the Russian crude option, like so many emergency energy policies before it, becomes permanent. That what begins as pragmatic hedging calcifies into structural dependency — this time not on the Gulf, but on the Kremlin. Indonesia has navigated those shoals before. Whether it can do so again, in a world more fractured and less predictable than the one it inherited, is the question that will define its energy future long after the Strait of Hormuz reopens.
Discover more from The Economy
Subscribe to get the latest posts sent to your email.


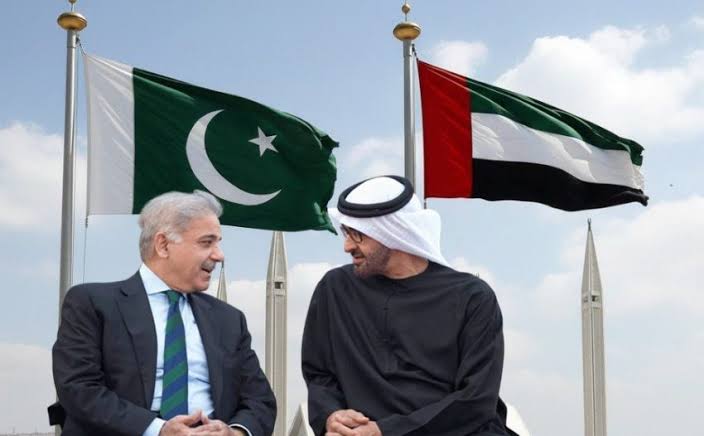
What happened: In early 2026, the United Arab Emirates declined to roll over a $3 billion loan to Pakistan — the first such refusal in seven years. The repayment equalled roughly 18% of Pakistan’s foreign currency reserves, arriving as Islamabad also faced a $1.3 billion bond payment and was waiting on the next IMF tranche.
Why it matters: It’s the clearest sign yet that Gulf sovereign patience with Pakistan’s balance-of-payments cycle is thinning, even as Gulf states simultaneously court China, Saudi Arabia, and each other for capital in a tightening regional liquidity environment.
The Story Nobody’s Connecting
Most coverage of Pakistan’s 2026 external account stress treats the UAE’s loan decision as an isolated liquidity event — a “routine financial transaction,” in the words of Pakistan’s own Ministry of Foreign Affairs. That framing misses the bigger pattern. The same weeks that Abu Dhabi called in its $3 billion, unusual delays began appearing in bank transfers from Saudi Arabia to the UAE itself — friction between the Gulf’s two largest economies, at a moment when both are also managing their own post-war oil price adjustment. (Pakistan & Gulf Economist)
Put those two data points together and a different story emerges: this isn’t just about Pakistan’s creditworthiness. It’s about Gulf capital becoming more selective, more transactional, and less willing to extend informal grace periods across the board — with Pakistan simply the most exposed borrower in the queue.
The Numbers Behind the Pressure
Pakistan’s State Bank held $16.4 billion in reserves as of late March 2026 — enough to cover roughly three months of imports, a threshold economists generally treat as a comfort floor, not a cushion. (Mettis Global News) The UAE’s declined rollover landed at the same time as a looming $1.3 billion international bond payment and dependence on the next $1.2 billion IMF disbursement — a convergence of obligations that left the State Bank with limited room to maneuver beyond import restrictions, rate hikes, or fresh commercial borrowing.
The backdrop matters too. The rupee had been trading in a comparatively narrow 278–282 band before the escalation of the Iran conflict pushed global oil prices higher, squeezing Pakistan’s import bill precisely when its Gulf safety net began to wobble. The KSE-100 benchmark, meanwhile, had already shed around 15% amid the broader pressure. (Mettis Global News)
This is not Pakistan’s first Gulf-dependency cycle. The IMF’s own record shows a now-familiar pattern: staff-level agreements reached in Dubai, UAE pledges of multibillion-dollar investment arriving alongside IMF tranches, and Gulf bridge financing used to stave off sovereign default in periods when reserves cover shrinks toward zero. (Business Standard) What’s different in 2026 is that the bridge itself is showing cracks.
Islamabad’s Official Line vs. the Structural Reality
Pakistan’s government has leaned into a “stability to sustainable growth” narrative around its FY2026–27 federal budget, with the finance minister framing the transition as export-driven rather than reserve-dependent. Business groups have broadly welcomed the budget, and the current account posted a $459 million surplus in May 2026, an improvement attributed to strong remittance inflows. (Business Recorder) The Monetary Policy Committee has held rates steady rather than reaching for emergency tightening, which is itself a signal that the central bank does not yet see the UAE episode as a systemic trigger.
But a current account surplus built substantially on remittances is different from one built on export competitiveness or durable FDI. Pakistan’s trade structure still leans heavily on a narrow set of partners: China supplies over a quarter of its imports and a meaningful share of its exports, the UAE is both a top export destination and its second-largest import source, and Gulf states collectively remain the primary channel for both remittances and emergency liquidity. (Wikipedia — Economy of Pakistan) That concentration is precisely what makes a single Gulf lender’s changed appetite so consequential.
Why the Oil Backdrop Compounds the Risk
None of this is happening in a vacuum. The IMF’s own July 2026 commentary noted that global oil markets “absorbed the war shock” from the Iran conflict, but cautioned that buffers — spare production capacity, strategic reserves, shipping insurance capacity — are running low. (IMF Blog) For an oil-importing, reserve-constrained economy like Pakistan, a second energy price shock without deeper buffers would land directly on the same reserves the UAE loan was meant to protect.
What to Watch Next
- Whether Saudi Arabia steps in as an alternative bridge lender, or whether the Riyadh–Abu Dhabi transfer friction signals a broader Gulf liquidity tightening that limits everyone’s appetite to backstop Pakistan.
- The pace and size of the next IMF tranche, and whether Fund conditionality shifts to demand deeper reserve buffers given the UAE precedent.
- Whether China increases its role as lender of last resort, deepening Pakistan’s dependency in exactly the direction Gulf financing was historically meant to offset.
Discover more from The Economy
Subscribe to get the latest posts sent to your email.
Introduction
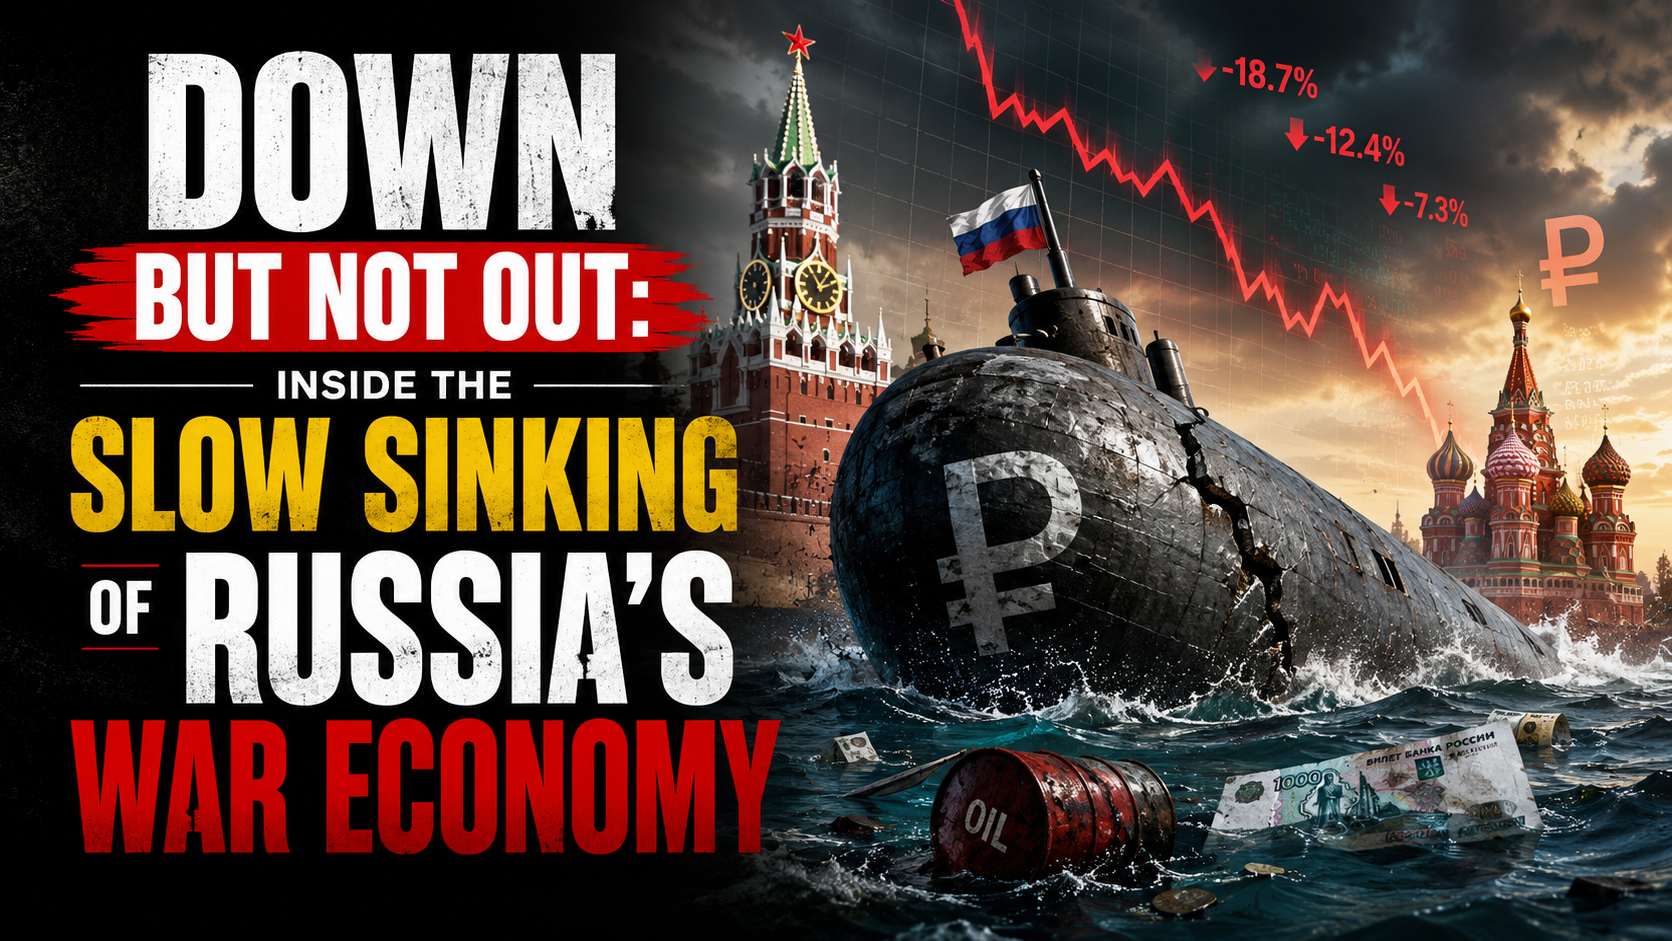
The European Council formally extended its economic sanctions against Russia for another full year on 25 June 2026, keeping restrictive measures in place until 31 July 2027 (Council of the EU). More than four years into the war, the headline story of Russia’s economy has shifted from whether sanctions would work to a more nuanced question: how much longer can the Kremlin keep financing the war before the accumulated strain becomes impossible to hide behind favorable official statistics.
The Sanctions Architecture, Renewed Again
The EU’s economic measures against Russia, first introduced in 2014 and dramatically expanded after the February 2022 full-scale invasion, now span trade, finance, energy and dual-use technology restrictions, alongside asset freezes and travel bans on a broad range of individuals and entities (Council of the EU). Since February 2022, the EU has adopted 20 separate sanctions packages, and the European Council has explicitly stated it remains determined to keep weakening Russia’s war economy by further reducing its energy revenues, curbing shadow-fleet oil shipping operations and constraining its banking system (Council of the EU). Separately, on 3 July 2026 the EU sanctioned six individuals connected to the poisoning and death of opposition figure Alexei Navalny, underscoring that the sanctions regime continues to expand on human-rights grounds as well as economic ones (Council of the EU Sanctions Timeline).
The Headline Numbers Beijing-Style Optimism Can No Longer Explain Away
Russia’s GDP is now put at roughly $2.51 trillion, the world’s eleventh-largest economy — comparable in size to South Korea despite Russia’s vastly larger landmass and resource base — with 2026 growth projected at just 1.0% and inflation running at 5.2% (Statistics of the World). More pessimistic estimates put full-year 2026 growth even lower, at around 0.4%, which would be worse than 2025’s already-weak 1% expansion and would mark a sharp deceleration from the 4.1% growth Russia posted in 2023 as it forged new trading relationships to route around initial sanctions (Forbes).
Oil and gas revenues — historically around half of Russia’s state income — have fallen to roughly a quarter, a deliberate outcome of Western sanctions strategy that targets how much Russia earns from exports rather than blocking those exports outright (Stockholm School of Economics/SITE). Russia’s oil and gas budget revenues reportedly halved in January 2026 alone, with crude prices falling below $73 a barrel before the Middle East conflict briefly reversed the trend, sending Brent surging more than 55% to near $120 a barrel at its peak (Forbes).
The Middle East War: A Temporary Lifeline With Long-Term Costs
The spike in oil prices tied to the Iran conflict, combined with a period of eased US sanctions enforcement on Russian oil under President Trump, offered Moscow unexpected fiscal breathing room in mid-2026 (Forbes). But that same conflict has undermined Russia’s longer-term energy diversification ambitions in the region: two Russian-backed power plant projects in Iran have been put on hold, along with oil and gas exploration work and plans to build new transit routes linking Russia to India via Iran (Forbes).
The Gap Between Official Statistics and Underlying Reality
Perhaps the most important analytical point from recent research is not about any single data point but about the reliability of Russian statistics themselves. Torbjörn Becker of the Stockholm Institute of Transition Economics has argued the real test of sanctions is not whether they end the war overnight, but how much they erode the Kremlin’s capacity to finance it — and by that measure, the evidence points to deeper strain than headline GDP figures suggest (Stockholm School of Economics/SITE). Becker notes that Russia’s economy grew only modestly in 2022 despite oil prices rising sharply that year — a gap between expected and actual performance that implies a considerably larger hidden economic hit than the official contraction figures showed (Stockholm School of Economics/SITE). Compounding the problem, Russian authorities have stopped publishing several key statistics since 2022, making independent assessment of inflation, consumption and real economic conditions increasingly difficult — leading Becker to conclude that “statistics have become part of the narrative” rather than a neutral measure of economic reality (Stockholm School of Economics/SITE).
The Military-Civilian Economic Split
A recurring theme across recent analysis is the growing bifurcation between Russia’s overheating military-industrial sector and a stagnating civilian economy. This imbalance has pushed interest rates higher and forced the liquidation of a striking 71% of Russia’s gold reserves to help fund continued war spending (Forbes). Russia’s total fossil fuel export revenue is estimated at roughly €734 million per day, underscoring just how central hydrocarbon income remains to the entire war financing model even as that revenue stream shrinks (Forbes).
The Counter-Narrative: Wages Still Rising
It would be inaccurate to describe Russia’s economy as in freefall. CSIS research notes that Russian salaries rose 17.8% in nominal terms and 8.7% in real terms in 2024 compared to 2023, with disposable incomes up 6.1% in 2023 and 7.3% in 2024 — growth rates not seen in Russia in almost two decades (CSIS). Government budget projections still expect real salaries to rise, albeit at a decelerating pace: 7% in 2025, 5.7% in 2026 and 4.1% in 2027 — a marked slowdown from the 2024 peak but still roughly double the pre-invasion decade average (CSIS). This wage growth, driven substantially by wartime labor shortages and military-adjacent spending, is precisely the kind of headline-stabilizing data point that has allowed Putin to argue publicly that sanctions have failed to cripple his economy (Fortune) — even as think tanks describe the broader trajectory as pushing Russia toward what one report calls an “economic, political, and military abyss” (Fortune).
What Comes Next
Renewed legislative pressure in Washington — including the Sanctioning Russia Act introduced with strong bipartisan support — signals appetite in the US for tightening the screws further, even as the loss of a key congressional champion for that effort has complicated the political path forward (TIME). Whether the EU’s renewed sanctions regime, continued oil price pressure, and constrained reserves ultimately force a shift in Kremlin calculus toward negotiation remains the central open question for 2027.
Key Takeaways
- The EU has extended Russia sanctions for a further year, through 31 July 2027, continuing a regime built from 20 separate packages since 2022.
- Russia’s 2026 GDP growth is forecast between 0.4% and 1.0%, a sharp deceleration from 2023’s 4.1% post-shock rebound.
- Oil and gas revenue’s share of Russian state income has fallen from roughly half to about a quarter as Western sanctions target export earnings specifically.
- Russia has liquidated a large share of its gold reserves to sustain war financing amid a widening split between an overheating military sector and a stagnating civilian economy.
- Official Russian statistics likely understate the true economic strain, according to independent economists who cite a widening gap between reported and expected performance.
Sources: Council of the EU, Council of the EU Sanctions Timeline, Stockholm School of Economics/SITE, Forbes, Statistics of the World, CSIS, Fortune, TIME
Discover more from The Economy
Subscribe to get the latest posts sent to your email.
Analysis
Dubai’s Millionaire Magnet: How the UAE Turned Middle East Turmoil Into a Capital Safe-Haven Boom

Introduction
While much of the commentary on the 2026 Middle East conflict has focused on oil tankers and the Strait of Hormuz, a quieter and arguably more consequential story has been unfolding in Dubai and Abu Dhabi: capital is flowing in, not out. The UAE attracted roughly 9,800 net new millionaires in 2025 — the highest net millionaire inflow of any country globally, according to Henley & Partners — and 2026 data suggests the pattern is holding even as regional tensions have periodically spiked (Tap Fiscal). For a global content audience trying to understand why a country geographically adjacent to an active conflict zone is functioning as a safe haven rather than a risk zone, the answer lies in three decades of deliberate institutional design.
The Headline Numbers
Dubai’s economy grew 2.4% in the first quarter of 2026 alone, with GDP reaching AED 232 billion, according to figures reported via the official WAM news agency (Gateway Group UAE Weekly Business News). The UAE Central Bank’s own outlook projects national economic growth of 5.6% for 2026, outpacing the broader GCC average, with the hydrocarbon sector expected to grow 7.3% on higher oil production even as non-oil sectors — financial services, manufacturing, trade, tourism and transport — continue to carry the bulk of long-term momentum (Xinhua). Non-oil activity now accounts for roughly 75% of GDP, a diversification level that insulates the economy from oil-price shocks far more than headlines about the region typically convey (Tap Fiscal).
Why S&P and the Central Bank Both Say the UAE Can Absorb the Shock
A dedicated S&P Global Ratings assessment concluded the UAE’s banking sector has shown strong resilience and financial soundness through the recent period of regional volatility, and the agency expects solid loan growth to continue into 2027, supported by ample system liquidity amid expected monetary easing (Gulf News). S&P separately reaffirmed the UAE’s sovereign credit rating at AA/A-1+ with a stable outlook, citing strong fiscal buffers and one of the world’s largest sovereign wealth portfolios (Xinhua).
The scale of that buffer is difficult to overstate. S&P estimates the UAE’s consolidated net asset position will reach roughly 184% of GDP in 2026, with government liquid assets calculated at approximately 210% of GDP (Gulf News). That firepower sits across a small number of globally diversified institutions — the Abu Dhabi Investment Authority, Mubadala Investment Company, ADQ, the Investment Corporation of Dubai, and the Emirates Investment Authority — which generate income well beyond the oil sector and give the state fiscal flexibility that few conflict-adjacent economies possess (Gulf News).
The UAE Central Bank’s own Q1 2026 review points to the same conclusion from the market side: the Dubai Financial Market’s share price index rose 22.9% year-on-year in the fourth quarter of 2025, the Abu Dhabi Securities Market General Index gained 6.6%, and credit default swap spreads for both Abu Dhabi and Dubai narrowed further — a signal of sustained investor confidence rather than flight (Central Bank of the UAE Quarterly Economic Review).
The Short-Term Noise Was Real — But It Didn’t Stick
None of this means the conflict has been costless. In the early days of escalation, some expatriates left the UAE, private jet charter prices to exit Dubai briefly spiked to as much as $250,000, and hotel occupancy dipped alongside disrupted aviation routes (Tap Fiscal). But the institutional and long-term investor data tell a different story than the panic-driven headlines: the Dubai International Financial Centre has resumed normal operations and remains home to nearly 9,000 active firms spanning wealth management, banking and capital markets (Tap Fiscal). A UAE government minister framed the resilience explicitly, describing the economy as structurally sound and built over decades to adapt to crisis rather than be destabilized by it (Tap Fiscal).
What’s Driving the Millionaire Inflow Specifically
High-net-worth migration to the UAE is not a new phenomenon, but 2025’s record net inflow suggests the safe-haven thesis is strengthening rather than fading. The pattern is consistent with what analysts describe as a flight to stable, low-tax jurisdictions with strong rule of law during periods of global uncertainty (Tap Fiscal) — a category the UAE has spent two decades positioning itself to fit, through free zones, golden visa programs, and a deliberately diversified, sovereign-wealth-anchored economy that does not rise or fall with a single sector or a single regional headline.
Risks Worth Watching
- Banking system exposure to regional escalation: while S&P’s baseline case is resilience, further escalation involving direct disruption to Gulf shipping lanes or energy infrastructure would test the “limited and short-term” impact assumption analysts currently hold (Xinhua).
- Real estate cooling: separate reporting on new vehicle and property registrations suggests parts of the UAE’s consumer economy are cooling from exceptional prior-year growth rates, even if not contracting (Arabian Business).
- Global AI valuation correction spillover: as with other major financial centers, UAE sovereign funds carry meaningful exposure to global equity markets, including AI-related names that regulators elsewhere have flagged as a concentration risk.
Key Takeaways
- The UAE recorded the world’s highest net millionaire inflow in 2025 and Dubai’s economy grew 2.4% in Q1 2026 despite regional conflict.
- Sovereign wealth institutions (ADIA, Mubadala, ADQ, ICD) give the UAE a net asset position near 184% of GDP, its core buffer against geopolitical shocks.
- S&P has reaffirmed a stable AA/A-1+ sovereign rating, citing fiscal buffers and banking sector resilience.
- Early-conflict disruption (jet charter spikes, occupancy dips) proved short-lived; DIFC activity and equity indices have both strengthened.
- Non-oil GDP diversification, now at roughly 75%, is the structural reason the UAE decouples from pure oil-price and conflict-headline risk.
Sources: S&P/Gulf News UAE Resilience Analysis, Xinhua/UAE Central Bank, Tap Fiscal UAE Economic Outlook 2026, Central Bank of the UAE Quarterly Economic Review, March 2026, Gateway Group UAE Weekly Business News, Arabian Business
Discover more from The Economy
Subscribe to get the latest posts sent to your email.

Gulf Capital Retreat From Pakistan 2026: UAE Loan Freeze & What It Means

Pakistan’s Most Reliable Export Is Its People: Remittances Hit $41.6 Billion, Overtaking Total Exports

Indonesia’s Confidence Problem: Record Investment, a Sinking Rupiah, and a Widening Credibility Gap

Down But Not Out: Inside the Slow Sinking of Russia’s War Economy

China’s Growth Slips to a Four-Year Low: Why Beijing Still Won’t Pull the Stimulus Trigger

The Johor-Singapore Corridor: How Malaysia Became Southeast Asia’s AI Infrastructure Powerhouse

Canada’s Economy ‘On Pause’: Inside the CUSMA Deadline That Passed Without a Deal

Dubai’s Millionaire Magnet: How the UAE Turned Middle East Turmoil Into a Capital Safe-Haven Boom

Britain’s Sixth Prime Minister in a Decade: What Starmer’s Exit Means for Gilts, Sterling and Your Portfolio

Anthropic Offers Up to $600,000 Salary for Critical IPO Role as AI Giant Prepares for Wall Street Debut

EU Readies Crisis Team for Potential China Rare Earths Stand-Off as Supply Chain Risks Mount

Singapore Weighs Hedge Fund Tax Cuts to Counter Hong Kong’s Growing Financial Challenge

Facebook and Instagram Experience Global Outage

Inside the $1 Billion Tap-to-Pay Fraud Rings Targeting Banks and Retailers

Carry Trade Unwind 2026: How the Yen’s Snapback Triggered a Global Margin Call

AI Bubble Warning 2026: Why BIS, IMF and Bank of England Fear a Market Crash

BRICS De‑Dollarization Strategy Takes Shape with $15 Billion Local‑Currency Push

Male Labor Force Participation Rate 2026: Why Men Are Leaving & Economic Impact

Russia Bans Diesel Exports 2026: Global Fuel Market Impact Explained

The AI Super Bubble Is Ready to Burst

Strait of Hormuz Blockade 2026: Oil Prices Surge 9% as US-Iran Conflict Reignites

IMF Cuts Pakistan Growth Forecast, Raises Inflation to 8.4%

Private Credit Warning: Most BDCs Turn Unprofitable in 2026, Reuters Finds
Gulf Capital Retreat From Pakistan 2026: UAE Loan Freeze & What It Means

India Economic Rise 2026: How the Subcontinent Toppled Japan

Bitcoin $150k Milestone Achieved as US Sovereign Crypto Pivot Looms

Strait of Hormuz 2026: Why Markets Still Don’t Trust It’s Open

Chipmakers Just Lost 6.7% in Two Days: Inside the Great AI Trade Rotation
-

 Markets & Finance7 months ago
Top 15 Stocks for Investment in 2026 in PSX: Your Complete Guide to Pakistan’s Best Investment Opportunities
-

 Analysis5 months ago
Johor’s Investment Boom: The Hidden Costs Behind Malaysia’s Most Ambitious Economic Surge
-

 Analysis5 months ago
Top 10 Stocks for Investment in PSX for Quick Returns in 2026
-

 Analysis6 months ago
Brazil’s Rare Earth Race: US, EU, and China Compete for Critical Minerals as Tensions Rise
-

 Banks6 months ago
Best Investments in Pakistan 2026: Top 10 Low-Price Shares and Long-Term Picks for the PSX
-

 Investment7 months ago
Top 10 Mutual Fund Managers in Pakistan for Investment in 2026: A Comprehensive Guide for Optimal Returns
-

 Global Economy7 months ago
15 Most Lucrative Sectors for Investment in Pakistan: A 2025 Data-Driven Analysis
-

 Global Economy7 months ago
Pakistan’s Export Goldmine: 10 Game-Changing Markets Where Pakistani Businesses Are Winning Big in 2025