
Analysis
Oil Prices Fall on Iran Deal Hopes — But the Market Is Being Dangerously Naive

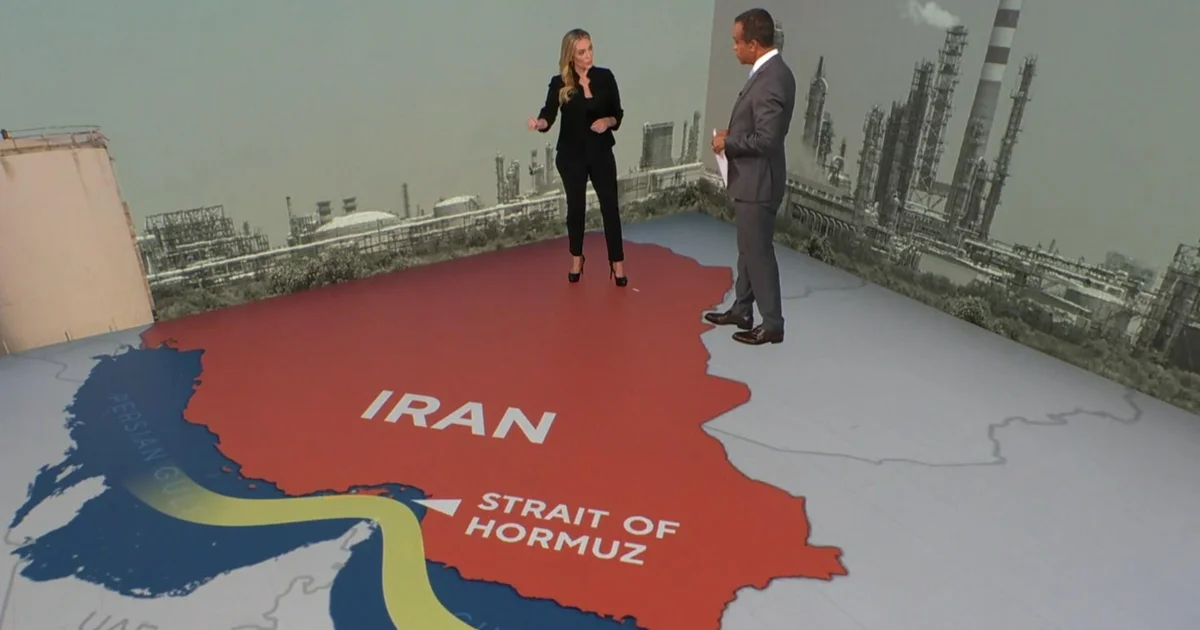
Brent crude slips to $94 as US-Iran deal hopes lift markets — but with Hormuz still choked and talks collapsing in Islamabad, energy markets may be pricing in a peace that doesn’t exist.
Brent crude futures dropped 44 cents on Thursday, settling near $94.49 a barrel, and traders exhaled. Hope, that most unreliable of commodities, had entered the room. Reports that Iran might permit commercial vessels to resume passage through the Strait of Hormuz — paired with whispers of a second round of US-Iran peace talks — were enough to cool prices that, barely a fortnight ago, had scorched their way to nearly $128 a barrel, a level not seen since the fever years of the 2000s supercycle.
It was, in the bluntest terms, the oil market doing what it always does during a geopolitical crisis: oscillating violently between catastrophism and wishful thinking, and getting both wrong. This time, the wishful thinking is arguably more dangerous than the panic.
The Diplomacy That Almost Was
To understand why Thursday’s price dip is less a relief rally and more a cognitive illusion, you need to trace the diplomatic wreckage of the past week.
On April 12, 2026, US Vice President J.D. Vance landed in Islamabad for what was billed — accurately — as the highest-level direct engagement between Washington and Tehran since the 1979 Islamic Revolution. Twenty-one hours of negotiations later, Vance walked to a microphone and delivered a verdict markets didn’t want to hear: no deal. “They have chosen not to accept our terms,” he said, boarding Air Force Two with the diplomatic equivalent of a shrug.
Iran’s Foreign Minister Abbas Araghchi offered a sharply different account. In a post on X after returning to Tehran, he said his country had engaged in good faith — only to face what he described as “maximalism, shifting goalposts, and blockade” from the American side, adding that the two delegations had been “inches away” from an agreement in Islamabad when talks broke down.
Both versions are, in their way, true. And that is precisely the problem.
The gap was stark and structural: the US proposed a 20-year suspension of Iranian uranium enrichment; Tehran countered with five years. American negotiators also reportedly demanded the dismantlement of Iran’s major nuclear enrichment facilities and the handover of more than 400 kilograms of highly enriched uranium — conditions Iranian officials have described as tantamount to unconditional surrender.
Against that backdrop, the market’s gentle optimism on Thursday — sparked by reports that Iran could allow some ships to pass — looks less like a rational repricing and more like a drowning man grabbing at driftwood.
Pakistan: The Indispensable Mediator
One actor deserving more analytical attention than it typically receives in Western energy commentary is Pakistan. Islamabad didn’t merely host the talks; it engineered them. Both President Trump and Iranian officials named Pakistani Prime Minister Shehbaz Sharif and Army Chief Field Marshal Asim Munir in their ceasefire announcements — a rare concurrence that, as one Islamabad-based analyst noted, no other country on earth could have achieved.
Pakistan emerged from the Islamabad breakdown with its mediator role intact, but officials acknowledge the harder phase now begins: getting American and Iranian negotiators back to the table before their differences ignite full-scale war again. Pakistan’s Deputy Prime Minister and Foreign Minister Ishaq Dar stated that Islamabad “has been and will continue to play its role to facilitate engagements and dialogue between the Islamic Republic of Iran and the United States of America in the days to come.”
Pakistan has now proposed hosting a second round of in-person talks. Whether that happens before the two-week ceasefire expires on April 21 — or whether the ceasefire itself is extended — remains the single most consequential variable for oil markets in the near term. Traders who failed to model Pakistan’s mediating role missed a crucial signal in the run-up to the Islamabad meeting. They would be wise not to repeat the error.
The Supply Shock Is Unlike Anything the Market Has Faced Before
Let us be precise about the scale of what is happening, because precision is the first casualty in a crisis.
According to the International Energy Agency’s April 2026 Oil Market Report, global oil supply plummeted by 10.1 million barrels per day in March — to 97 mb/d — as attacks on Middle East energy infrastructure and restrictions on tanker movements through the Strait of Hormuz produced what the IEA formally characterised as the largest disruption in the history of the global oil market. OPEC+ production fell 9.4 mb/d month-on-month, reaching 42.4 mb/d, while non-OPEC+ supply declined a further 770,000 barrels per day.
To put that in context: the Arab Oil Embargo of 1973 removed roughly 4 million barrels per day. This crisis has already removed more than twice that.
Before the war, the Strait of Hormuz carried around 20 million barrels per day. By early April, that figure had collapsed to approximately 3.8 mb/d — a drop of more than 80%. Alternative routes, including the west coast of Saudi Arabia and the Fujairah terminal in the UAE, as well as the Iraq-to-Turkey ITP pipeline, had increased to 7.2 mb/d from under 4 mb/d before the conflict — meaningful, but nowhere near sufficient to compensate.
The IEA’s emergency coordination has provided some relief. Member countries — including the United States, Japan, and Germany — agreed in March to release 400 million barrels from strategic reserves, the largest coordinated stock draw in the agency’s history. But the IEA itself has described this as a stop-gap, not a solution.
A Data Table Worth Studying
| Metric | Pre-Conflict (Feb 2026) | Crisis Peak (April 2026) |
|---|---|---|
| Brent Crude Spot Price | ~$70/bbl | ~$128/bbl (Apr 2) |
| Strait of Hormuz daily flows | ~20 mb/d | ~3.8 mb/d |
| Global supply disruption | — | 10.1 mb/d (March) |
| IEA strategic reserve release | — | 400 mb (record) |
| US crude inventory builds | — | +6.1 mb (8th straight week) |
| 2026 global demand forecast | +730 kb/d growth | -80 kb/d contraction |
| EIA Q2 Brent price forecast | — | $115/bbl |
Sources: IEA Oil Market Report (April 2026), EIA Short-Term Energy Outlook (April 2026), Trading Economics
The demand figure deserves particular attention. The IEA revised its 2026 global oil demand forecast from growth of 640,000 barrels per day to a contraction of 80,000 barrels per day — what would be the first annual decline in global oil consumption since COVID-19 in 2020. Supply destruction is now being met, grimly, by demand destruction.
Why the “Hope Rally” Is a Trap
Here is where I will depart from the consensus and say something that energy ministers in importing countries do not want to hear: the dip in Brent crude on Thursday is not a signal. It is a noise event being mistaken for a trend.
Three structural realities make the optimism premature:
1. The ceasefire expires in five days. The current two-week pause runs until April 21. Reports indicate that Washington and Tehran are mulling an extension to allow more time to negotiate, but the Strait of Hormuz remains effectively closed, with a US naval blockade on Iranian ports still in place. Iran has warned it could retaliate against an extended blockade by suspending shipments across the Persian Gulf, the Sea of Oman, and the Red Sea. A threat of that magnitude — if executed — would remove supply channels that global markets have been quietly relying upon.
2. The nuclear chasm is structural, not tactical. The gap between Iran’s offer (five-year enrichment suspension, retain the right to a civilian programme) and the US demand (full dismantlement, surrender of 400+ kilograms of HEU, 20-year freeze) is not bridgeable in a week. Al Jazeera’s correspondent in Tehran noted that the US is effectively asking Iran to give up its right to any nuclear programme, even for medical purposes — a demand that Iranian negotiators have consistently described as beyond what any Iranian government could accept domestically.
3. Physical oil markets and futures markets are dangerously disconnected. IEA Director Fatih Birol stated publicly that crude oil futures prices still do not reflect the severity of the crisis, warning that the divergence between futures and spot markets constitutes an alarming disconnect, with its severity intensifying. When the IEA chief tells you futures are mispriced, it is worth listening.
“Markets are trading headlines, not fundamentals,” says Tatsuki Hayashi, senior energy analyst at Fujitomi Securities in Tokyo. “Every hint of diplomacy shaves a dollar off Brent, but no diplomat has yet put a single barrel back into a tanker. The physical oil market and the paper market are living in parallel universes right now, and at some point they violently reconcile.”
That reconciliation is the risk event that no one in the Thursday rally is pricing.
The Cascading Consequences Beyond the Barrel
The focus on crude prices risks obscuring second and third-order effects that are, in many ways, more consequential for ordinary people than the oil price itself.
The disruption to the Strait of Hormuz has created acute food security concerns. Over 30 per cent of global urea — the fertiliser essential for corn and wheat production — is exported from Gulf countries through the strait. The British think tank The Food Policy Institute has warned of long-term increases in food prices due to disruption in fuel and fertiliser markets, with impacts felt not just in Gulf states, but globally.
The aviation sector is quietly in crisis. Reports in April 2026 indicated that jet fuel prices had more than doubled compared to the previous month, with European markets particularly exposed to potential fuel shortages within weeks if supply conditions do not stabilize. The International Air Transport Association noted that even in the event of a reopening of the Strait of Hormuz, recovery in jet fuel supply could take months due to persistent constraints in refining capacity and logistics.
And then there are the petrochemicals. The IEA’s April report noted that the blockade has led to a total disruption of the petrochemical supply chain to Asia, with more than 3 mb/d of refining capacity in the region already shut due to attacks and the absence of viable export outlets.
Cheap oil is not coming back with diplomacy alone. Infrastructure has been damaged. Tanker routes have been disrupted. Insurance premiums for vessels attempting to transit the region have reached levels not seen since the Iran-Iraq tanker war of the 1980s. The EIA currently forecasts Brent will peak at $115 per barrel in Q2 2026 before gradually declining — and that forecast assumes the conflict does not persist beyond April and that Hormuz flows gradually resume.
“This is not like 2022 where you flip a switch and Russian oil finds new buyers,” says Priya Mehta, head of commodities research at a London-based fixed-income house. “You’re talking about a waterway that physically cannot return to 20 million barrels a day in a week or a month, even if peace breaks out tomorrow. The logistics don’t work that way.”
The Investor Imperative: What Comes Next
For energy investors, portfolio managers, and the finance ministers of oil-importing nations still stubbornly hoping for a soft landing, the tactical calculus is uncomfortable but navigable.
Upside scenario (probability: 30–35%): A ceasefire extension is agreed before April 21. Pakistan brokers a second round of talks, possibly in Islamabad or a Gulf capital. A partial opening of the Strait — even to 40–50% of pre-war flows — triggers a swift Brent correction toward $80/bbl. Non-OPEC production (US, Brazil, Guyana) is already ramping, and US crude inventories have risen for eight consecutive weeks, providing a demand buffer.
Base scenario (probability: 50%): Talks continue intermittently. The ceasefire lapses without full war resuming, but the Hormuz blockade partially continues. Brent oscillates in a $90–$110 range through Q2, with sharp intraday volatility driven by diplomatic headlines. The EIA’s forecast of a Q2 peak at $115/bbl looks increasingly plausible.
Tail risk scenario (probability: 15–20%): Iran executes its threat to suspend shipments across the Persian Gulf, Sea of Oman, and Red Sea. Brent retests $120–$130. Global recession probability climbs sharply. Strategic reserves run thin. The IEA’s own stress scenario — which it delicately buries in a technical annex — suddenly becomes the base case.
The strategic reserve cushion is real but finite. The IEA’s coordinated 400-million-barrel release provides a significant buffer, but in the absence of a swift resolution, it remains a stop-gap measure, not a structural solution. Every week of continued disruption draws that buffer down.
The Thesis: Hope Is the Most Dangerous Commodity in This Market
There is a particular kind of danger in markets when a fragile, unresolved diplomatic process is mistaken for a settled outcome. We saw it in 2015 with the JCPOA — the Iran nuclear deal that survived three rounds of negotiations, a decade of sanctions architecture, and ultimately did not survive a single US administration change. We are seeing it again now.
The Islamabad talks failed after 21 hours, yet Brent is trading 26% below its April 2 peak. The Strait of Hormuz remains effectively closed. The IEA has formally declared this the largest supply shock in market history. Iran’s IRGC has stated that any US naval encroachment into the strait constitutes a ceasefire violation. The ceasefire expires in five days.
And yet — 44 cents a barrel lower, traders exhale.
This is not rational pricing. This is hope acting as a price suppressor, and it creates an asymmetric risk profile that should alarm anyone with energy exposure: the downside from renewed escalation is measured in dozens of dollars per barrel, while the upside from a genuine diplomatic breakthrough is already partially priced in.
The oil market, in short, is short-selling the probability of failure in a negotiation that has already failed once this week.
My counsel is blunt: do not chase this dip. The ceasefire’s expiry on April 21 is the next inflection point. Watch whether Pakistan succeeds in brokering a second in-person meeting. Watch whether the IEA’s physical market stress indicators — spot-futures spreads, tanker insurance rates, Asian refinery run rates — continue to diverge from paper prices. And watch the IRGC’s language, which has consistently been a leading indicator of kinetic intent.
The Strait of Hormuz is not yet open. The peace is not yet made. And the barrel of oil that fell on Thursday morning may not stay fallen by Thursday evening.
Discover more from The Economy
Subscribe to get the latest posts sent to your email.



Key Takeaways
- Rolex’s secondary market rose approximately 7.9% year-over-year as of 2026 (per WatchCharts data) — trailing Patek Philippe (+16.2%) and Tudor (+11.4%) but still outperforming Audemars Piguet (+3.4%).
- Rolex raised U.S. retail prices 4–9% in January 2026 (steel models ~5.6%, gold models ~8.7%), narrowing the historical gap between retail and pre-owned pricing.
- Not every model appreciates: steel sports references (Submariner, GMT-Master II, Daytona) have held value far better than two-tone or widely available dress references like the standard Datejust.
- The Lady-Datejust posted the sharpest 2026 gain among tracked collections — up 22.73%, from roughly $9,269 to $11,376 — driven by demand for smaller, “everyday luxury” watches.
- Gold’s rise past $2,400/oz has directly lifted the investment case for Rolex’s precious-metal references (Day-Date, Sky-Dweller, Yacht-Master).
The Model-by-Model Picture
| Category | 2026 Trend |
|---|---|
| Lady-Datejust | +22.73% (strongest performer among tracked collections) |
| Steel sports models (Submariner, GMT-Master II) | Held value well; corrected from 2022 peak but stabilized above retail |
| Daytona | Corrected from highs above $50,000 to the mid-$30,000s; still among the most sought-after references |
| Two-tone/widely available Datejust | Flat to negative — “holds value” is an overstatement for this category |
| Gold references (Day-Date, Sky-Dweller) | Lifted by gold’s rise above $2,400/oz |
Why the “Rolex Always Appreciates” Myth Is Fading
The pandemic-era boom pushed some references — the Daytona above all — to speculative highs disconnected from historical norms. Since the March 2022 peak, steel sports models have compressed meaningfully, and dealers who bought inventory near the top have in some cases faced 20–40% markdowns on liquidation. The lesson for 2026 buyers: Rolex as a category is not a monolith. Value retention depends heavily on specific reference, condition, and whether the piece comes with box and papers (“full set”).
What’s Actually Driving 2026 Strength
- Retail price increases raise the floor. When a new Submariner retails at $10,050 (up from $9,500), a pre-owned example at $11,000–$12,000 suddenly represents a smaller premium — narrowing the gap without secondary prices actually moving.
- Supply discipline remains Rolex’s core lever. The brand has never confirmed production numbers, and secondary-market premiums remain entirely a function of Rolex’s own manufacturing decisions — a risk factor as much as a support.
- Certified Pre-Owned rollout. Rolex’s now fully rolled-out CPO program has changed how buyers transact in the used market, adding a layer of brand-verified legitimacy that supports pricing.
The Case for Rolex as a Portfolio Diversifier
Financial advisors increasingly frame luxury watches not as a replacement for equities or bonds, but as a tangible, historically low-correlation diversifier — one that carries its own risks (illiquidity, condition-dependent pricing, no yield) but has demonstrated multi-decade resilience for specific references.
Is Rolex a good investment in 2026?
It depends heavily on the specific reference. Steel sports models like the Submariner and Daytona have held or grown in value; two-tone and widely available dress models generally have not. Overall, Rolex’s secondary market rose about 7.9% year-over-year in 2026, trailing Patek Philippe but ahead of Audemars Piguet.
Discover more from The Economy
Subscribe to get the latest posts sent to your email.

Navigating Mortgage and Loan Refinancing in a High-Yield Environment
Global public debt crossing critical thresholds has kept central bank policies volatile, resulting in fluctuating US Treasury yields throughout 2026. For homeowners and commercial property holders burdened by previous high-interest borrowing cycles, finding optimal refinance windows has become a high-stakes financial puzzle. Stalled disinflation and stubborn employment numbers mean rate cuts are incremental, requiring borrowers to act with precision.
Timing your mortgage or commercial loan refinance in this environment requires a deep understanding of yield curve movements and lender risk appetites.
Decoding 2026 Refinance Dynamics
The 10-Year Treasury Yield Benchmark
Mortgage rates continue to track closely with the 10-year US Treasury yield. When macroeconomic anxiety spikes debt issuance, yields rise, tightening consumer borrowing capacity. Savvy borrowers monitor weekly Treasury auctions to lock in rates during brief dip windows.
Hybrid ARMs and Alternative Structures
With fixed rates remaining elevated, 7/1 and 10/1 adjustable-rate mortgages (ARMs) have surged in popularity. These products offer lower initial monthly payments, giving borrowers breathing room until central bank easing cycles fully materialize.
| Loan Product | Current Rate Range | Best For | Key Risk Factor |
| 30-Year Fixed Mortgage | 6.2% – 6.8% | Long-term predictability | Higher initial monthly outlay |
| 7/1 Hybrid ARM | 5.5% – 5.9% | Short-term ownership / flipping | Rate reset risk after year 7 |
| Commercial Refinance | 7.0% – 8.2% | Corporate asset restructuring | Strict DSCR lender covenants |
Actionable Steps for Successful Refinancing
To maximize your chances of securing favorable refinance terms in a volatile market, follow a disciplined preparation strategy.
Boost Your Credit Score Immediately: Lenders in 2026 are applying stringent credit tiering; a 20-point increase can drop your APR by a crucial quarter-point.
Shop Regional Credit Unions: Smaller financial institutions often offer portfolio loans with more flexible underwriting than major national banks.
Calculate the Break-Even Point: Ensure your total closing costs are recouped through monthly savings within 24 months of closing.
“Market Strategist View: Refinancing in 2026 is an exercise in opportunistic timing. Borrowers must maintain immaculate financial profiles ready to strike the moment Treasury yields dip.”
Mastering the complexities of today’s debt environment ensures you can successfully lower your debt service costs and protect your long-term financial stability.
Discover more from The Economy
Subscribe to get the latest posts sent to your email.

The days of pulling generic auto insurance quotes based purely on your zip code and age are officially over. In 2026, insurance comparison engines are powered entirely by generative AI and real-time telematics. These platforms digest thousands of live data points—ranging from your driving smoothness via connected vehicle sensors to real-time traffic congestion patterns—to generate hyper-personalized premiums instantly.
For consumers, this evolution represents both a massive opportunity for savings and a hidden trap for penalty pricing. Understanding how AI algorithms evaluate risk is essential for anyone looking to lower their monthly auto insurance premiums.
How AI Comparison Engines Evaluate Your Risk Profile
Behavioral Telematics and Connected Cars
Modern cars stream performance data directly to insurance aggregators. Generative AI models analyze braking sharpness, acceleration curves, cornering G-forces, and phone distraction metrics. Drivers who maintain smooth, defensive habits are rewarded with dynamic rate cuts of up to 40% compared to traditional rating tiers.
Predictive Traffic and Weather Modeling
AI tools now cross-reference your daily commute route with predictive weather and accident probability models. If your standard parking location or driving corridor has a statistically higher incidence of uninsured motorist claims, your quotes will reflect that hyper-local risk assessment.
| Comparison Factor | Traditional Rating Model | 2026 Generative AI Model | Impact on Premium |
| Mileage & Usage | Annual estimated odometer reading | GPS tracking & live trip duration | High (up to 35% savings) |
| Driving Behavior | MVR driving record & accidents | Real-time braking, speed, & G-force | Critical (determines tier) |
| Vehicle Tech | Make, model, and safety rating | ADAS calibration & repair cost data | Moderate |
Strategies to Lower Your AI-Driven Insurance Quote
To outsmart the algorithm and secure the lowest possible premium in 2026, drivers must proactively manage their digital footprint on insurance platforms.
Opt-In for Telematics Trial Periods: Many insurers offer immediate 15% discounts just for installing their driving app; let it track safe habits for 30 days to lock in permanent savings.
Scrub Unverified Public Records: Ensure your motor vehicle report is free of clerical errors that AI risk models misinterpret as reckless behavior.
Compare AI Aggregators: Use platforms that integrate multi-carrier API feeds rather than single-brand comparison sites to find the best risk-adjusted rate.
“Industry Note: AI-driven pricing rewards transparency and precision. Drivers who actively manage their telematics data consistently out-save those relying on legacy quote calculators.”
Embracing AI comparison tools allows savvy policyholders to customize coverage limits precisely to their driving habits, eliminating wasted premium spend while ensuring robust protection.
Discover more from The Economy
Subscribe to get the latest posts sent to your email.

Asian Stock Markets 2026: Japan, China, Pakistan & More

Mortgage Rates Today 2026: Full Rate Guide & Forecast

Beyond Paper Wealth: Unpacking Donald Trump’s Multibillion-Dollar Liquidity and Legal Crisis

Bitcoin & XRP 2026: Inside Crypto’s Institutional Era

Global Economy 2026: IMF Growth, AI Stocks & Market Risk

China’s Local Debt Race Against Time: Why Economists Demand Central Action Before the Deflation Window Closes

Money News: How to Protect Your Portfolio From Global Inflation

World Bank Projections: Emerging vs. Big Economies of Asia

IMF Reports 2026: What the Latest Data Means for the Global Economy

Singapore Stocks Outlook: A Safe Haven in the Asian Market?

China Stocks vs. Japan Stocks: Where Should You Invest in Late 2026?

VIX Index Explained: How to Trade Wall Street’s Fear Gauge Today

Commercial vs Residential Real Estate: Which Wins in 2026?

Presidential Stock Market Performance: How Trump’s Second Term Compares to History

Top 30 Stocks for Investment in PSX for Massive ROI in 2026

SpaceX Starship Flight 14: First Orbital Attempt & Starlink V3 Launch Explained

AI Chip Stocks 2026: The Best Semiconductor Investments Beyond Marvell

The 2026 Crypto Regulatory Shift: What It Means for Institutional Investors

Fidelity Investments Review 2026: SPAXX Yields & Zero-Fee Funds

Oil Prices Break $100 in 2026: Middle East Conflict & Energy Markets

Tween Back-to-School Trends 2026: What’s Driving the $85B Season

AI-Powered Training: The Next Multi-Billion Dollar Ecosystem in Fitness

BRICS+ Cross-Border Payments 2026: Interoperability Explained

10-Year Treasury Yield Hits 4.80%: What It Means for Rates & Portfolios

Shein Clothes Quality & Safety in 2026: What Lab Tests Show

MRVL Earnings 2026: Why Marvell Sank Despite Beating Estimates

China’s US$10.8 Billion Trade Shortcut: Why the Pinglu Canal Matters

Leveraging Viral AI & Climate Hashtags for Brand Growth on X
-

 Markets & Finance9 months ago
Top 15 Stocks for Investment in 2026 in PSX: Your Complete Guide to Pakistan’s Best Investment Opportunities
-

 Analysis7 months ago
Johor’s Investment Boom: The Hidden Costs Behind Malaysia’s Most Ambitious Economic Surge
-

 Analysis7 months ago
Top 10 Stocks for Investment in PSX for Quick Returns in 2026
-

 Analysis8 months ago
Brazil’s Rare Earth Race: US, EU, and China Compete for Critical Minerals as Tensions Rise
-

 Banks8 months ago
Best Investments in Pakistan 2026: Top 10 Low-Price Shares and Long-Term Picks for the PSX
-

 Investment8 months ago
Top 10 Mutual Fund Managers in Pakistan for Investment in 2026: A Comprehensive Guide for Optimal Returns
-

 Global Economy9 months ago
15 Most Lucrative Sectors for Investment in Pakistan: A 2025 Data-Driven Analysis
-

 Global Economy9 months ago
Pakistan’s Export Goldmine: 10 Game-Changing Markets Where Pakistani Businesses Are Winning Big in 2025