
Analysis
JLR Targets US Millionaires & Billionaires With Hybrid Cars

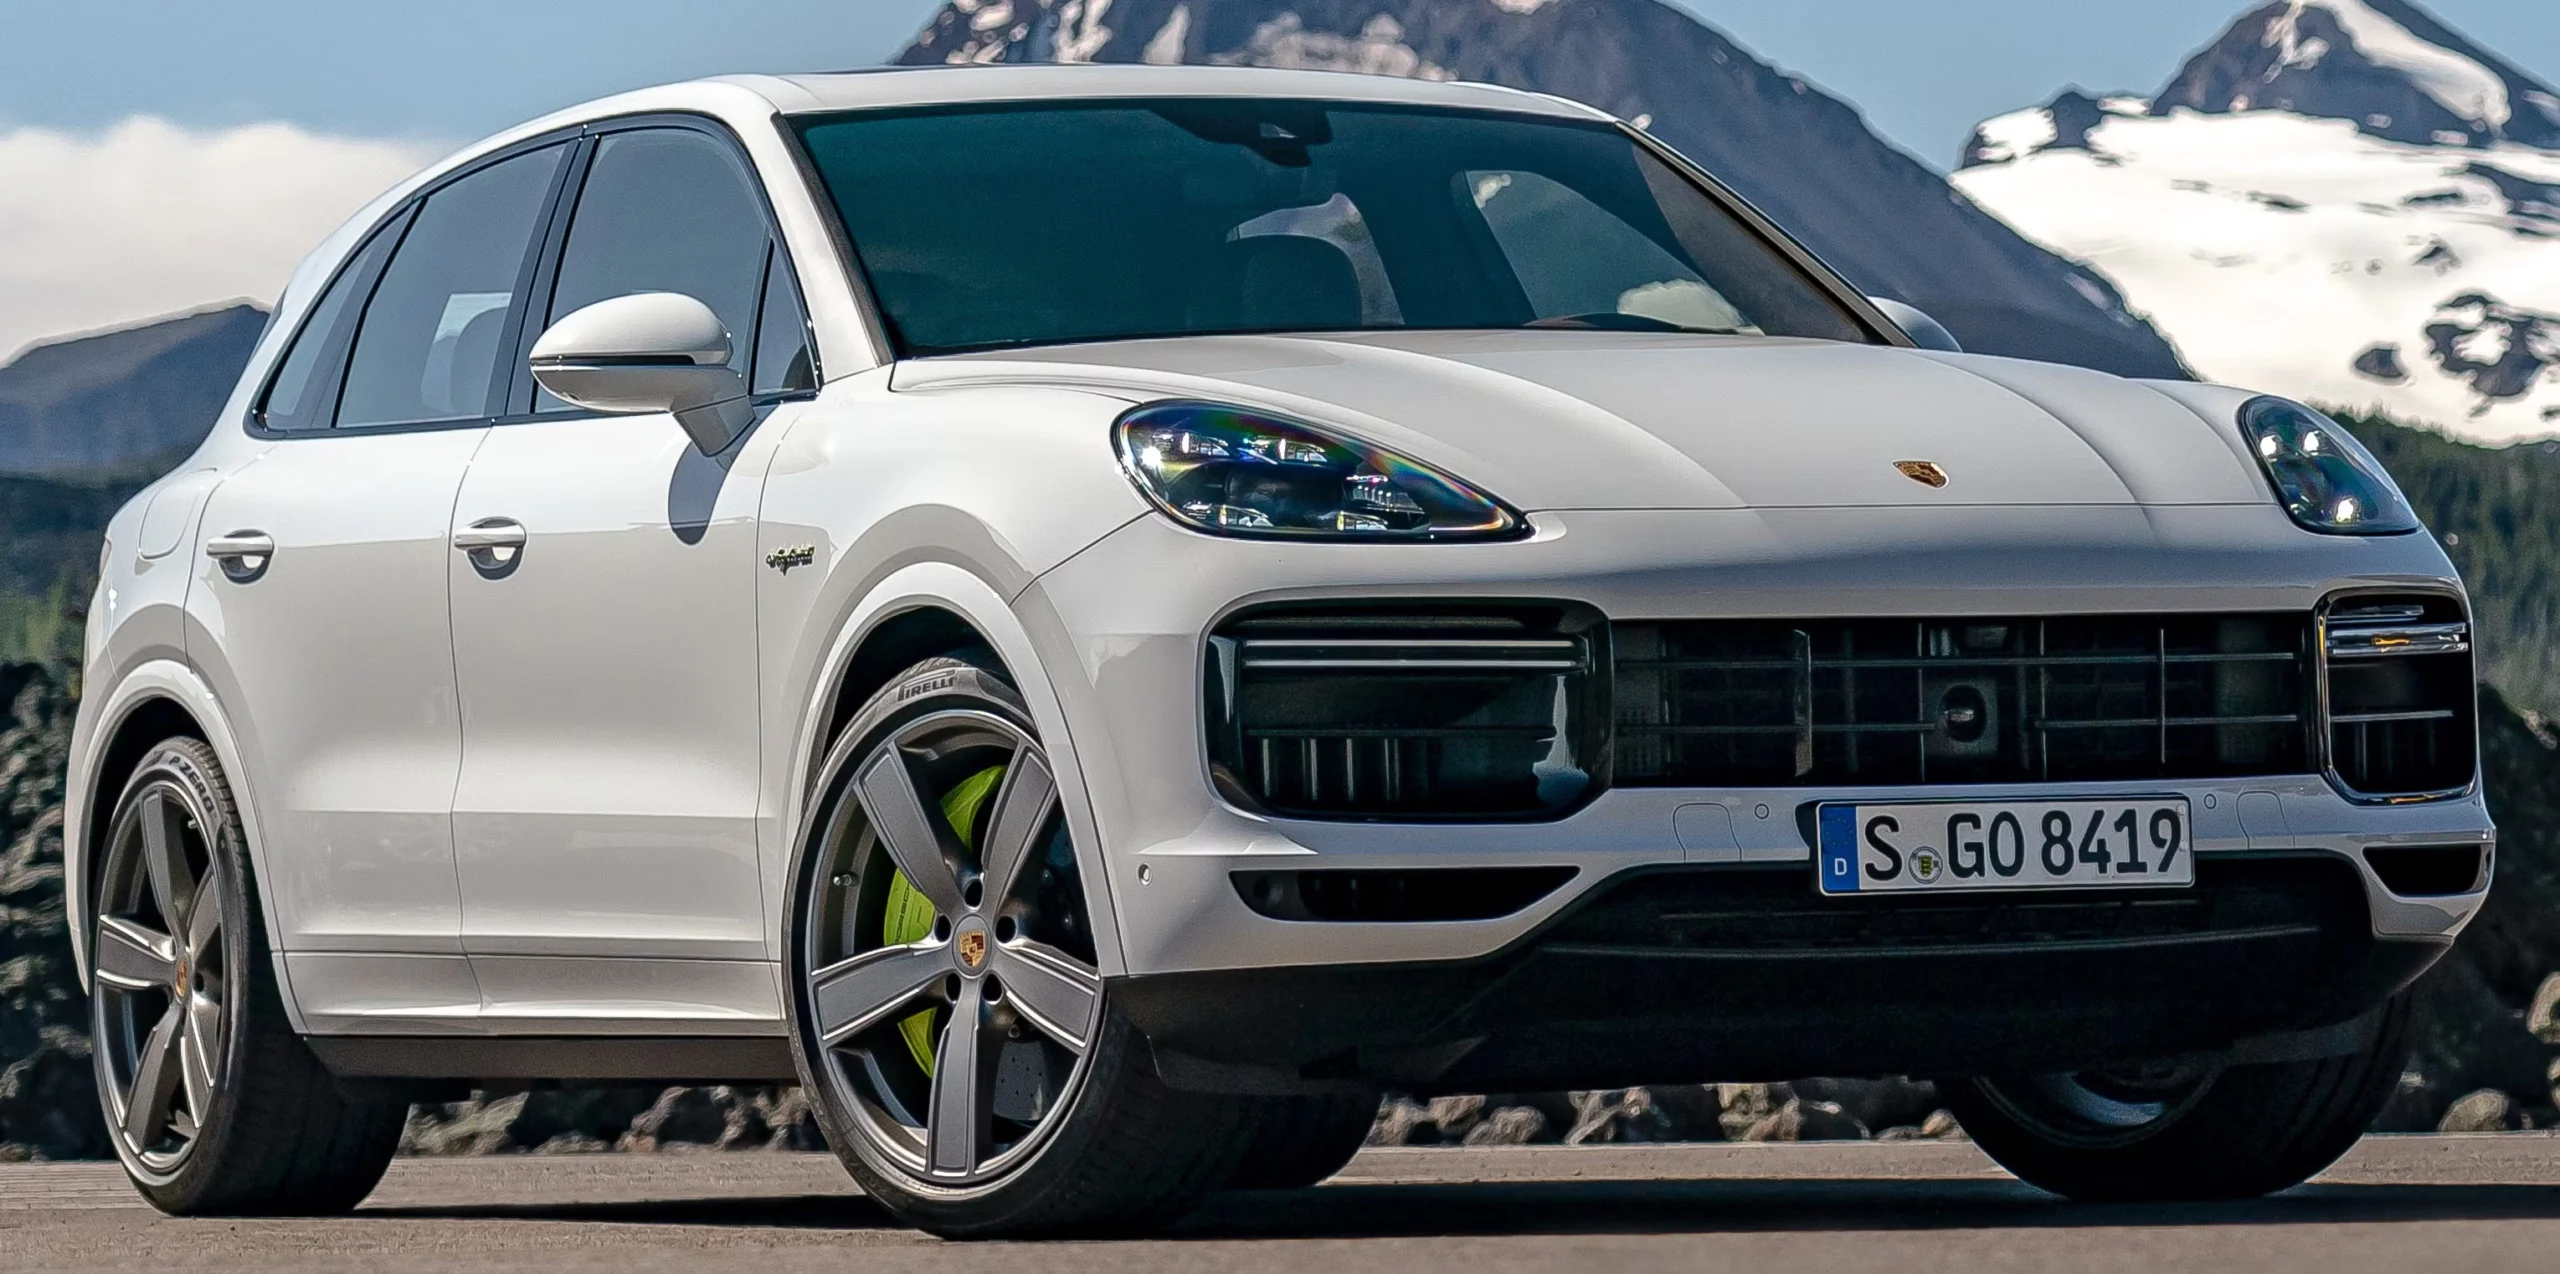
At Gaydon, Warwickshire, on June 17, 2026, Jaguar Land Rover’s chief executive, PB Balaji, told a room of bondholders, banks and Tata Motors investors that the carmaker’s American future runs less through the charging cable than through old-fashioned petrol — and plenty of it. JLR’s strategy now targets US millionaires and billionaires with hybrid and petrol-powered Range Rovers and Defenders, betting that buyers who don’t blink at six-figure price tags also won’t blink at Donald Trump’s tariffs. It’s a reversal five years in the making. Shares in Tata Motors Passenger Vehicles fell more than 8% on the day.
The timing isn’t accidental. JLR is still digging out from a cyberattack that the UK’s Cyber Monitoring Centre called the most economically damaging cyber event in the country’s history — a five-week production shutdown last September that cost an estimated £1.9 billion and rippled through more than 5,000 supplier firms. Layer on a 25% US import tariff imposed in April 2025, later trimmed to 10% for UK-built cars under a bilateral trade deal but left higher for Slovak-built Defenders, and the arithmetic of selling cars in America turned brutal. JLR’s full-year results for FY26, posted on its own investor relations site, explain why patience has worn thin: revenue of £22.9 billion, wholesale volume down 23.2% on the previous year, and an EBIT margin of just 0.7%. Against that backdrop, doubling down on wealthy, price-insensitive American buyers looks less like ambition and more like survival.
Inside JLR’s Plan to Win Over America’s Millionaires and Billionaires
At the heart of Wednesday’s presentation was a structure JLR calls House of Brands: four distinct identities — Range Rover, Defender, Discovery and Jaguar — each pursuing a different relationship with the battery. Jaguar alone goes fully electric, built on a new Electric Modular Architecture (EMA) at Halewood, Merseyside, with the first Type 01 grand tourer due this year. Range Rover, Defender and Discovery keep what JLR calls propulsion flexibility: mild hybrid, full hybrid, plug-in hybrid and battery-electric variants sold side by side for as long as customers want them.
That flexibility is the real story. Trade publication WardsAuto reported that JLR now frames hybrid and combustion models as a deliberate bridge while battery-electric versions catch up with demand, not a stopgap to be abandoned the moment EV sales improve. That’s a marked change in tone from 2021, when JLR’s original Reimagine strategy promised Jaguar would lead an electric-only future for the entire group.
North America sits at the center of the new plan. Balaji told reporters that rising demand for luxury goods, paired with strong brand loyalty, points to real growth potential in the region, and singled out Defender as a candidate for new high-end variants tailored to American buyers. JLR is already exploring how to make that happen on the ground: a non-binding memorandum of understanding signed with Stellantis weeks earlier opens the door to building Defender-style vehicles on US soil, sidestepping import tariffs altogether, according to bmmagazine.
JLR laid out the financial logic in hard numbers:
- £3.7 billion in near-term investment, much of it aimed at next-generation Range Rover and Range Rover Sport electric variants and the Jaguar Type 01
- £1.7 billion in cost savings over two years, intended to push the company’s breakeven point down from 350,000 units to roughly 300,000
- A 4% EBIT margin target for FY27 — modest by historic JLR standards, but a clear improvement on FY26’s 0.7%
- An £18 billion investment commitment running through FY29, unchanged despite the turbulence
What JLR’s Hybrid and Petrol Strategy Reveals About the Luxury EV Slowdown
JLR isn’t alone in pulling back. Auto Express noted that Porsche has abandoned its target of selling 80% electric vehicles by 2030, reintroducing hybrid and petrol models; Lamborghini converted a planned electric model into a hybrid; and Bentley pushed back its first all-electric SUV by roughly a year. The pattern across the ultra-luxury tier is consistent: brands that promised an electric-only future are buying themselves more time with combustion and hybrid power, in precisely the price bracket JLR is now chasing.
Why Is JLR Targeting Millionaires and Billionaires in the US?
Wealthy American buyers are largely indifferent to tariff-driven price increases, and the US supplies more than a quarter of JLR’s global revenue. With roughly 20 million American millionaires and a record 989 US billionaires per Forbes’ 2026 list, JLR sees more durable margins in fewer customers than in volume.
The logic traces back further than this week. Carscoops reported in 2023 that then-chief-executive Adrian Mardell first floated the idea of chasing America’s millionaire class rather than competing on volume, pointing to Jaguar’s stronger, wealthier customer base in the 1990s. What’s changed under Balaji is the scope: the millionaire pitch now spans the whole House of Brands, not just a reinvented Jaguar, and it comes paired with an explicit hybrid-and-petrol commitment rather than a promise that EVs alone would carry the group upmarket.
Yet the electric ambition hasn’t disappeared — it’s been re-sequenced. Jaguar’s first EMA-based product and a Range Rover Electric variant are both due this year, giving JLR a foot in both camps: electric halo cars to prove technological credibility, and combustion-hybrid volume to keep the balance sheet alive while battery costs and US charging infrastructure catch up with the company’s own ambitions.
The Second-Order Effects: Suppliers, Rivals and the UK’s Manufacturing Base
The shift carries consequences well beyond JLR’s own balance sheet. The company’s UK supply chain, still recovering from last year’s cyberattack, depends on stable production volumes to absorb fixed costs; the Bank of England said the production halt alone shaved 0.17 percentage points off UK GDP in September 2025, a reminder of how tightly JLR’s fortunes are woven into Britain’s industrial output. A pivot toward hybrid and petrol variants, which draw on more conventional and more diversified parts than battery-electric platforms, could ease some of that pressure by spreading orders across a wider supplier base rather than concentrating them on battery and motor specialists.
For competitors, JLR’s move sharpens an emerging two-speed market in luxury vehicles. BMW, Mercedes-Benz and Porsche all manufacture inside the United States, face a smaller tariff penalty as a result, and can afford to keep pushing electric models without the same urgency to lean back on combustion. JLR, lacking US factories, doesn’t have that luxury. Its discussions with Stellantis about American production are as much about tariff arithmetic as about market positioning — and a sign of how seriously the company takes the cost gap. Automotive News has separately reported that JLR absorbed a $520 million tariff hit in the US even after raising prices, underlining just how exposed the company remains without domestic assembly.
For policymakers, the implications cut two ways. A renewed reliance on combustion and hybrid technology buys JLR time but complicates the UK’s own net-zero ambitions for vehicle manufacturing, given the company’s outsized share of British car output. In Washington, the strategy amounts to a quiet vote of confidence that tariff policy, disruptive as it’s been, hasn’t driven JLR out of the US market. Instead, the company is reorganizing around it — exploring domestic assembly through Stellantis and leaning into the one customer segment tariffs can’t easily touch. Small and medium-sized JLR suppliers, many of whom received emergency financing after the cyberattack, stand to benefit most directly from steadier production, since a wider, more flexible model range generally means more predictable order volumes than a high-stakes bet on EV-only output timed against uncertain demand.
The Skeptics’ Case: Is This Strategic Patience or Retreat?
Not everyone reads JLR’s pivot as prudence. Critics within the industry argue that five years after Reimagine promised an electric-only Jaguar and a rapidly electrifying Land Rover lineup, repeated delays to the Range Rover Electric and now an explicit embrace of petrol and hybrid power for growth read less like sequencing and more like retreat. The brand froze sales of some combustion Jaguar models in 2024 to clear room for its rebrand, only to lean on hybrid and petrol Land Rover products two years later to hit growth targets — a contradiction that gives ammunition to those who say the original electric-only timeline was unrealistic from the start.
There’s also a balance-sheet argument against complacency. JLR’s FY26 free cash flow was negative £2.2 billion, and an EBIT margin target of just 4% for FY27 remains well below the 10% management once promised before tariffs and the cyberattack intervened. Tata Motors Passenger Vehicles’ 8% share-price drop on results day suggests investors share some of that skepticism, even as they welcome a more conservative breakeven target.
JLR’s defenders counter that hybrid and petrol sales are simply more profitable than EVs at current battery costs, and that doubling down on America’s wealthiest buyers — rather than racing rivals toward mass-market EV volume — is the only credible path back to double-digit growth. That said, the next two years of delivery, not Wednesday’s slide deck, will settle the argument.
The tension at the heart of JLR’s announcement isn’t really about batteries versus engines. It’s about whether a heritage luxury group, still recovering from the costliest cyberattack in UK history and squeezed by an American tariff regime built for an earlier kind of trade war, can buy itself enough time with the wealthy to outlast the slower parts of the electric transition. Balaji is betting that America’s millionaires and billionaires, insulated from sticker shock by definition, are patient enough to wait while charging infrastructure and battery economics catch up. Mardell made a version of the same bet in 2023, before tariffs, before the breach, before a 23% drop in wholesale volumes. What’s different now is the size of the wager. JLR isn’t just reaching upmarket anymore — it’s reorganizing its entire House of Brands around the proposition that scarcity, not scale, is the only luxury strategy still standing.
Discover more from The Economy
Subscribe to get the latest posts sent to your email.


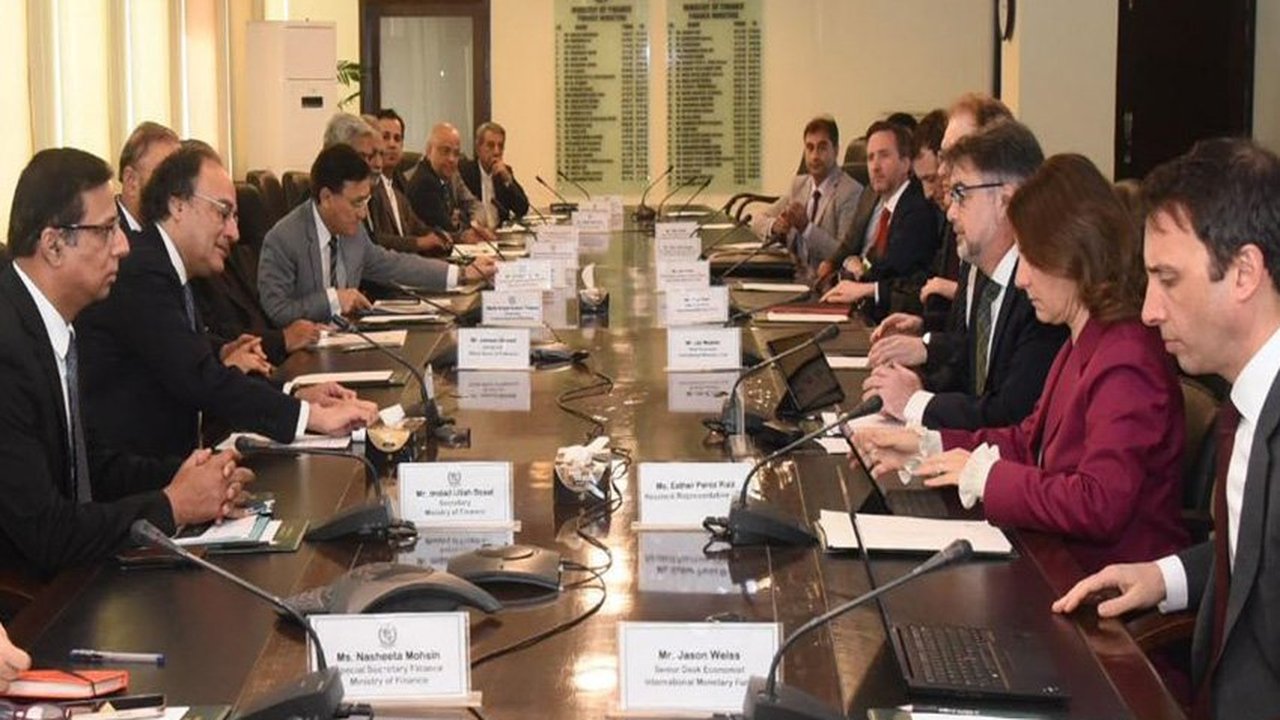
The IMF’s Executive Board completed Pakistan’s third review of its 37-month Extended Fund Facility (EFF) and second review of its Resilience and Sustainability Facility (RSF) on May 8, 2026, unlocking roughly $1.1 billion under the EFF and $220 million under the RSF, according to the IMF’s official statement. Total disbursements under both arrangements now stand at roughly $4.8 billion. Acting Chair Nigel Clarke credited Pakistan’s “strong program implementation” for supporting macroeconomic recovery and building resilience to shocks.
The Genuinely Good Numbers
By the IMF’s own account, the underlying data supports the assessment. GDP growth accelerated to an average of 3.8% year-on-year in the first half of FY26, driven by the auto, construction and garment industries, even accounting for flood disruption in July-August, according to the IMF’s staff report. Inflation, while ticking up to 7.3% year-on-year in March as commodity price pass-through hit domestic energy prices, remained within a broadly contained range, with core inflation at 7.6%. The current account was described as broadly balanced, and reserve rebuilding exceeded earlier projections — the State Bank of Pakistan projects reserves continuing to climb to roughly $18 billion by June 2026, according to analysis from the Islamabad Policy Research Institute.
The State Bank confirmed receipt of $1.3 billion from the IMF on May 12, 2026, according to CSS Prep’s policy analysis, which notes reserves had fallen to dangerously low levels in 2022-2023 before this recovery.
The External Risk the IMF Flagged Explicitly
The Fund’s own report is notably candid about downside exposure: under its April 2026 World Economic Outlook adverse scenario, the cumulative hit to Pakistan’s GDP from continued Middle East conflict could rise to around 1.5 percentage points by FY27, with inflation and the current account deficit each worsening by roughly 1.5-2.5 percentage points of GDP, according to the IMF’s staff country report. Given Pakistan’s reliance on imported energy, oil price volatility discussed in the IMF’s global outlook feeds directly into this specific country risk.
The Reform Question That Keeps Recurring
The structural policy conditions attached to this review read as familiar territory: sustaining fiscal consolidation, broadening the tax base, maintaining tight monetary policy to keep inflation within the State Bank’s target range, and advancing energy-sector reform — commitments the IMF’s own end-of-mission statement described as still “ongoing” rather than complete, per the IMF’s March 2026 mission statement.
A sharper framing comes from Pakistani policy analysts themselves: reforms that would genuinely break the IMF-program cycle — broadening the tax base to include agriculture and retail, ending energy subsidies, privatizing loss-making state-owned enterprises — impose concentrated, visible costs on politically organized interest groups, while the benefits of reversing those costs are diffuse and delayed, according to CSS Prep’s analysis. That political-economy imbalance, the analysis argues, consistently favors populist continuation of stabilization support over the structural reform that would end the need for it — a pattern this third review’s genuine macroeconomic progress doesn’t yet break.
Social Cost of the Adjustment
Pakistan’s poverty headcount rate rose to 25.3% in FY24, up sharply from 18.3% in FY22, driven by overlapping shocks from COVID, floods and inflation, according to the IMF’s staff report. The Benazir Income Support Programme (BISP) remains the primary social protection mechanism absorbing the distributional cost of IMF-mandated energy price increases and fiscal tightening — whether its scale is adequate remains, in the IMF’s own words, a live policy question rather than a settled one.
Discover more from The Economy
Subscribe to get the latest posts sent to your email.
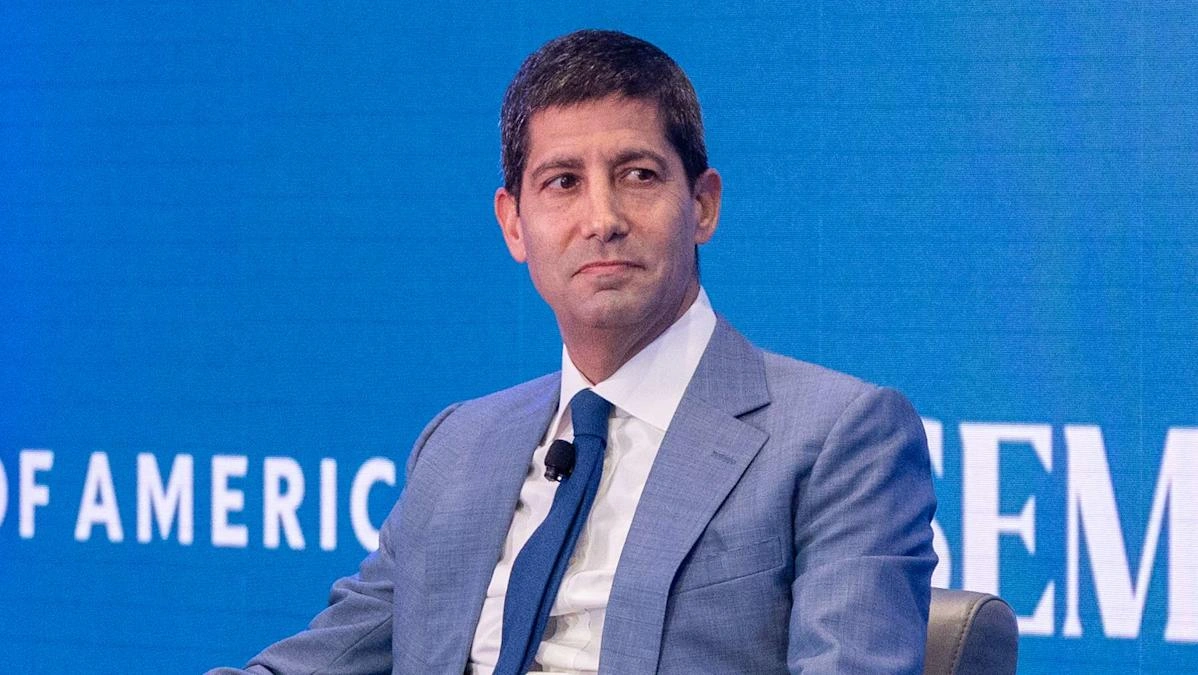
The Federal Reserve held its benchmark interest rate steady at 3.5%-3.75% on July 29, 2026, but the more consequential detail was the vote itself: 9-3, with three regional Federal Reserve Bank presidents — Cleveland’s Beth Hammack, Minneapolis’s Neel Kashkari, and Dallas’s Lorie Logan — dissenting in favor of a rate hike, according to CNBC’s coverage of the meeting. Inflation has remained above the Fed’s 2% target for more than five years, the underlying tension driving the split.
A New Chair, A Different Communication Style
The decision was the latest under Fed Chair Kevin Warsh, who took over after Jerome Powell’s term expired on May 15, 2026, according to iShares’ 2026 Fed outlook. Warsh has deliberately shortened the Fed’s post-meeting statements and pulled back on the kind of explicit forward guidance markets had grown accustomed to under his predecessors — he has reportedly dedicated one of five internal task forces specifically to rethinking how the Fed communicates, according to CNBC’s reporting. Warsh has publicly called inflation “a choice,” repeatedly emphasizing the importance of getting prices under control in recent congressional testimony.
At his post-meeting press conference, Warsh pushed back on characterizing the decision as a “pause,” instead describing it as “a rigorous review of the economic situation” and “a view of what our own homework is to try to resolve those questions in the period ahead,” according to a separate CNBC recap. Warsh has reportedly used the phrase “family fight” 13 times across five public appearances to acknowledge the committee’s internal divisions — an unusually candid framing for a sitting Fed Chair.
Why the Split Exists
Governor Christopher Waller has separately voiced concern that higher rates could become necessary without more inflation progress, even though he voted for the hold at this meeting. The full committee’s June projections penciled in one quarter-point increase by the end of 2026 — a notable shift from the rate-cutting path markets had priced in earlier in the year, according to the Fed’s own June 2026 Summary of Economic Projections, which explicitly flags that the federal funds rate outlook “is subject to considerable uncertainty” given how sensitive each participant’s view is to how inflation and employment data evolve from here.
Complicating Factors
Renewed U.S.-Iran tensions have already pushed mortgage rates near a one-year high independent of the Fed’s own decisions, since longer-term rates track Treasury yields and inflation expectations rather than the Fed funds rate directly, according to CNBC’s analysis. Separately, iShares had earlier projected that once a new Chair was confirmed, the Fed might seek one or two rate cuts to bring rates closer to a 3%-3.25% range — a path the July hold and hawkish dissents now put in serious doubt.
The next FOMC meeting is scheduled for September 15-16, 2026, and will include a fresh Summary of Economic Projections, according to Forbes’ Fed tracker — the next real test of whether Warsh’s committee can narrow its internal divide or whether the “family fight” framing becomes the defining feature of Fed policy through the rest of 2026.
Discover more from The Economy
Subscribe to get the latest posts sent to your email.

Four major UK forecasters — the OBR, the Bank of England-adjacent IFS, NIESR, and RSM UK — are converging on a similar diagnosis for 2026: an economy that’s avoiding outright recession but also not meaningfully growing, squeezed between resilient inflation and cautious business investment.
The Growth Numbers Are Converging Downward
RSM UK’s latest forecast puts 2026 GDP growth at just 1.0%, down from 1.4% in 2025, describing the pattern explicitly as “stagflation-lite” for a second consecutive year, with a modest recovery only expected in 2027 as inflation fades and rate cuts continue, according to RSM’s economic outlook. NIESR’s central forecast is slightly more optimistic at 1.4% GDP growth for 2026, describing the economy as beginning the year “closer to normal than at any other point this decade” despite heightened geopolitical stress, per NIESR’s winter 2026 outlook.
The Institute for Fiscal Studies frames the constraint more directly: consumption and business investment will likely stay muted as elevated uncertainty, still-restrictive monetary policy, and continued household saving all weigh on activity, with businesses “dissuaded from investing by squeezed margins and high financing costs,” according to IFS’s economic outlook.
Inflation Is Heading Back Up, Not Down
The most consequential shared theme across forecasters: inflation, which briefly dipped below 3% in early 2026, is expected to climb back toward 3.5% by year-end. RSM attributes this to a 13% rise in the energy price cap in July, higher motor fuel costs, and pass-through effects into food and goods prices, forecasting inflation to average 3.1% for 2026 overall, per RSM’s analysis. Notably, the report flags that the IMF has revised its UK inflation and growth forecasts more sharply than for any other developed economy, given Britain’s outsized reliance on gas for electricity pricing.
Bank of England Rate Path
Despite the inflation uptick, both NIESR and IFS still expect further Bank of England rate cuts through 2026. NIESR forecasts two further 25-basis-point cuts bringing Bank Rate to 3.25% by year-end — its estimate of the long-run neutral rate — following a cut to 3.75% in December 2025. IFS’s own forecast assumes Bank Rate reaches 3.5% in the first half of 2026. The divergence between continued rate cuts and rising inflation is the core tension defining UK monetary policy through the rest of the year.
Fiscal Headroom Is Nearly Gone
The Office for Budget Responsibility’s March 2026 outlook flags the tax-to-GDP ratio rising to a post-war high of 38% by 2030-31, with the November 2025 Budget having raised taxes by roughly £26 billion annually against OBR-assessed fiscal headroom of just £22 billion, according to NIESR’s reading of the same data. NIESR’s own forecast is notably more pessimistic than the OBR’s, projecting the current budget stays close to balance by 2029-30 with effectively no headroom at all — meaning public debt continues climbing toward 100% of GDP by decade’s end, sharply limiting the government’s room to respond to any future shock. RSM adds a domestic political risk on top: a Labour leadership contest raising the prospect of higher borrowing and renewed gilt yield pressure, with a short recession “not ruled out” if that risk materializes alongside global headwinds.
For UK-based investors, Deloitte notes the practical fallout includes a reduced cash ISA allowance for under-65s (down from £20,000 to £12,000) and a 2027 increase in tax on landlord property income — both tightening the traditional wealth-preservation toolkit just as broader growth conditions stay subdued, according to Deloitte’s TaxScape 2026 briefing.
Discover more from The Economy
Subscribe to get the latest posts sent to your email.

Pakistan Passed Its Third IMF Review

The Fed Is Fractured — And a New Chair Just Made It Louder, Not Quieter

The UK Economy in 2026 Is Neither Recession Nor Recovery :Stagflaton

Indonesia’s $121 Billion Nickel Bet Is Facing a Battery Chemistry

Why Ultra-Wealthy Families Are Splitting Between Singapore and Dubai inmarkets 2026

China Chose Political Control Over Fixing Its Deflation Trap in 2026

Oil Markets Are Oversupplied and Geopolitically Explosive at the Same Time

Russia’s Budget Deficit Blew Past Its Full-Year Target in Three Months

Malaysia’s Rare Earth Bet: Six Powers Are Negotiating for Kuantan at Once

Gulf Sovereign Capital Bypasses Pakistan Despite Record 2026 Spending Spree

Pakistan’s $10bn US Facility Request: Inside the New Gulf Capital Triangle

China Criticizes US Bill Targeting Russian Oil Buyers — Why It Matters

Nvidia’s H200 Chips Are Finally Reaching China — In Numbers Too Small to Matter Yet

Oil Prices Fall as Strait of Hormuz Reopens: 2026 Update

AI Bubble Warning 2026: Why BIS, IMF and Bank of England Fear a Market Crash

Russia Bans Diesel Exports 2026: Global Fuel Market Impact Explained

Gold Price Forecast 2026: Fed’s July 29 Decision and Record Central Bank Buying Explained

Strait of Hormuz Blockade 2026: Oil Prices Surge 9% as US-Iran Conflict Reignites

Strait of Hormuz 2026: Why Markets Still Don’t Trust It’s Open

Gulf Capital Retreat From Pakistan 2026: UAE Loan Freeze & What It Means

Down But Not Out: Inside the Slow Sinking of Russia’s War Economy

Pakistan IMF Deal 2026: Third Review Cleared, Budget 2026-27 and Inflation Outlook

Pakistan Economy 2026: GDP Grows 3.7% as IMF Completes EFF Review Amid Middle East Risk

China Politburo July 2026: Stimulus Signals Explained

Global Stock Market Selloff 2026: Stagflation Fears Return as Iran Conflict Reignites

The Yuan Now Settles 67% of Russian Oil Payments — Quiet De-Dollarization in Action

Strait of Hormuz Crisis 2026: How Trump’s Toll U-Turn Exposes Global Economic Risk

Pakistan’s Economic Survey FY26: Inflation Spike Insights
-

 Markets & Finance7 months ago
Top 15 Stocks for Investment in 2026 in PSX: Your Complete Guide to Pakistan’s Best Investment Opportunities
-

 Analysis5 months ago
Johor’s Investment Boom: The Hidden Costs Behind Malaysia’s Most Ambitious Economic Surge
-

 Analysis5 months ago
Top 10 Stocks for Investment in PSX for Quick Returns in 2026
-

 Analysis6 months ago
Brazil’s Rare Earth Race: US, EU, and China Compete for Critical Minerals as Tensions Rise
-

 Banks7 months ago
Best Investments in Pakistan 2026: Top 10 Low-Price Shares and Long-Term Picks for the PSX
-

 Investment7 months ago
Top 10 Mutual Fund Managers in Pakistan for Investment in 2026: A Comprehensive Guide for Optimal Returns
-

 Global Economy7 months ago
15 Most Lucrative Sectors for Investment in Pakistan: A 2025 Data-Driven Analysis
-

 Global Economy7 months ago
Pakistan’s Export Goldmine: 10 Game-Changing Markets Where Pakistani Businesses Are Winning Big in 2025