
Business
How Generational Wealth Transfer Will Reshape China’s Economy

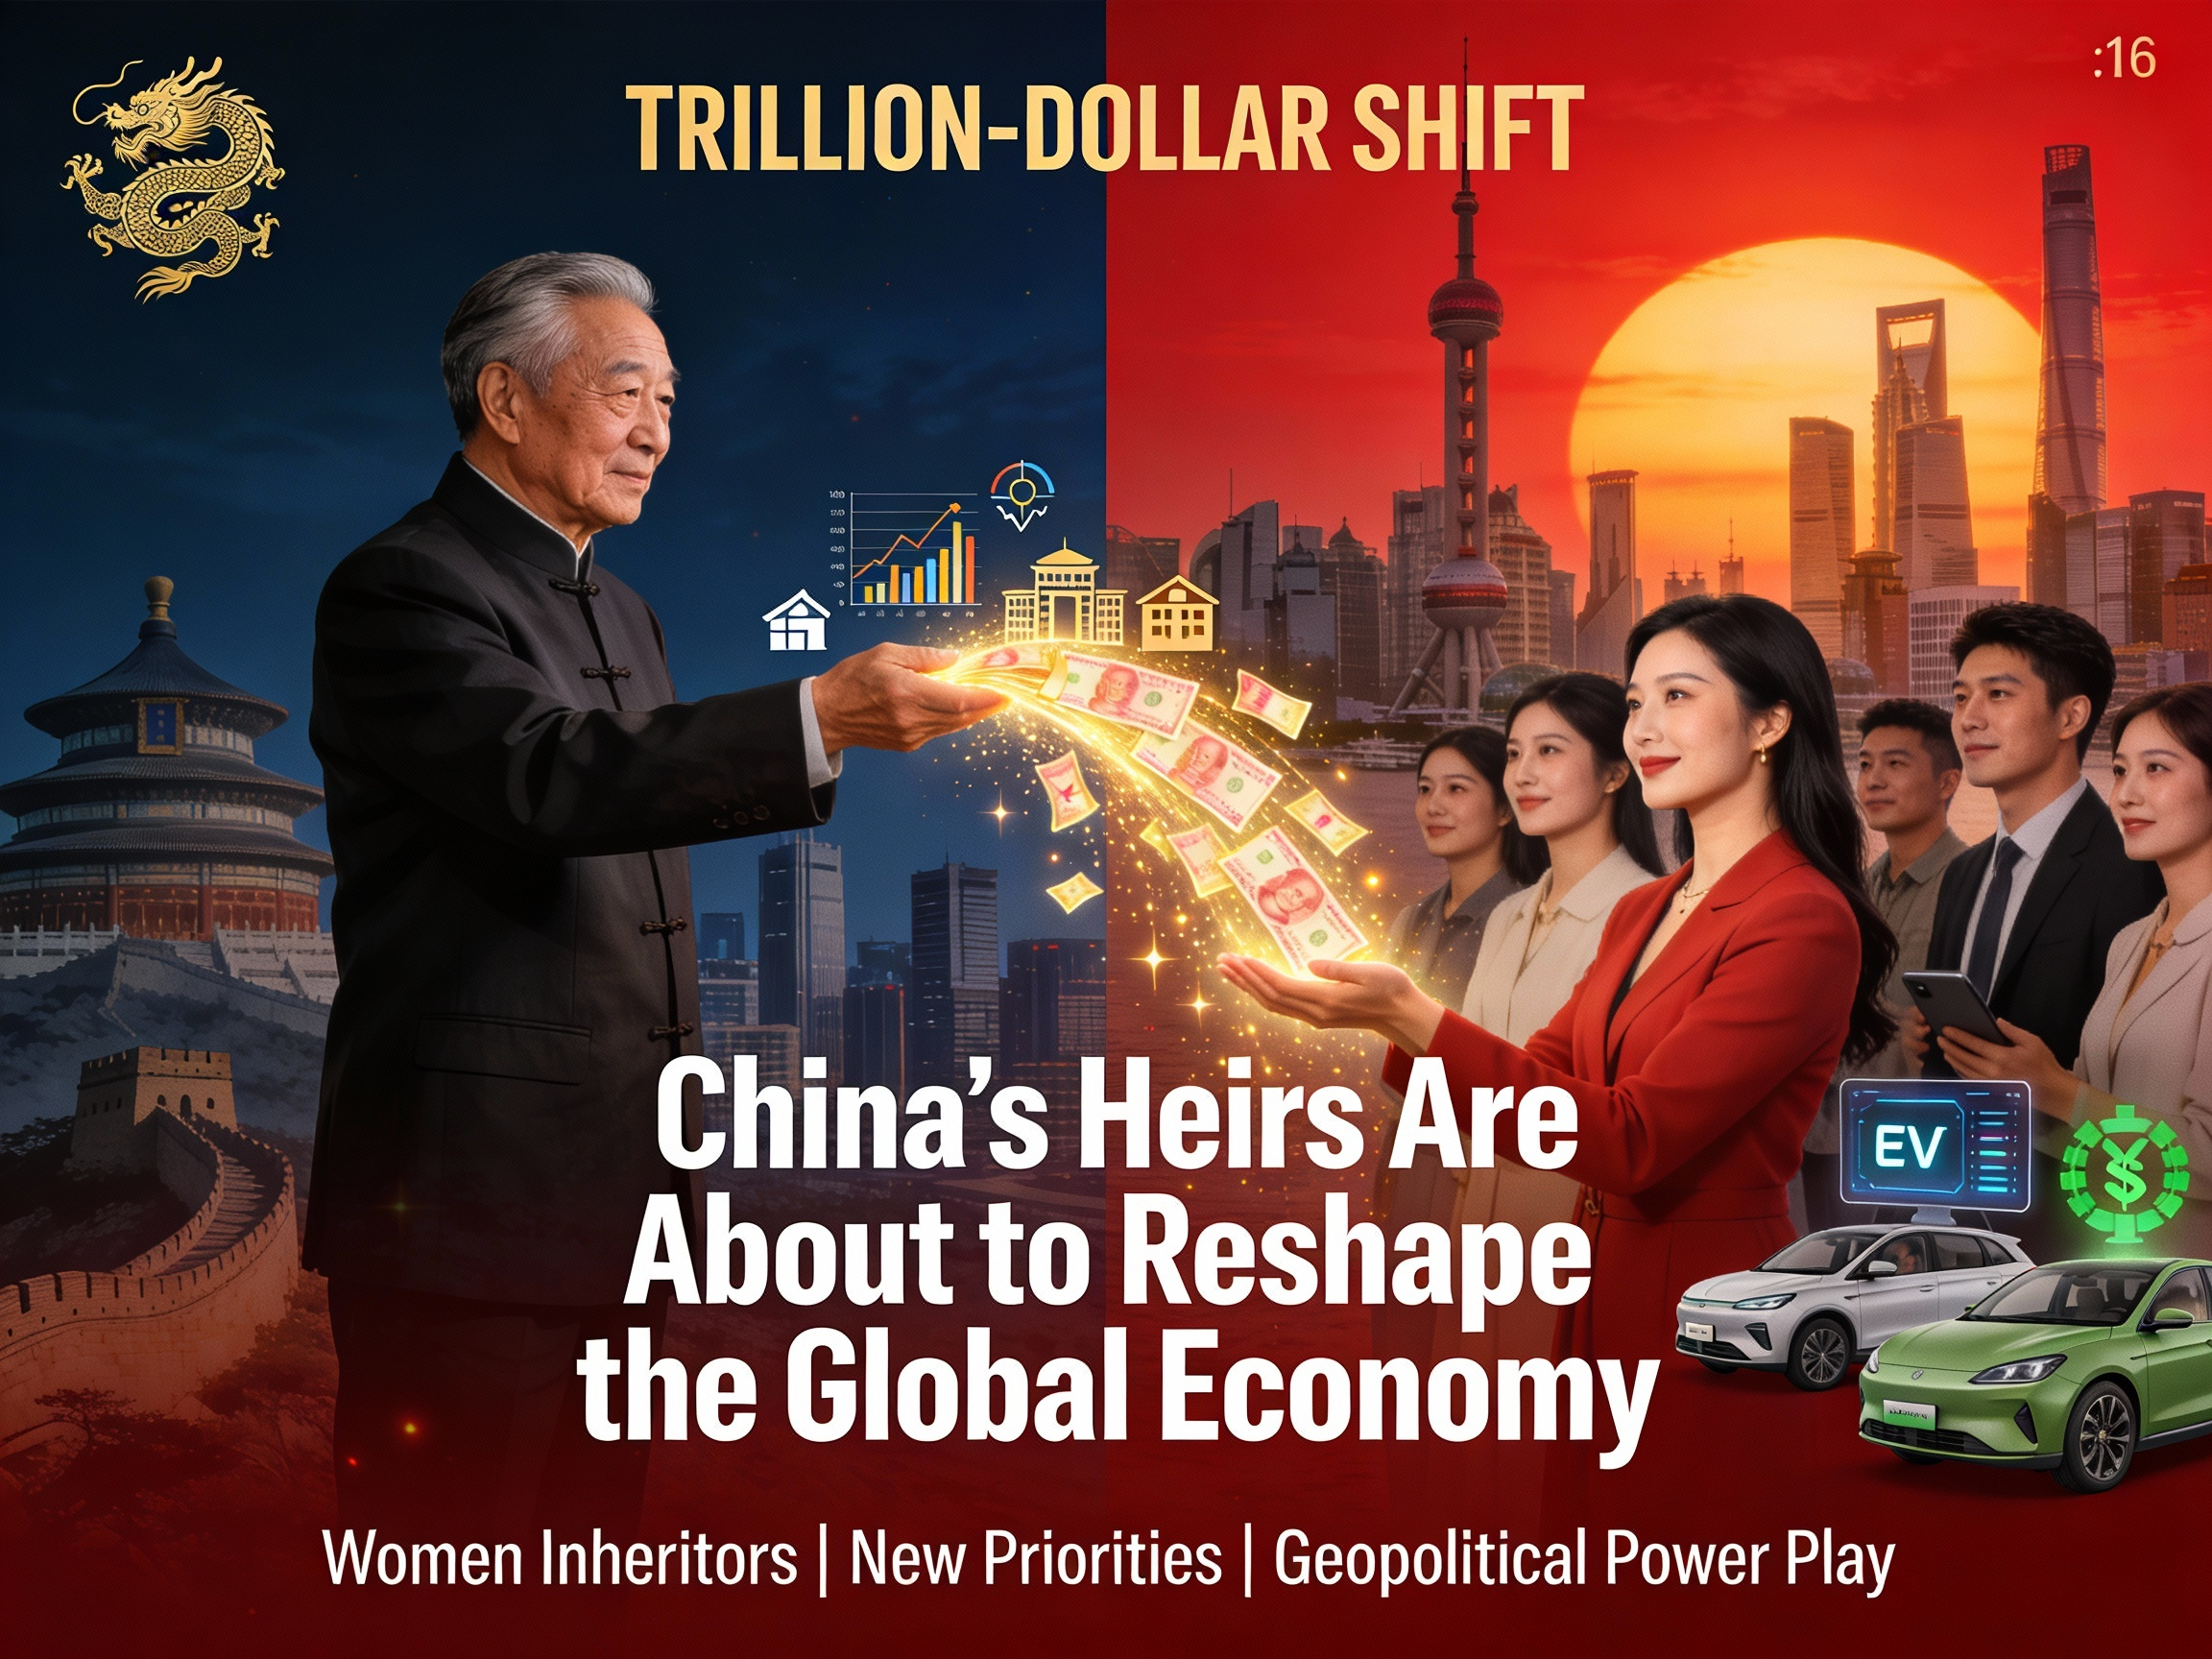
In the hushed private banking suites of Hong Kong and Singapore, a seismic shift is underway. Family patriarchs who built empires from rubble in the decades following China’s economic reforms now face an inescapable reality: their heirs—globally educated, digitally native, and values-driven—are preparing to inherit the largest concentration of private wealth in human history. This transition will do more than shuffle assets between generations. It will fundamentally recalibrate how capital flows through the world’s second-largest economy, reshape consumption patterns from property to experiences, and accelerate an eastward tilt in global financial power that began quietly but now moves with tectonic force.
The generational wealth transfer in China represents far more than inheritance planning. It is the economic inflection point where demographic destiny meets accumulated prosperity, where women inheritors will command unprecedented financial influence, and where the fraying social contract around property wealth collides with the imperatives of a consumption-driven future. The implications span geopolitics, fiscal sustainability, market architecture, and the lived reality of hundreds of millions of Chinese families navigating the most rapid aging process any major economy has ever experienced.
The Scale: Beyond Previous Estimates
Global wealth transfer projections have escalated dramatically. Cerulli Associates estimates that $124 trillion will change hands worldwide by 2048, surpassing total global GDP. UBS’s Global Wealth Report 2025 refined these figures, projecting over $83 trillion in transfers over the next 20–25 years, with $74 trillion moving between generations and $9 trillion transferring laterally between spouses.
For China specifically, the numbers have evolved beyond the 2023 Hurun estimate of $11.8 trillion over 30 years. UBS now projects mainland China will see more than $5 trillion in intergenerational wealth movement over the next two decades—a figure likely conservative given China’s billionaire population expanded by over 380 individuals daily in 2024. When combined with Oliver Wyman’s estimate that $2.7 trillion will transfer across Asia-Pacific by 2030, with Global Chinese families representing a substantial portion, the true scale approaches $6–7 trillion for Greater China through 2030 alone.
This wealth concentration is staggering. China’s projected transfers approach 30–35% of its current nominal GDP, creating both opportunity and peril. The wealth is highly concentrated: research indicates the top 1% of Chinese households control approximately one-third of the nation’s private wealth, five times more than the bottom 50% combined. How this capital reallocates will determine whether China navigates its demographic transition with economic resilience or faces a corrosive wealth effect that deepens consumption malaise.

The Demographic Imperative: Aging at Unprecedented Speed
China is experiencing the most compressed aging trajectory of any major economy in modern history. United Nations and World Bank projections show the population aged 65 and above doubling from 172 million (12.0%) in 2020 to 366 million (26.0%) by 2050. Some forecasts push this to 30% or higher, approaching Japan’s current super-aged society status but at a far earlier stage of per capita income development.
The dependency mathematics are brutal. China’s old-age dependency ratio—the number of retirees per working-age adult—will surge from approximately 0.13 in 2015 to 0.47–0.50 by 2050, mirroring the United Kingdom’s current burden. By 2050, China will transition from eight workers per retiree today to just two, straining pension systems, healthcare infrastructure, and family support networks simultaneously.
Unlike Western economies that grew wealthy before aging, China confronts what analysts term “growing old before growing rich.” China’s 65+ population is projected to reach 437 million by 2051, representing 31% of the total population—the largest elderly cohort on Earth. This creates fiscal pressures demanding over 10 million annual pension claimants by current trajectories, even as the working-age population contracts by an estimated 125 million between 2020 and 2050.
The demographic crisis is no longer theoretical. China’s population declined by 2.08 million in 2023, with the death rate reaching its highest level since 1974. The total fertility rate collapsed to 1.09 in 2022, well below replacement. Life expectancy, meanwhile, climbed to 77.5 years and is expected to reach 80 by 2050, with women averaging 88 years. These twin forces—collapsing births and extended longevity—create the conditions for history’s largest intergenerational asset transfer within a society still building its social safety net.
Property’s Wealth Effect: From Cornerstone to Constraint
For two decades, residential property served as China’s primary wealth accumulation vehicle. Urban households hold 70% of their assets in real estate, making housing the foundation of middle-class prosperity. Between 2010 and 2020, property prices in China’s top 70 cities surged nearly 60%, minting millionaires and cementing the conviction that real estate only appreciates.
Since 2021, that narrative has shattered. Housing prices have declined year-over-year for over four years, falling 3.8% in 2025 with forecasts projecting a further 0.5% drop in 2026 before modest stabilization in 2027. The property downturn has erased trillions in perceived wealth. Developers from Evergrande to Country Garden to Vanke—once symbols of unstoppable growth—now face distressed debt restructuring. In 2025, real estate investment fell 14.7%, new home sales dropped 8%, and the sector’s inventory-to-sales ratio reached 27.4 months in major cities, nearly double the healthy market threshold.
The negative wealth effect is profound. Households feel poorer, save more, and consume less. Over the past five years, household bank deposits nearly doubled to 160 trillion yuan ($22 trillion) by mid-2025—a defensive posture reflecting shattered confidence. Retail sales growth stagnated to barely 1% year-over-year by late 2025, with consumption contributing an estimated 1.7 percentage points to GDP growth, down from historical averages above 3 percentage points.
This creates a paradox for wealth transfer. Older generations hold substantial real estate assets acquired at lower valuations, but declining prices mean the inherited property wealth will be less valuable than anticipated. Meanwhile, younger cohorts who cannot afford today’s prices despite declines face reduced intergenerational support, as parents’ wealth is trapped in illiquid, depreciating assets. The property crisis doesn’t just constrain consumption today—it diminishes the wealth being transferred tomorrow.
Women Inheritors: The Silent Revolution in Capital Control
Perhaps no dimension of China’s generational wealth transfer has received less attention—or carries more transformative potential—than the shift of assets to women. Globally, Bank of America research estimates that women will receive approximately 70% of the $124 trillion great wealth transfer, with $47 trillion going directly to younger female heirs and $54 trillion passing to surviving spouses (95% of whom are women, given women’s longer life expectancy).
In China, this dynamic is amplified by cultural evolution and longevity gaps. Chinese women now live an average of 6–8 years longer than men, meaning widows will control substantial assets for extended periods before passing them to children. UBS highlights that approximately $9 trillion globally will move “sideways” to female spouses before generational transfer, reshaping who controls family capital.
Yet Chinese women historically faced systematic disadvantages in asset accumulation. Research shows only 37.9% of Chinese women own housing property (including co-ownership), compared to 67.1% of men. Among married individuals, just 13.2% of women hold property titles solely, versus 51.7% of married men. Sons receive more intergenerational transfers for housing than daughters, perpetuating gender wealth gaps.
The wealth transfer presents an opportunity to rebalance these inequities. Evidence from Next Generation wealth studies in Asia suggests younger Asian female inheritors prioritize impact investing, ESG-focused allocations, and portfolio diversification away from real estate toward equities and alternatives at higher rates than male counterparts or previous generations. Female wealth management clients demonstrate less emotional volatility, greater research diligence, and longer holding periods—traits that could channel inherited capital toward productive investment rather than speculative churning.
If Chinese women gain majority control over family wealth through inheritance and survivorship, investment patterns will shift toward healthcare, education, sustainability, and consumer services—sectors aligned with longer-term value creation. This contrasts with the property-speculation and heavy-industry bias that characterized first-generation male wealth builders. The gender dimension of China’s wealth transfer may prove as economically consequential as the generational one.
Fiscal Pressures and the Pension Crisis
China’s implicit social contract is fraying. For decades, families bore primary responsibility for elderly care, supported by high savings rates and multigenerational households. That model is collapsing. The one-child policy (1979–2015) means today’s elderly have five to six surviving children on average, but younger cohorts born in the late 1950s–1960s have fewer than two children. By 2050, many elderly will lack familial caregivers entirely.
Pension coverage remains incomplete. While urban workers enjoy basic pension schemes, rural residents and informal workers face gaps. The system runs deficits in multiple provinces, requiring central government transfers. As the dependency ratio surges, pension obligations will consume escalating shares of government budgets. Projections suggest pension liabilities could reach 53% of the population by 2050, an unsustainable burden without reform.
Healthcare costs compound the problem. China has 10 million citizens with Alzheimer’s and related dementias, a figure expected to approach 40 million by 2050. The prevalence of chronic diseases—cardiovascular conditions, cancer, diabetes—is rising as the population ages. An estimated 108–136 million Chinese lived with disabilities in 2020, projected to exceed 170 million by 2030, with over 70% being elderly by 2050.
The wealth transfer intersects these fiscal pressures in two ways. First, if inherited wealth enables families to self-fund elderly care, it reduces state burdens. Second, taxation of wealth transfers could provide revenue for social programs—though China currently levies no inheritance or gift taxes. The policy choice looms: allow dynastic wealth accumulation, or implement progressive transfer taxation to fund public services. Either path reshapes economic outcomes profoundly.
Investment Reallocation: From Concrete to Innovation
The property crisis is forcing a capital reallocation that the wealth transfer will accelerate. With real estate no longer a reliable store of value, Chinese households are diversifying. Despite the downturn, household savings of 160 trillion yuan provide fuel for new investment. Currently, only 5% of household wealth is allocated to equities, compared to 60% in real estate—leaving vast room for portfolio rebalancing.
Government policy encourages this shift. China’s onshore bond issuance grew from $17.2 trillion in 2020 to $24.1 trillion in 2024, absorbing domestic savings to fund R&D (up 8.9% year-over-year in 2024) and industrial subsidies. Retail investors drive 90% of stock market trades, and AI-led optimism fueled equity market rallies in 2025, redirecting household capital toward technology and innovation.
Next-generation inheritors amplify this trend. Surveys show 61% of Millennial and Gen Z high-net-worth individuals are willing to invest in high-growth niche markets, including private equity, cryptocurrencies, and alternative assets. By January 2025, Asian HNWIs held 15% of portfolios in alternatives—substantially higher than previous generations. Young Chinese inheritors prioritize digital efficiency, exclusive investments, and ESG impact, not legacy real estate empires.
This reallocation matters geopolitically. If Chinese capital flows toward domestic innovation, green technology, and healthcare rather than overseas property or dollar-denominated assets, it reinforces economic self-reliance and the “dual circulation” strategy. Conversely, if wealthy families diversify offshore—through Hong Kong family offices, Singapore trusts, or Western equities—it represents capital flight that undermines Beijing’s policy objectives.
Geopolitical Implications: The Eastward Tilt Accelerates
China’s wealth transfer does not occur in isolation. It coincides with a broader shift in global wealth concentration. UBS reports that the US and China jointly account for over half of all personal wealth globally. In 2024, China added more than 380 new millionaires daily, trailing only the US (~1,000 daily). By 2029, UBS projects 5.34 million new dollar millionaires globally, with the majority concentrated in the US and China.
Asia-Pacific’s share of global private wealth climbed from 6% in 2000 to 21% today, with projections reaching 25% by 2029 ($99 trillion). Within Asia, China remains the anchor. Hong Kong and Singapore have emerged as wealth management hubs, with 80% of capital inflows originating within Asia, signaling the region is no longer merely participating in global finance—it is driving it.
The geopolitical implications are stark. As Chinese capital remains concentrated in Asia, Western financial institutions lose influence. Dollar hegemony faces subtle erosion as Asian wealth managers, family offices, and UHNW individuals transact increasingly in yuan, Hong Kong dollars, and regional currencies. Trade flows follow capital flows: wealthy Asian inheritors invest in regional supply chains, technology ecosystems, and consumption markets, accelerating economic integration independent of Western-led globalization.
The wealth transfer also intersects US-China strategic competition. Technology transfers, intellectual property, and corporate control hinge on who owns equity stakes. If Chinese inheritors diversify into Western tech, real estate, and infrastructure, it raises national security concerns. Conversely, if Western investors are excluded from Chinese family enterprises during succession, it fragments global markets. The great wealth transfer is not merely economic—it is a contest for future geopolitical leverage.
The Next Generation: Values, Governance, and Succession Challenges
Family business research reveals deep generational contrasts in Asia. First-generation Chinese entrepreneurs—often China-based, control-oriented, and legacy-focused—built fortunes through relentless execution in manufacturing, real estate, and export industries. Their successors, by contrast, are globally educated, culturally agile, and drawn to impact investing, philanthropy, and flexible governance.
The succession gap is real. Asia Generational Wealth Report 2025 found 72% of founders see children as likely successors, yet 24% believe successors are underprepared. Diverging aspirations complicate transitions: NextGen prioritizes starting ventures and social impact over preserving family businesses. Without careful governance, succession failures could destroy enterprise value, disrupt employment, and fragment wealth.
China’s legal infrastructure for wealth transfer remains underdeveloped. The country has no inheritance or gift taxes, creating planning uncertainty if such levies are introduced. Family trusts, once rare, are expanding but face regulatory ambiguity. In 2025, Shanghai and Beijing introduced real estate trust registrations, allowing property transfers into trusts for estate planning—a breakthrough, but one limited to pilot cities.
Successful wealth transfers require not just legal structures but also family communication. Yet research shows fewer than 25% of families globally discuss succession openly, and over 38% of women avoid these conversations entirely. In China, where filial piety and hierarchy traditionally govern family dynamics, frank discussions about mortality, asset division, and successor capability remain culturally fraught. The result: avoidable disputes, suboptimal succession, and value destruction.
Market Implications: Consumption, Credit, and Growth
China’s wealth transfer will shape macroeconomic trajectories through consumption, credit demand, and investment priorities. If inherited wealth boosts household confidence, consumption could recover from its current doldrums. Morgan Stanley economists argue that halting property market declines is “crucial to mitigate the negative wealth effect on household consumption,” and that “restoring confidence in this key asset class will be instrumental in unlocking spending power across the economy.”
Yet the timing is uncertain. Even if property prices stabilize in late 2026 or 2027, consumer sentiment recovers slowly. Many households prioritize debt repayment and savings over consumption. Younger buyers face job insecurity and modest income growth, opting for rentals over purchases. Demand remains reasonably strong among first-time buyers and families seeking school-district housing, but large-scale investment appetite for new residential construction is subdued.
The credit channel also matters. If wealth transfers enable heirs to pay down debt, household leverage declines, strengthening balance sheets but reducing credit-fueled growth. Alternatively, if heirs borrow against inherited assets to fund consumption or investment, it extends the credit cycle. China’s household bad loan ratio reached 1.33% in the first half of 2025, exceeding the corporate ratio for the first time—a warning signal amid ongoing property and labor market pressures.
For policymakers, the wealth transfer represents both opportunity and risk. If managed well—through inheritance taxation that funds social programs, governance frameworks that enable smooth succession, and policies encouraging productive investment—it could support sustainable growth. If mismanaged—allowing dynastic concentration, capital flight, or succession disputes—it exacerbates inequality, undermines social cohesion, and slows economic dynamism.
Conclusion: A Crossroads for China’s Economic Future
China’s generational wealth transfer is not merely a demographic footnote. It is the economic event that will define the next two decades. The confluence of the world’s largest elderly population, the fastest aging process any major economy has experienced, and the most compressed wealth accumulation in modern history creates conditions without historical precedent.
The outcomes are not predetermined. If property markets stabilize and inherited wealth channels toward consumption, China could sustain 4–5% GDP growth through the 2030s, navigating the middle-income trap. If women inheritors allocate capital toward innovation, sustainability, and services, China’s economic structure diversifies beyond manufacturing and real estate. If family businesses transition smoothly to prepared successors, enterprise value compounds across generations, supporting employment and tax revenues.
Conversely, if property wealth evaporates, consumption stagnates, and fiscal burdens overwhelm government capacity, China risks Japan-style secular stagnation—or worse, given its earlier stage of development. If dynastic wealth concentrates without redistribution, inequality ignites social tensions. If capital flees offshore, Beijing’s policy autonomy erodes.
For global markets, the implications are profound. The shift of trillions in private wealth from aging entrepreneurs to younger, female, globally integrated inheritors will reshape capital flows, trade patterns, and geopolitical alignments. The eastward tilt of economic power, already underway, will accelerate. Investors, policymakers, and strategists who understand this transition will position themselves for the opportunities it creates. Those who ignore it will be blindsided.
China is at a crossroads. The great wealth transfer will determine which path it takes…..
Discover more from The Economy
Subscribe to get the latest posts sent to your email.


The US is imposing 10–12.5% tariffs on 60 countries over forced-labour enforcement gaps. Here’s what it means for Canada, Pakistan, and global sourcing.
Most tariff coverage in 2026 has focused on headline-grabbing bilateral fights — Section 232 metals duties, the US-Canada CUSMA review, reciprocal tariff threats. But a quieter measure moving through the USTR process may end up touching more of global trade than any single country-specific tariff: a forced-labour enforcement tariff applied not to a handful of adversaries, but to 60 economies accounting for 99% of US imports.
In mid-2026, the US Trade Representative proposed tariffs of 10% to 12.5% on imports from 60 economies — covering roughly 99% of US imports — after finding these countries had not adequately enforced bans on forced-labour goods. Countries with partial enforcement commitments face the lower 10% rate; the rest face 12.5%, with a special mechanism for apparel and textiles.
What the rule actually does
The USTR’s findings state that these 60 economies have failed to adequately prohibit or enforce bans on goods made with forced labour, which the agency frames as a source of unfair competition against countries that do enforce such bans. The proposed structure is two-tiered: a 10% tariff for countries that already have some form of forced-labour import prohibition or have committed to implementing one, and a 12.5% tariff for the remaining countries. A separate mechanism would allow limited apparel and textile imports at reduced rates, softening the blow for garment-dependent exporters.
Canada is on the list despite being a treaty partner under CUSMA — a reminder that forced-labour enforcement gaps are being treated as a distinct trade-policy lever, separate from tariff and quota negotiations under existing free-trade agreements.
Why this is the underreported story
Coverage so far has treated this as a compliance footnote inside broader tariff news. It deserves more attention for three reasons:
- Scale: unlike sector tariffs on steel or autos, this rule touches nearly the entire US import base at once, which means the aggregate cost pass-through to US consumers could exceed any single sector-specific measure.
- Enforcement burden shifts downstream: exporting countries — including major garment and electronics suppliers in Asia — will need to demonstrate active supply-chain auditing, not just legal prohibitions on paper, to qualify for the lower rate.
- Leverage point beyond trade: it gives Washington a tool to press human-rights and labour-standards issues inside what looks, on the surface, like a routine tariff schedule.
What exporters and sourcing teams should watch
- Whether their country lands in the 10% or 12.5% tier once USTR finalises findings after the July 2026 comment period
- Documentation requirements for the textile/apparel carve-out
- Whether affected governments respond with formal labour-enforcement commitments to shift tiers before the rule takes effect.
Discover more from The Economy
Subscribe to get the latest posts sent to your email.
Banks
Pakistan’s Most Reliable Export Is Its People: Remittances Hit $41.6 Billion, Overtaking Total Exports
Introduction
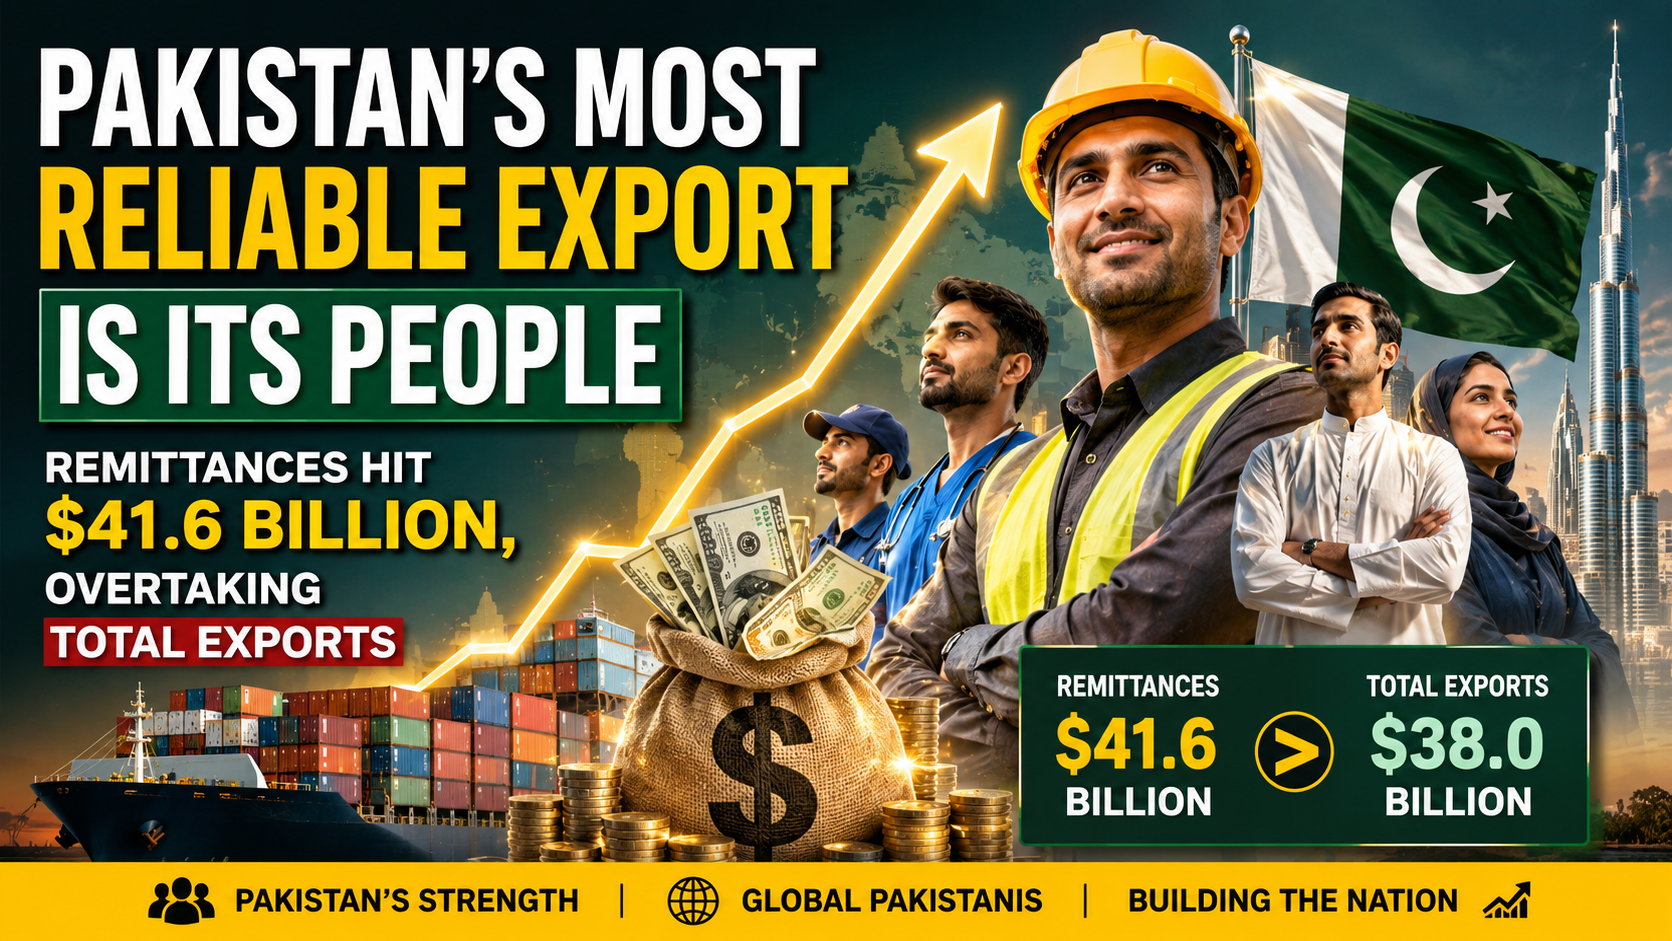
For the first time in the country’s history, money sent home by Pakistan’s overseas workers has exceeded the value of everything Pakistan actually sells abroad. Remittances hit a record $41.6 billion in the fiscal year ending June 30, 2026, according to State Bank of Pakistan data — surpassing total merchandise exports for the same period and cementing a structural shift that economists are increasingly uneasy about (VOI World/State Bank of Pakistan).
The Numbers Behind the Milestone
Remittance inflows rose 8.6% year-on-year in FY26, up from $38.3 billion in FY25 (VOI World). Some reporting puts the full 11-month figure even higher at $38 billion before the final month was tallied, with May 2026 alone contributing $4.25 billion — an amount roughly equal to what the entire country spends on imports in a single month (Express Tribune). A separate Express Tribune report puts the full FY26 total even higher, at $41.58 billion, an increase of nearly $3.29 billion over the prior year, delivered “without structured educational, training or welfare support” for the overseas workforce generating it (Express Tribune — Remittances Without Structured Support).
Saudi Arabia remained the single largest source of remittances in June 2026 at $829.6 million, followed by the UAE ($792.3 million), the United Kingdom ($514.9 million) and the United States ($296.8 million), with Italy and Oman each contributing more than $100 million (VOI World). That geographic concentration matters: a substantial share of Pakistan’s remittance base originates from the Gulf, leaving the country’s external account exposed to labor market reforms, economic cycles and geopolitical developments concentrated in a single, currently volatile region (Business Recorder Editorial).
Exports Have Been Stuck for Years
The remittance surge stands in sharp contrast to Pakistan’s export performance, which has shown little sustained dynamism despite years of concessional financing, preferential tariff regimes and subsidized energy for exporters (Business Recorder Editorial). The textile sector — long considered the backbone of Pakistan’s export economy — has been stuck in a $15–18 billion annual range for years, even as a handful of forward-thinking textile groups have managed to grow exports and diversify product lines under the exact same operating conditions others cite as prohibitive (Express Tribune). Separately reported nine-month data for the fiscal year showed exports contracting 5.8% to $23.3 billion even as imports rose nearly 8% to $46.8 billion, widening the trade gap further (Minute Mirror).
Over the three fiscal years from 2023 to 2025, Pakistan received $95.8 billion in remittances compared with $91 billion in merchandise exports — a gap that reflects, according to Business Recorder analysis, a deliberate policy orientation that has effectively institutionalized remittances as the default tool for stabilizing the current account rather than addressing the underlying export weakness (Business Recorder Opinion).
The Dutch Disease Warning
Independent economists have begun explicitly framing this pattern as a precursor to Dutch disease — the phenomenon where a large, easy source of foreign currency inflow reduces the pressure and incentive to build a competitive tradeable export sector (Business Recorder Opinion). The policy dimension is not incidental: under IMF program conditions, a long-standing subsidy that had encouraged banks to actively mobilize remittance transfers was withdrawn in the 2026 Budget, contributing to a temporary slowdown in inflows during the early months of the fiscal year before the government released Rs30 billion from its contingency fund to help revive momentum (Business Recorder Opinion).
A Business Recorder editorial published in July 2026 was blunt about the implication: Pakistan’s overseas workers have effectively become the country’s “most reliable export,” with its own people functioning as its largest export commodity — a framing the editorial explicitly calls an unsustainable foundation for long-term development strategy (Business Recorder Editorial).
The Silver Linings
The remittance boom has provided genuine macroeconomic stabilization. Total liquid foreign reserves crossed $23.98 billion as of early July 2026, including $18.47 billion held by the State Bank of Pakistan itself, with the rupee holding relatively steady around Rs278 per dollar in the interbank market (Express Tribune — Remittances Without Structured Support). Inflation has also been easing, and large-scale manufacturing showed signs of recovery with 5.9% growth in earlier-reported data, while agricultural lending rose 14.4% during July–February, extending credit access to farmers (Minute Mirror). Separately, Pakistan has reportedly repaid roughly Rs4,722 billion in debt ahead of schedule and posted a historic milestone in IT sector exports, suggesting pockets of genuine structural improvement exist alongside the broader export stagnation (Radio Pakistan).
Why This Matters Beyond Pakistan
Pakistan’s experience is a useful case study for other remittance-dependent emerging economies navigating IMF program conditions. The core tension — using a reliable, low-effort capital inflow to paper over a harder structural problem in the tradeable goods sector — is not unique to Pakistan, but few economies illustrate the scale of the imbalance as starkly as a country where remittances now formally exceed total exports.
Key Takeaways
- Pakistan’s FY26 remittances hit a record $41.6 billion, surpassing total merchandise exports for the first time in the country’s history.
- Saudi Arabia and the UAE remain the largest single sources, concentrating external account risk in the Gulf region.
- Textile exports have been stuck between $15–18 billion annually for years despite sustained government support.
- Economists are increasingly framing the remittance-export imbalance as a Dutch disease risk rather than a stabilization success story.
- Reserves have strengthened to nearly $24 billion and the rupee has stabilized, but the underlying export competitiveness problem remains unresolved.
Sources: VOI World, Express Tribune — Remittances Dwarf Exports, Express Tribune — Remittances Without Structured Support, Business Recorder Opinion, Business Recorder Editorial, Minute Mirror, Radio Pakistan
Discover more from The Economy
Subscribe to get the latest posts sent to your email.
AI
Anthropic Offers Up to $600,000 Salary for Critical IPO Role as AI Giant Prepares for Wall Street Debut

As anticipation builds around what could become one of the largest technology listings in recent history, artificial intelligence company Anthropic is offering an eye-catching base salary of up to $600,000 for a key investor relations position, underscoring how seriously the company is preparing for its expected initial public offering (IPO).
The San Francisco-based AI developer, best known for its Claude family of AI models, has posted a vacancy for a Director of Investor Relations with a base compensation ranging from $425,000 to $600,000, making it one of the most strategically important hires ahead of its anticipated public market debut. According to a report by Business Insider, the company is expected to pursue an IPO as early as fall 2026, following a surge in valuation and extraordinary revenue growth.
A Strategic Hire Ahead of a Landmark IPO
The investor relations director will be responsible for shaping Anthropic’s investment narrative, maintaining relationships with institutional investors, and helping Wall Street understand the company’s long-term strategy and financial outlook.
According to the job description, the successful candidate will:
- Develop Anthropic’s investment story for public markets.
- Serve as a primary liaison between executive leadership and investors.
- Analyze AI industry developments and communicate their financial implications.
- Support earnings communications, investor presentations, and regulatory disclosures.
- Work closely with the company’s newly appointed Head of Investor Relations.
The position reports into Kenneth Dorell, who joined Anthropic earlier this year after previously leading investor relations at Meta. His appointment reflects the company’s broader effort to build an experienced leadership team capable of navigating public market expectations.
Why Investor Relations Matters More Than Ever
While investor relations roles are common among public companies, they become especially significant during the transition from private to public ownership.
For Anthropic, the challenge extends beyond explaining quarterly financial results. The company must convince investors that its massive investments in AI research, computing infrastructure, and talent acquisition can translate into sustainable long-term growth.
Unlike many traditional software companies, Anthropic operates as a public benefit corporation, meaning it is legally committed to balancing shareholder returns with the responsible development of advanced artificial intelligence. The company’s official mission emphasizes building reliable, interpretable, and safe AI systems for the long-term benefit of society, according to the company’s website.
This dual mandate creates a unique communication challenge for investor relations executives, who must explain how commercial success aligns with responsible AI development.
AI Boom Drives Extraordinary Compensation
The offered salary highlights the increasingly fierce competition for executive talent across the AI industry.
Although a base salary of $600,000 is exceptional by conventional corporate standards, compensation at leading AI companies frequently includes stock awards, bonuses, and long-term incentives that can substantially increase total earnings.
Anthropic has become one of Silicon Valley’s fastest-growing companies, with demand for its enterprise AI products accelerating rapidly. The company’s coding assistant, Claude Code, has gained significant traction among software developers and businesses seeking AI-powered programming tools.
Recent reporting indicates that Anthropic’s annualized revenue has expanded dramatically as enterprise adoption of generative AI continues to accelerate, strengthening investor expectations ahead of a potential IPO.https://www.businessinsider.com/anthropic-ipo-hiring-investor-relations-director-2026-7
Preparing Wall Street for an Unconventional AI Company
Anthropic’s investor relations team faces a unique assignment.
Unlike mature technology companies with decades of operating history, frontier AI companies remain difficult to value because they invest billions of dollars annually in computing infrastructure, model training, and research talent while operating in a rapidly evolving competitive environment.
Potential investors will likely seek clarity on several key questions:
- Future profitability.
- Infrastructure spending.
- AI safety governance.
- Regulatory risks.
- Competitive positioning against OpenAI, Google, Meta, and xAI.
- Long-term monetization strategy.
The investor relations director will play a central role in translating these complex issues into a compelling investment thesis.
Strong Financial Momentum Strengthens IPO Expectations
Anthropic has emerged as one of the world’s most valuable privately held AI companies.
Backed by major investors including Amazon and Google, the company has attracted substantial funding over the past several years while rapidly expanding its enterprise customer base.
Its Claude models have become widely used for coding, research, enterprise automation, and business productivity, placing Anthropic among the strongest competitors to OpenAI.
The company’s remarkable financial momentum has fueled growing speculation that its IPO could become one of the defining public offerings of the AI era.
Competition for AI Talent Intensifies
The generous compensation package also reflects the broader battle for experienced executives across the artificial intelligence sector.
Companies developing frontier AI systems increasingly compete not only for elite researchers and engineers but also for specialists in finance, public markets, communications, and regulatory affairs.
As valuations continue climbing into the hundreds of billions of dollars, experienced executives capable of guiding companies through IPOs have become increasingly valuable.
Industry observers expect executive compensation across AI firms to remain elevated as competition intensifies.
The Bigger Picture
Anthropic’s decision to offer a base salary reaching $600,000 for an investor relations executive sends a clear signal that preparations for public markets are accelerating.
Beyond the headline salary, the recruitment reflects a broader transformation within the AI industry. As companies mature from venture-backed startups into global technology leaders, success increasingly depends not only on breakthrough research but also on convincing investors that enormous AI investments can produce sustainable long-term returns.
If Anthropic proceeds with its widely anticipated IPO, this investor relations hire could become one of the most influential behind-the-scenes roles in shaping how one of the world’s most valuable AI companies is introduced to public investors.
Sources
- Business Insider, Anthropic is offering a $600,000 salary for one of its most important IPO hires: https://www.businessinsider.com/anthropic-ipo-hiring-investor-relations-director-2026-7
- Anthropic, Official Company Website: https://www.anthropic.com/
Discover more from The Economy
Subscribe to get the latest posts sent to your email.

US Forced-Labour Tariffs on 60 Countries: The Hidden Trade Shock of 2026

Global Central Banks 2026: Fed, BoE and BoJ Decisions Could Reshape Markets

Gulf Capital Retreat From Pakistan 2026: UAE Loan Freeze & What It Means

Pakistan’s Most Reliable Export Is Its People: Remittances Hit $41.6 Billion, Overtaking Total Exports

Indonesia’s Confidence Problem: Record Investment, a Sinking Rupiah, and a Widening Credibility Gap

Down But Not Out: Inside the Slow Sinking of Russia’s War Economy

China’s Growth Slips to a Four-Year Low: Why Beijing Still Won’t Pull the Stimulus Trigger

The Johor-Singapore Corridor: How Malaysia Became Southeast Asia’s AI Infrastructure Powerhouse

Canada’s Economy ‘On Pause’: Inside the CUSMA Deadline That Passed Without a Deal

Dubai’s Millionaire Magnet: How the UAE Turned Middle East Turmoil Into a Capital Safe-Haven Boom

Britain’s Sixth Prime Minister in a Decade: What Starmer’s Exit Means for Gilts, Sterling and Your Portfolio

Anthropic Offers Up to $600,000 Salary for Critical IPO Role as AI Giant Prepares for Wall Street Debut

EU Readies Crisis Team for Potential China Rare Earths Stand-Off as Supply Chain Risks Mount

Singapore Weighs Hedge Fund Tax Cuts to Counter Hong Kong’s Growing Financial Challenge

Carry Trade Unwind 2026: How the Yen’s Snapback Triggered a Global Margin Call

AI Bubble Warning 2026: Why BIS, IMF and Bank of England Fear a Market Crash

BRICS De‑Dollarization Strategy Takes Shape with $15 Billion Local‑Currency Push

The AI Super Bubble Is Ready to Burst

Russia Bans Diesel Exports 2026: Global Fuel Market Impact Explained

Strait of Hormuz Blockade 2026: Oil Prices Surge 9% as US-Iran Conflict Reignites

Private Credit Warning: Most BDCs Turn Unprofitable in 2026, Reuters Finds

IMF Cuts Pakistan Growth Forecast, Raises Inflation to 8.4%

Bitcoin $150k Milestone Achieved as US Sovereign Crypto Pivot Looms
Gulf Capital Retreat From Pakistan 2026: UAE Loan Freeze & What It Means

India Economic Rise 2026: How the Subcontinent Toppled Japan

Strait of Hormuz 2026: Why Markets Still Don’t Trust It’s Open

Argentina Economy 2026: Milei’s Fiscal Surplus, Inflation Drop to 29%, and What Comes Next

China Housing Market Turnaround: White‑List Model Stabilises Prices
-

 Markets & Finance7 months ago
Top 15 Stocks for Investment in 2026 in PSX: Your Complete Guide to Pakistan’s Best Investment Opportunities
-

 Analysis5 months ago
Johor’s Investment Boom: The Hidden Costs Behind Malaysia’s Most Ambitious Economic Surge
-

 Analysis5 months ago
Top 10 Stocks for Investment in PSX for Quick Returns in 2026
-

 Analysis6 months ago
Brazil’s Rare Earth Race: US, EU, and China Compete for Critical Minerals as Tensions Rise
-

 Banks6 months ago
Best Investments in Pakistan 2026: Top 10 Low-Price Shares and Long-Term Picks for the PSX
-

 Investment7 months ago
Top 10 Mutual Fund Managers in Pakistan for Investment in 2026: A Comprehensive Guide for Optimal Returns
-

 Global Economy7 months ago
15 Most Lucrative Sectors for Investment in Pakistan: A 2025 Data-Driven Analysis
-

 Global Economy7 months ago
Pakistan’s Export Goldmine: 10 Game-Changing Markets Where Pakistani Businesses Are Winning Big in 2025