
Analysis
How Beijing’s Crackdown on EV Price Wars Is Reshaping China’s Auto Supply Chain in 2026

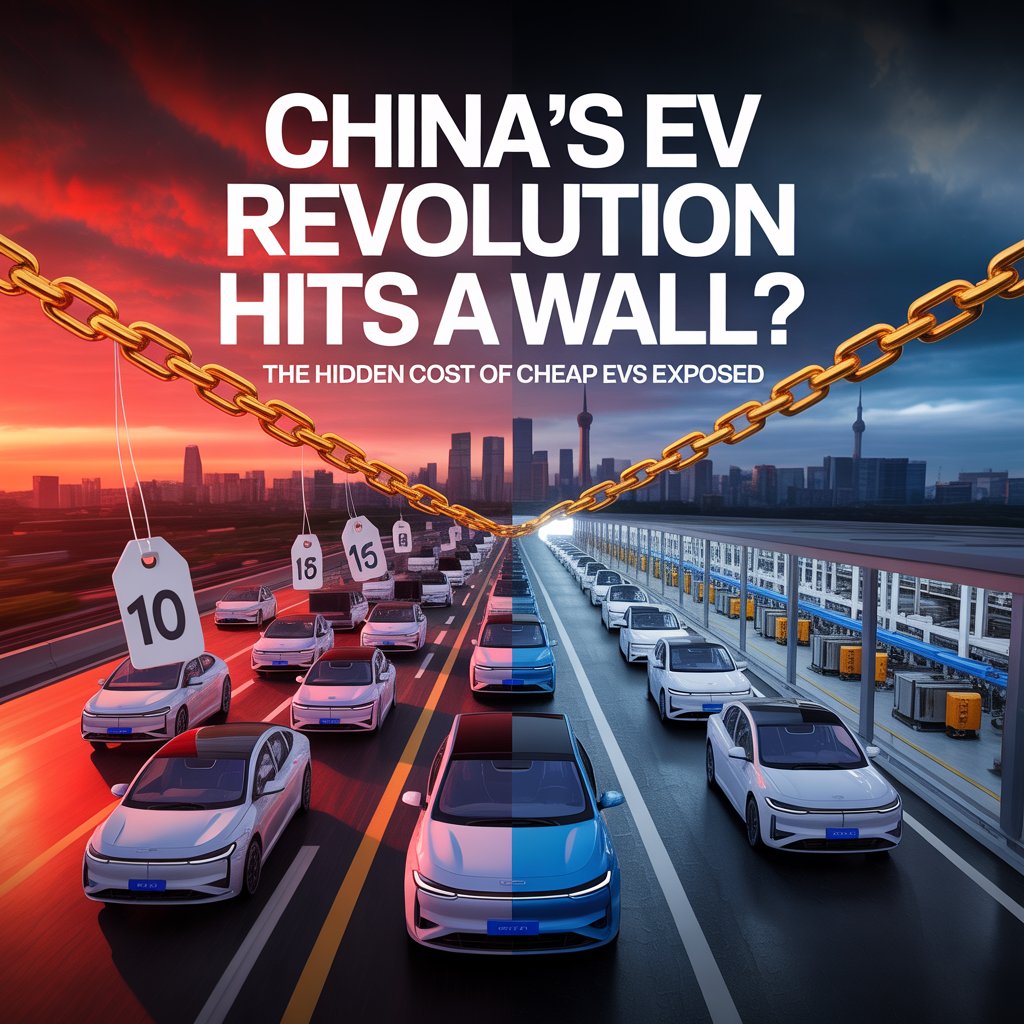
After three years of ruinous discounting that cost China’s car industry an estimated $68 billion, Beijing has drawn a hard line—forcing carmakers to pay suppliers within 60 days. The intervention is rewriting the economics of EV manufacturing, but the pain is far from over.
For years, China’s electric vehicle industry ran on a peculiar kind of shadow credit. Carmakers locked in price wars—slashing sticker prices month after month to outlast rivals and capture market share—financed the fight partly on the backs of their own suppliers. Payment terms that should have lasted 30 or 60 days stretched to 90, then 180, and eventually to nearly 300 days. Component makers, from battery cell producers to seat manufacturers, became involuntary lenders to an industry racing toward the bottom.
That arrangement has now been forcibly dismantled. Following a sweeping government directive in June 2025 mandating that automakers settle supplier invoices within 60 days, the China Association of Automobile Manufacturers (CAAM) confirmed in early 2026 that 17 assemblers it investigated had reduced average payment cycles to 54 days since the rule took effect—with four settling in under 50 days. It is a seismic operational shift for an industry that had normalized near-annual payment delays as a financial management tool.
The numbers behind this intervention are staggering. According to Nikkei Asia, China’s automotive sector collectively lost as much as $68 billion over the three-year price war from 2022 to 2024—a figure that underscores how profoundly irrational the competitive dynamics had become. Of the nearly 50 electric vehicle manufacturers operating on the mainland, only a handful have managed to turn a consistent profit. The rest have been burning capital in a war of attrition, gambling that their rivals will fold first.

The Anatomy of a 300-Day Payment Cycle
To understand why Beijing felt compelled to intervene so bluntly, it helps to understand exactly how the delayed-payment system functioned—and whom it served.
When a Chinese automaker extended its payment cycle to 300 days, it was, in effect, obtaining an interest-free revolving credit line from its entire supply chain. Funds that should have flowed to battery suppliers, steel fabricators, and electronics vendors were held in reserve and redeployed into research and development spending, marketing campaigns, or—critically—further price reductions. The carmakers avoided formal debt on their balance sheets while their suppliers absorbed the liquidity stress.
For suppliers, the consequences were severe. Companies running on thin margins could not easily access working capital to fund their own production without the payments owed to them. Some turned to expensive short-term borrowing. Others curtailed investment or began quietly rationing deliveries. A cash flow crisis was brewing beneath the surface of an industry that the outside world largely saw as a runaway success story.
“Without delayed payments to suppliers, they will not have sufficient cash on hand to sustain discount wars. The results showed government intervention worked—the automotive groups feared severe punishment if they failed to comply.”— Chen Jinzhu, CEO, Shanghai Mingliang Auto Service
Chen’s observation cuts to the heart of the intervention’s logic. The 60-day payment rule is not merely a cash-flow protection measure for suppliers. It is a structural brake on the price war itself. Without access to free supplier credit, carmakers must fund discounting from their own reserves or formal debt—a far more painful and transparent proposition. Beijing, in other words, has engineered a constraint on competitive behavior by attacking its financial scaffolding.
Beijing’s Broader Crackdown: The 60-Day Payment Rule in Context
The June 2025 directive did not emerge in isolation. It was the culmination of a years-long regulatory reckoning with the distortions produced by China’s EV boom. Beijing had watched domestic automakers sacrifice sustainable business models for market share, eroding the financial health of an industry it considers strategically vital—one it has invested hundreds of billions of dollars in subsidizing and cultivating over two decades.
Regulators had earlier attempted softer interventions. The National Development and Reform Commission and the Ministry of Industry and Information Technology both issued guidance urging “healthy competition” and discouraging predatory pricing. Industry bodies published voluntary pledges. None of it produced meaningful change. The June 2025 mandate, backed by the credible threat of regulatory consequences for non-compliance—including potential delisting from government procurement programs and financing channels—had the force that prior exhortations lacked.
CAAM, whose membership encompasses virtually every Chinese carmaker, declined to publish the names of the 17 companies it assessed in its early 2026 progress report, citing sensitivity. But analysts note that the list almost certainly includes several of China’s largest volume producers. The association said it would maintain ongoing monitoring of payment practices to ensure “healthy growth of the automotive sector.”
~$68 BillionEstimated cumulative losses across China’s auto industry during the three-year EV price war, 2022–2024, according to Nikkei Asia.
Impact on Suppliers and Profitability: Who Gains, Who Still Struggles
The shift to shorter payment cycles represents meaningful relief for the supply chain. Tier-1 and Tier-2 component suppliers—many of them small and medium-sized enterprises operating on single-digit margins—can now plan cash flows with greater predictability. The working capital they had effectively lent to assemblers can be redeployed into capital expenditure, headcount, and their own supplier relationships.
Yet the transition is not without its own disruptions. Carmakers that had relied on extended payables as a funding mechanism must now either draw down cash reserves, raise formal debt, or curtail investment programs. For companies already operating in the red, this is a meaningful additional squeeze.
| Metric | Pre-Crackdown (2022–2024) | Post-Mandate (2025–2026) |
|---|---|---|
| Average supplier payment cycle | ~300 days | ~54 days (CAAM data) |
| Fastest-paying assemblers | Not tracked/enforced | 4 companies under 50 days |
| EV makers turning a profit | Handful of ~50 builders | Marginal improvement expected; majority still loss-making |
| Cumulative industry loss | Est. $68 billion over 3 years | Losses continuing; pace expected to moderate |
| Regulator oversight | Voluntary guidance only | Mandatory compliance; CAAM monitoring ongoing |
BYD, China’s EV sales leader and the world’s largest electric vehicle manufacturer by volume, illustrates the paradox at the industry’s summit. While the company has posted record sales figures and expanded aggressively into Southeast Asia, Europe, and Latin America, it reported a quarterly loss in early 2026—a sobering signal that even the dominant player is not immune to the margin compression produced by years of discounting. Overseas revenue, while growing, has not yet offset the structural damage inflicted on domestic unit economics.
For smaller and mid-tier brands—companies like Leapmotor, Neta, and a cohort of names that rarely register outside of China—the situation is more acute. Several have curtailed production, restructured debt, or quietly suspended operations. The price war, perversely, appears to be achieving through attrition what no regulator explicitly ordered: consolidation. The question is whether it happens in an orderly fashion or through a wave of disorderly defaults.
China EV Supplier Cash Flow Crisis 2026: The Ripple Effects
The distress in China’s automotive supply chain does not stop at the factory gate. It radiates outward through a web of global dependencies that many Western manufacturers have only recently begun to map and stress-test.
China produces the majority of the world’s lithium-ion battery cells, cathode materials, and electric motor components. The companies supplying those inputs to Chinese automakers are, in many cases, the same companies supplying them to Tesla’s Shanghai Gigafactory, Volkswagen’s joint ventures, and a growing roster of international EV startups. When Chinese carmakers delayed payments for 300 days, the cash flow stress traveled upstream—compressing margins at battery material processors, rare earth refiners, and electronics manufacturers who collectively underpin global EV supply chains.
The normalization of payment terms reduces that systemic stress. But it introduces a different variable: if tighter working capital forces Chinese assemblers to curtail production or restructure their supplier relationships, global component availability and pricing could be affected in ways that are difficult to model from outside the ecosystem. Financial Times analysis has noted that Chinese carmakers’ price pledges to suppliers represent a structural shift in how the sector is financed—one with implications beyond China’s borders.
Trade Tensions and the Geopolitics of EV Dominance
Beijing’s intervention arrives at a moment of acute geopolitical friction over Chinese EV exports. The European Union imposed tariffs of up to 45% on Chinese electric vehicles in 2024, citing unfair state subsidies. The United States has maintained and in some cases extended its own tariff barriers. The argument in both capitals is that China’s EV industry is not competing on commercial terms—that subsidies, directed credit, and manipulated input costs have created a structural advantage that distorts global trade.
The 60-day payment mandate complicates that narrative in an interesting way. It is, unmistakably, a market-correcting intervention—one that forces Chinese carmakers to operate on more commercially rational terms, absorbing the cost of their competitive behavior rather than externalizing it onto suppliers. That is not the behavior of an industry designed purely for predatory export dumping. It is the behavior of a government trying to prevent an industrial sector from destroying itself.
Whether Western policymakers will adjust their reading of Chinese auto policy accordingly is another question. Trade cases move slowly, and political narratives about Chinese industrial policy are difficult to dislodge once embedded. But analysts at The Economist and elsewhere have flagged that the domestic regulatory tightening adds nuance to the simple “China subsidizes everything” framing that has dominated Western policy discourse.
EV Industry Profitability in China: A Long Road to Recovery
The fundamental arithmetic of China’s EV market remains challenging even with the payment rule in place. The country has somewhere north of 100 automobile manufacturers competing for a market in which consumer demand, while large, has been growing more slowly than production capacity. The inevitable result is oversupply, and oversupply means continued pressure on prices regardless of what regulators mandate about payment terms.
The more durable path to profitability runs through two channels: export growth and domestic consolidation. On exports, Chinese carmakers have made remarkable inroads in Southeast Asia, the Middle East, and parts of Latin America, where tariff barriers are lower and EV adoption curves are steeper. BYD’s international expansion, in particular, has been cited by Reuters as a strategic hedge against deteriorating domestic margins. But international revenue takes time to scale and carries its own costs—logistics, warranty, brand-building—that compress margins in the near term.
Consolidation, meanwhile, is proceeding—but haltingly. The Chinese government has historically been reluctant to allow state-linked manufacturers to fail, which keeps zombified competitors alive and extends the duration of price wars. Private-sector EV startups face less political protection but often more loyal investor bases, some with long time horizons funded by sovereign wealth or venture capital. The result is a market that moves toward rationalization more slowly than pure economics would dictate.
54 DaysAverage supplier payment cycle reported by CAAM’s 17 monitored assemblers since June 2025—down from approximately 300 days in the preceding three years.
What Comes Next: Compliance, Competition, and the New Rules of Chinese Auto
CAAM’s commitment to ongoing monitoring of payment practices signals that Beijing views the June 2025 directive not as a one-time intervention but as a new permanent feature of the regulatory landscape. Companies that revert to extended payment cycles—as competitive pressures inevitably tempt them to do—will face scrutiny, and potentially enforcement actions, in a way that was simply absent before.
This represents a maturation of China’s auto regulatory framework. For two decades, Beijing’s dominant posture toward the automotive sector was promotional: subsidize, support, and stay out of the way of commercial competition. The shift to active policing of competitive behavior reflects a recognition that the promotional phase produced a market structure—120-odd competing automakers, chronic overcapacity, ruinous price wars—that now threatens the long-term viability of the very industry it was designed to nurture.
For global investors, supply chain strategists, and trade policymakers watching from London, Tokyo, Detroit, and Brussels, the lesson is worth internalizing. China’s auto sector is not a static threat. It is a dynamic one, actively managed by a government willing to impose painful constraints on its own champions when the alternative is systemic fragility. The $68 billion lesson appears, at least partially, to have been learned.
Whether 54 days becomes 60, or 60 becomes 90 again the moment enforcement attention drifts, remains the open question. History suggests that in highly competitive industries, financial innovation has a way of reasserting itself. But for now, the suppliers are getting paid—and China’s automakers are learning to compete on terms closer to their own merits.
Discover more from The Economy
Subscribe to get the latest posts sent to your email.



Key Takeaways
- Rolex’s secondary market rose approximately 7.9% year-over-year as of 2026 (per WatchCharts data) — trailing Patek Philippe (+16.2%) and Tudor (+11.4%) but still outperforming Audemars Piguet (+3.4%).
- Rolex raised U.S. retail prices 4–9% in January 2026 (steel models ~5.6%, gold models ~8.7%), narrowing the historical gap between retail and pre-owned pricing.
- Not every model appreciates: steel sports references (Submariner, GMT-Master II, Daytona) have held value far better than two-tone or widely available dress references like the standard Datejust.
- The Lady-Datejust posted the sharpest 2026 gain among tracked collections — up 22.73%, from roughly $9,269 to $11,376 — driven by demand for smaller, “everyday luxury” watches.
- Gold’s rise past $2,400/oz has directly lifted the investment case for Rolex’s precious-metal references (Day-Date, Sky-Dweller, Yacht-Master).
The Model-by-Model Picture
| Category | 2026 Trend |
|---|---|
| Lady-Datejust | +22.73% (strongest performer among tracked collections) |
| Steel sports models (Submariner, GMT-Master II) | Held value well; corrected from 2022 peak but stabilized above retail |
| Daytona | Corrected from highs above $50,000 to the mid-$30,000s; still among the most sought-after references |
| Two-tone/widely available Datejust | Flat to negative — “holds value” is an overstatement for this category |
| Gold references (Day-Date, Sky-Dweller) | Lifted by gold’s rise above $2,400/oz |
Why the “Rolex Always Appreciates” Myth Is Fading
The pandemic-era boom pushed some references — the Daytona above all — to speculative highs disconnected from historical norms. Since the March 2022 peak, steel sports models have compressed meaningfully, and dealers who bought inventory near the top have in some cases faced 20–40% markdowns on liquidation. The lesson for 2026 buyers: Rolex as a category is not a monolith. Value retention depends heavily on specific reference, condition, and whether the piece comes with box and papers (“full set”).
What’s Actually Driving 2026 Strength
- Retail price increases raise the floor. When a new Submariner retails at $10,050 (up from $9,500), a pre-owned example at $11,000–$12,000 suddenly represents a smaller premium — narrowing the gap without secondary prices actually moving.
- Supply discipline remains Rolex’s core lever. The brand has never confirmed production numbers, and secondary-market premiums remain entirely a function of Rolex’s own manufacturing decisions — a risk factor as much as a support.
- Certified Pre-Owned rollout. Rolex’s now fully rolled-out CPO program has changed how buyers transact in the used market, adding a layer of brand-verified legitimacy that supports pricing.
The Case for Rolex as a Portfolio Diversifier
Financial advisors increasingly frame luxury watches not as a replacement for equities or bonds, but as a tangible, historically low-correlation diversifier — one that carries its own risks (illiquidity, condition-dependent pricing, no yield) but has demonstrated multi-decade resilience for specific references.
Is Rolex a good investment in 2026?
It depends heavily on the specific reference. Steel sports models like the Submariner and Daytona have held or grown in value; two-tone and widely available dress models generally have not. Overall, Rolex’s secondary market rose about 7.9% year-over-year in 2026, trailing Patek Philippe but ahead of Audemars Piguet.
Discover more from The Economy
Subscribe to get the latest posts sent to your email.

Navigating Mortgage and Loan Refinancing in a High-Yield Environment
Global public debt crossing critical thresholds has kept central bank policies volatile, resulting in fluctuating US Treasury yields throughout 2026. For homeowners and commercial property holders burdened by previous high-interest borrowing cycles, finding optimal refinance windows has become a high-stakes financial puzzle. Stalled disinflation and stubborn employment numbers mean rate cuts are incremental, requiring borrowers to act with precision.
Timing your mortgage or commercial loan refinance in this environment requires a deep understanding of yield curve movements and lender risk appetites.
Decoding 2026 Refinance Dynamics
The 10-Year Treasury Yield Benchmark
Mortgage rates continue to track closely with the 10-year US Treasury yield. When macroeconomic anxiety spikes debt issuance, yields rise, tightening consumer borrowing capacity. Savvy borrowers monitor weekly Treasury auctions to lock in rates during brief dip windows.
Hybrid ARMs and Alternative Structures
With fixed rates remaining elevated, 7/1 and 10/1 adjustable-rate mortgages (ARMs) have surged in popularity. These products offer lower initial monthly payments, giving borrowers breathing room until central bank easing cycles fully materialize.
| Loan Product | Current Rate Range | Best For | Key Risk Factor |
| 30-Year Fixed Mortgage | 6.2% – 6.8% | Long-term predictability | Higher initial monthly outlay |
| 7/1 Hybrid ARM | 5.5% – 5.9% | Short-term ownership / flipping | Rate reset risk after year 7 |
| Commercial Refinance | 7.0% – 8.2% | Corporate asset restructuring | Strict DSCR lender covenants |
Actionable Steps for Successful Refinancing
To maximize your chances of securing favorable refinance terms in a volatile market, follow a disciplined preparation strategy.
Boost Your Credit Score Immediately: Lenders in 2026 are applying stringent credit tiering; a 20-point increase can drop your APR by a crucial quarter-point.
Shop Regional Credit Unions: Smaller financial institutions often offer portfolio loans with more flexible underwriting than major national banks.
Calculate the Break-Even Point: Ensure your total closing costs are recouped through monthly savings within 24 months of closing.
“Market Strategist View: Refinancing in 2026 is an exercise in opportunistic timing. Borrowers must maintain immaculate financial profiles ready to strike the moment Treasury yields dip.”
Mastering the complexities of today’s debt environment ensures you can successfully lower your debt service costs and protect your long-term financial stability.
Discover more from The Economy
Subscribe to get the latest posts sent to your email.

The days of pulling generic auto insurance quotes based purely on your zip code and age are officially over. In 2026, insurance comparison engines are powered entirely by generative AI and real-time telematics. These platforms digest thousands of live data points—ranging from your driving smoothness via connected vehicle sensors to real-time traffic congestion patterns—to generate hyper-personalized premiums instantly.
For consumers, this evolution represents both a massive opportunity for savings and a hidden trap for penalty pricing. Understanding how AI algorithms evaluate risk is essential for anyone looking to lower their monthly auto insurance premiums.
How AI Comparison Engines Evaluate Your Risk Profile
Behavioral Telematics and Connected Cars
Modern cars stream performance data directly to insurance aggregators. Generative AI models analyze braking sharpness, acceleration curves, cornering G-forces, and phone distraction metrics. Drivers who maintain smooth, defensive habits are rewarded with dynamic rate cuts of up to 40% compared to traditional rating tiers.
Predictive Traffic and Weather Modeling
AI tools now cross-reference your daily commute route with predictive weather and accident probability models. If your standard parking location or driving corridor has a statistically higher incidence of uninsured motorist claims, your quotes will reflect that hyper-local risk assessment.
| Comparison Factor | Traditional Rating Model | 2026 Generative AI Model | Impact on Premium |
| Mileage & Usage | Annual estimated odometer reading | GPS tracking & live trip duration | High (up to 35% savings) |
| Driving Behavior | MVR driving record & accidents | Real-time braking, speed, & G-force | Critical (determines tier) |
| Vehicle Tech | Make, model, and safety rating | ADAS calibration & repair cost data | Moderate |
Strategies to Lower Your AI-Driven Insurance Quote
To outsmart the algorithm and secure the lowest possible premium in 2026, drivers must proactively manage their digital footprint on insurance platforms.
Opt-In for Telematics Trial Periods: Many insurers offer immediate 15% discounts just for installing their driving app; let it track safe habits for 30 days to lock in permanent savings.
Scrub Unverified Public Records: Ensure your motor vehicle report is free of clerical errors that AI risk models misinterpret as reckless behavior.
Compare AI Aggregators: Use platforms that integrate multi-carrier API feeds rather than single-brand comparison sites to find the best risk-adjusted rate.
“Industry Note: AI-driven pricing rewards transparency and precision. Drivers who actively manage their telematics data consistently out-save those relying on legacy quote calculators.”
Embracing AI comparison tools allows savvy policyholders to customize coverage limits precisely to their driving habits, eliminating wasted premium spend while ensuring robust protection.
Discover more from The Economy
Subscribe to get the latest posts sent to your email.

The Global South: Debt, Climate Finance and Investment in 2026

Energy Security Is the New Economic Security

Can Global Tourism Survive Geopolitical Shocks?

Global Maritime Hegemony: How China Secured Over 81% of All New Shipbuilding Orders

The Coming Battle Over AI, Jobs and Wages

Why Developing Economies Face a Sharper Inflation Problem

The New Geography of Trade: Are Supply Chains Coming Home?

Is AI Saving Global Growth or Creating the Next Bubble?

Global Banking Trends 2026: Digital Banks, AI and Compliance

Gold vs US Dollar vs Bitcoin in 2026: Inflation Hedge Compared

How Global Interest Rates Affect Savings, Loans and Investments

How to Invest During High Inflation: A Global Guide

Best Global Stocks to Watch in 2026: Four Sectors to Research

Pakistan’s 2027 Growth Strategy: Exports, AI, Energy and Jobs

Crude Oil & Petroleum Market Analysis: OPEC+ Decisions and Price Forecasts

World’s Largest Economies: Ranking the Top Global Powers

Silver Price Today: Why the Xi-Trump AI Standoff Is Fueling a Safe-Haven Rally

Top US Convenience Store Chains: Store Counts, EV Charging, and Sales Trends

Algorithmic Dogfights: Why the U.S. and China Must Establish Rules of Engagement for Autonomous Air Power

Who Is Shivon Zilis? The Neuralink Executive at the Center of the Musk–OpenAI Trial

Social Security Extra $90 Deposit: Who Qualifies for the October 2026 Medicare Rebate?

Corporate America Faces a New Debt Test as US Borrowing Costs Surge

Business Insurance: What Coverage You Actually Need and What It Costs in 2026

Global Economic Outlook 2026: 7 Forces Reshaping Markets, Trade and Business

MAS Allocates S$1.45 Billion to Five Asset Managers in Third EQDP Batch: Total Deployment Reaches S$5.4 Billion

Gold Falls 3.7% as Yields Surge: Is Gold Still a Safe Haven in 2026?

Stock Market Today: Dow, S&P 500, and Nasdaq Retreat as Treasury Yields

US 10-Year Yield Hits 5.24%: What the Historic Bond Market Sell off Means for Mortgages and Investors
-

 Markets & Finance10 months ago
Top 15 Stocks for Investment in 2026 in PSX: Your Complete Guide to Pakistan’s Best Investment Opportunities
-

 Analysis8 months ago
Johor’s Investment Boom: The Hidden Costs Behind Malaysia’s Most Ambitious Economic Surge
-

 Analysis8 months ago
Top 10 Stocks for Investment in PSX for Quick Returns in 2026
-

 Banks9 months ago
Best Investments in Pakistan 2026: Top 10 Low-Price Shares and Long-Term Picks for the PSX
-

 Analysis9 months ago
Brazil’s Rare Earth Race: US, EU, and China Compete for Critical Minerals as Tensions Rise
-

 Investment10 months ago
Top 10 Mutual Fund Managers in Pakistan for Investment in 2026: A Comprehensive Guide for Optimal Returns
-

 Global Economy10 months ago
15 Most Lucrative Sectors for Investment in Pakistan: A 2025 Data-Driven Analysis
-

 Global Economy10 months ago
Pakistan’s Export Goldmine: 10 Game-Changing Markets Where Pakistani Businesses Are Winning Big in 2025