
Global Economy
Global Economy Defies Tariff Turbulence with AI-Powered Surge in 2026


The global economy is staging an unexpected comeback, powered by a force that few predicted would prove so resilient: artificial intelligence. Despite a year marked by escalating US-led trade disruptions and mounting geopolitical uncertainty, the world’s economic engine continues to hum along at a steady clip, defying predictions of a tariff-induced slowdown.
According to the latest IMF World Economic Outlook Update released in January 2026, global growth is projected to hold firm at 3.3 percent this year—a notable upward revision of 0.2 percentage points from October estimates. Remarkably, this forecast remains broadly unchanged from projections made a year ago, suggesting the global economy has effectively shaken off what many feared would be a crippling tariff shock.
But beneath this headline resilience lies a more complex story—one of technological transformation offsetting trade friction, of concentrated investment risks masking broader vulnerabilities, and of a recovery unevenly distributed across regions and sectors. As policymakers and business leaders chart their course through 2026, they face a fundamental question: Can AI-driven growth sustain the global economy indefinitely, or are we merely postponing an inevitable reckoning?
The Tariff Shock That Wasn’t
When the United States intensified trade barriers throughout 2025, economists braced for significant economic fallout. Traditional models suggested that such disruptions would dampen investment, disrupt supply chains, and ultimately drag down global growth. Yet the predicted catastrophe never materialized.
The World Bank’s Global Economic Prospects report, also published in January 2026, corroborates this surprising strength, forecasting steady growth at 2.6-2.7 percent with particular resilience evident in developing economies. What explains this unexpected robustness?
Several factors have converged to cushion the blow. First, trade tensions have eased somewhat from their peak, as businesses and governments alike sought pragmatic accommodations. Second, fiscal stimulus—particularly in the United States and China—has exceeded expectations, pumping vital demand into the system. Third, accommodative financial conditions have kept borrowing costs manageable, enabling continued investment despite uncertainty.
Perhaps most importantly, the private sector has proven remarkably agile in mitigating trade disruptions. Companies have diversified supply chains, relocated production facilities, and found creative workarounds to tariff barriers. In Vietnam and Mexico, manufacturing clusters have emerged almost overnight as firms seek alternatives to Chinese production. One electronics manufacturer in Ho Chi Minh City told me their workforce has tripled since 2024, absorbing skilled workers displaced by shifting trade flows.
The AI Investment Bonanza
Yet the story’s true protagonist isn’t trade policy adaptation—it’s technology. Investment in information technology, especially artificial intelligence, has surged to levels not seen in over two decades, providing a powerful countervailing force to trade headwinds.
In the United States, IT investment as a share of economic output has climbed to its highest level since 2001, according to OECD analysis. The organization projects that this AI capex cycle will boost US growth to 2.2-2.4 percent in 2026, compensating for weakness in traditional manufacturing sectors. Total US AI investments are projected to reach $515 billion in 2026, Reuters reports—a staggering sum representing nearly 2 percent of GDP.
This isn’t merely about Silicon Valley giants building data centers. The AI boom is reshaping investment patterns across industries. Automakers are pouring billions into autonomous driving systems. Healthcare providers are deploying AI diagnostic tools. Financial institutions are overhauling their infrastructure to leverage machine learning for everything from fraud detection to customer service.
The infrastructure demands alone are breathtaking. Each new generation of AI models requires exponentially more computing power, driving unprecedented investment in semiconductors, data centers, and energy systems. Nvidia’s latest chips remain backordered for months. Utility companies are scrambling to meet surging electricity demand from AI facilities.
Global Ripples from a Tech Epicenter
While the AI investment surge has been concentrated in the United States, its effects are decidedly global. Asia, in particular, is reaping substantial benefits through technology exports—a phenomenon economists call “positive spillovers.”
Taiwan’s TSMC, South Korea’s Samsung, and numerous Japanese suppliers have seen order books swell as American tech giants race to secure chip manufacturing capacity. The IMF notes that this has provided crucial support for Asian economies navigating otherwise difficult trade conditions.
Consider Taiwan: despite being caught in the crossfire of US-China tensions, its economy is thriving on AI-related semiconductor demand. Engineers in Hsinchu Science Park work round-the-clock shifts to meet production quotas. Housing prices in nearby districts have surged 30 percent in 18 months as highly paid tech workers flood the region.
The benefits extend beyond hardware. Indian IT services firms are hiring aggressively to support AI implementation projects for Western clients. Software developers in Bangalore command salaries rivaling those in Silicon Valley as companies compete for AI talent. Even manufacturing workers in Malaysia and the Philippines find opportunities assembling components for AI infrastructure.
This geographic diffusion of AI benefits helps explain why global growth remains resilient even as traditional trade patterns fragment. Technology, it seems, finds a way to flow across borders despite political barriers.
The Concentration Conundrum
Yet this optimistic narrative comes with significant caveats. The concentration of AI investment in a handful of companies and countries poses risks that prudent observers cannot ignore.
In the United States, just five technology companies account for the vast majority of AI capital expenditure. This concentration means that any shift in their investment priorities—whether due to technological obstacles, regulatory constraints, or financial pressures—could rapidly deflate the growth engine supporting the entire global economy.
The Economist warns against mistaking current resilience for sustainable success, noting that concentrated investment booms historically end poorly when reality fails to match inflated expectations. The dot-com bubble of the late 1990s followed a remarkably similar pattern: surging IT investment, productivity optimism, and financial exuberance—until it all came crashing down.
Current AI valuations embed extraordinarily optimistic assumptions about future productivity gains. If AI applications fail to deliver transformative efficiency improvements across the broader economy—if they remain concentrated in narrow use cases rather than becoming general-purpose technologies—investors may reassess. The resulting correction could be swift and severe.
Manufacturing’s Stubborn Malaise
Another worrying sign: while tech investment soars, manufacturing activity remains subdued across major economies. Factory output in Germany, once Europe’s industrial powerhouse, continues contracting. Chinese manufacturing PMI readings hover barely above the expansion threshold. American industrial production growth is anemic outside of semiconductor fabrication.
This divergence between booming tech investment and stagnant traditional industry reflects a fundamental restructuring of advanced economies. But it also reveals vulnerabilities. Manufacturing employs millions of workers worldwide, particularly in regions and demographics already experiencing economic stress. As these jobs disappear without comparable replacement opportunities, political pressures mount.
The social costs of this transition are already apparent. In Michigan, former auto workers struggle to find positions matching their previous wages and benefits. In Germany’s Ruhr Valley, entire communities built around heavy industry face uncertain futures. These human stories don’t appear in aggregate GDP statistics, but they shape political landscapes and policy choices.
Trade Disruptions: The Slow-Motion Crisis
While the global economy has absorbed the initial tariff shock, economists warn that trade disruptions’ full effects may take years to materialize. Supply chain reconfiguration isn’t costless—it diverts resources from productive investment and reduces efficiency through lost economies of scale.
The World Bank emphasizes that developing economies, despite current resilience, remain vulnerable to protracted trade uncertainty. Many depend heavily on export-led growth models that assume relatively open markets. If trade barriers become permanent fixtures rather than temporary aberrations, these economies will need fundamental restructuring.
Moreover, fragmenting global trade networks risks reducing technology diffusion and knowledge spillovers that have historically driven productivity growth. When companies produce for regional rather than global markets, they sacrifice scale efficiencies. When countries erect barriers to technology flows, they slow innovation.
The irony is striking: AI investment thrives on global collaboration—chips designed in California, manufactured in Taiwan, assembled in China, deployed worldwide—even as political forces push toward economic fragmentation. This tension cannot persist indefinitely without creating inefficiencies that eventually constrain growth.
Policy Frameworks: Emerging Markets’ Surprising Strength
Amid these challenges, one bright spot deserves attention: improved policy frameworks, especially in emerging market economies. Countries that once lurched from crisis to crisis through fiscal profligacy and monetary instability have increasingly adopted prudent macroeconomic management.
Brazil, for instance, has maintained credible inflation targeting despite political pressures. India has modernized its banking sector and improved tax collection. Indonesia has invested heavily in infrastructure while keeping debt sustainable. These improvements provide resilience against external shocks that would have triggered crises in previous decades.
This policy evolution matters enormously for global stability. Emerging markets now account for over 60 percent of global GDP on a purchasing power parity basis. Their ability to weather storms without requiring international bailouts represents a fundamental shift in the global economic architecture.
Charting a Path Forward
So where does this leave policymakers, investors, and ordinary citizens navigating 2026’s economic landscape?
First, recognize that current growth, while welcome, rests on foundations that aren’t entirely solid. The AI investment boom is real and transformative, but also concentrated and potentially fragile. Prudent planning requires acknowledging both its tremendous upside and its inherent risks.
Second, address the manufacturing sector’s malaise and the human costs of economic transition. Retraining programs, portable benefits, and place-based policies can help workers and communities adapt without resorting to protectionism that ultimately makes everyone worse off.
Third, resist the temptation toward further trade fragmentation. The global economy’s resilience partly reflects businesses’ ability to work around barriers—but each new barrier imposes costs. Policymakers should seek to stabilize and gradually reduce trade restrictions rather than escalating them.
Fourth, ensure that AI investment translates into broad-based productivity gains rather than remaining confined to narrow applications. This requires complementary investments in education, infrastructure, and regulatory frameworks that enable technology diffusion throughout the economy.
Finally, maintain the macroeconomic policy discipline that has served emerging markets well. The temptation to abandon fiscal restraint or monetary credibility when growth is strong always proves costly when conditions inevitably deteriorate.
The Verdict: Resilient, Not Invincible
The global economy’s ability to maintain 3.3 percent growth amid tariff turbulence represents a genuine achievement—one powered substantially by AI investment’s transformative force. Yet resilience should not breed complacency.
Concentrated investment risks, trade disruption effects that build over time, manufacturing sector weakness, and social dislocations all threaten to undermine current stability. The question isn’t whether the global economy can sustain 2026’s growth—it almost certainly can. The question is whether we’re building foundations for sustained prosperity or merely postponing harder adjustments.
As business leaders allocate capital, as policymakers craft regulations, and as workers plan careers, they would do well to remember that technological transformation and trade friction are both powerful forces. Right now, the former is winning. But history suggests that dismissing the latter’s long-term corrosive effects would be dangerously naive.
The global economy has defied tariff turbulence in 2026. Whether it can continue doing so indefinitely remains very much an open question.
Discover more from The Economy
Subscribe to get the latest posts sent to your email.


Markets & Finance
Stock Market Crash in 2026? Warning Signs, Scenarios and a Calm Investor Checklist
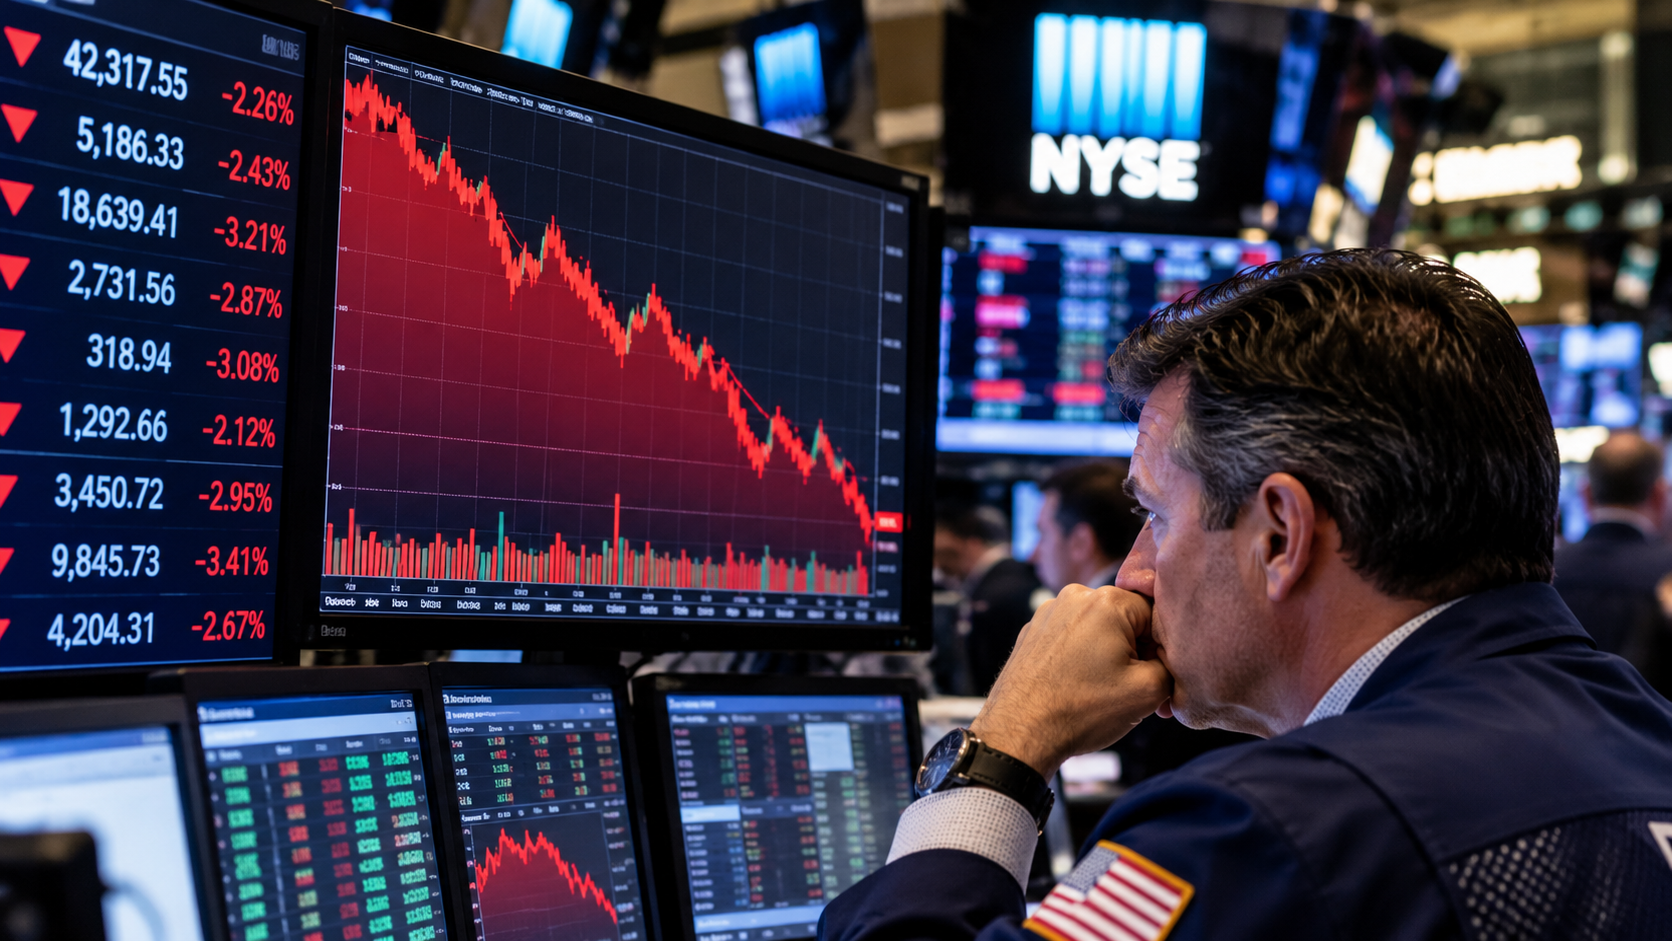
A stock market crash is a scenario to prepare for, not an event that can be declared merely because a few technology stocks fall. Reuters reported on October 12 that the S&P 500’s 2026 advance was relatively narrow, with more than four in ten constituents down for the year even as the benchmark had gained. That is a market-breadth warning worth analyzing, but it does not by itself prove that a crash is imminent. Sources: Reuters market breadth and Reuters bond market analysis.
The important context competitors can overlook
Watch the relationship among corporate earnings, long-term Treasury yields, credit conditions and the durability of AI spending. Higher yields can pressure expensive growth shares by raising discount rates, yet resilient earnings can offset part of that effect. It is important to distinguish a routine pullback, an index correction and a systemic crisis. None is the same as an unavoidable recession, and exact timing forecasts are notoriously unreliable. For primary-source checks and current reporting, see Reuters market breadth and Investor.gov. The key distinction is turn fear-driven headline into evidence-led risk analysis.
A correction, a bear market and a crash describe different price events. No single indicator can reliably predict a market collapse; portfolio resilience is more actionable. Research cutoff: October 12, 2026; confirm developing facts before publication.
A practical way to use this information
For a household, start with the financial plan: maintain cash needed soon, review whether holdings are excessively concentrated, check investment fees and avoid leveraged bets on a headline. A retiree drawing income has different exposure to early losses than a worker contributing for decades. Stress-test an illustrative decline, confirm how much would need to be sold, and document rebalancing rules before volatility arrives.
Crash risk or ordinary volatility? A four-part test
| Question | Evidence to gather | Why it matters |
|---|---|---|
| Is the weakness broad? | Number of stocks falling, sector breadth | A few giant companies can hide weaker participation |
| Is financing tightening? | Treasury yields and credit spreads | Borrowing stress can amplify selling |
| Are profits weakening? | Earnings revisions and guidance | Valuation may need to reset if cash flows disappoint |
| Is your plan fragile? | Near-term withdrawals and concentration | Personal exposure differs from market headlines |
The October 12 Reuters breadth report supports asking these questions, not publishing a certain crash date. Always specify what would falsify an alarming thesis.
What to verify before making a decision
The right next step is to identify the source, timestamp and applicable market or jurisdiction. Check whether a number is a historical observation, official announcement, target, forecast or scenario. If you intend to act financially, legally or commercially, use the relevant provider’s current terms and obtain professional advice where appropriate. The sources cited here establish context; they are not a substitute for live prices, individual eligibility checks or binding agreements.
Reader questions
Is there a confirmed market crash today?
The cited October 12 evidence describes market concentration and risk, not a confirmed broad-market crash.
Which signal should investors watch first?
No single metric works; consider breadth, earnings, funding conditions and your own time horizon together.
What would distinguish a correction from a crash?
Market vocabulary matters. A correction is commonly used to describe a broad decline of roughly 10% from a recent peak, while a bear market often refers to a fall of about 20%. “Crash” has no universally binding numerical definition; it often describes an unusually fast and disorderly fall. Those labels summarize price behavior but do not diagnose the economic cause. A 3% decline after a strong rally can feel alarming, especially in speculative stocks, yet it should not automatically be promoted as evidence that the entire market has entered crisis.
A more useful question is how many securities participate in a decline. Indexes weighted by company size can hide weakness beneath headline levels. When a handful of companies account for much of an index’s gains, weakness in smaller constituents may go unnoticed. Still, narrow breadth alone is not a reliable crash clock. It should be assessed together with earnings expectations, credit conditions, unemployment trends and funding-market stress. For real-time broad-market reporting, prefer clearly time-stamped sources such as Reuters.
Four risks investors can measure instead of guessing
Valuation risk: expensive shares can be vulnerable when projected growth disappoints or discount rates rise. Compare the valuation measure with realistic earnings scenarios rather than treating one ratio as a verdict. Concentration risk: calculate how much of a portfolio depends on a few stocks, industries or factors. Two funds can appear diversified while holding many of the same underlying companies. Liquidity risk: an investment may be difficult to sell near a quoted price during stress. Leverage risk: borrowed money and margin calls can turn an ordinary setback into a forced sale.
These risks interact. A portfolio concentrated in highly valued growth companies, financed partly with leverage, may be more fragile than a broadly diversified portfolio even if both posted similar returns last year. Conversely, a company with strong cash generation does not become risk-free merely because its balance sheet is healthy. Markets can reprice excellent businesses when required returns change. Good analysis distinguishes possible loss mechanisms from unsupported claims that a specific collapse is certain.
A stress test that does not require forecasting the market
Assume a household has $40,000 invested, needs $8,000 for tuition within nine months and can tolerate a temporary paper loss of $5,000. If a 20% market decline cut the account to $32,000, selling $8,000 for tuition would lock in a portion of the loss and leave less capital to recover. The important weakness is not the prediction of a 20% decline; it is using a volatile portfolio to fund a near-term unavoidable expense. A dedicated cash reserve can reduce that timing risk, though cash also has inflation and opportunity costs.
For longer-term savers, test the impact of several hypothetical market drops against current asset allocation and future contributions. Ask whether the household could maintain essential spending and avoid forced selling. This is more constructive than changing a retirement strategy in reaction to an intraday headline. It is also useful to review emergency liquidity, high-interest debt and insurance arrangements before increasing exposure to volatile investments.
Why an economic slowdown is not the same as a stock crash
GDP data, employment, consumer spending and corporate earnings influence markets, but share prices reflect expectations about the future. Stocks can fall ahead of a recession, rise while the economy is still weak or remain volatile without a recession occurring. Monetary policy can affect both discount rates and borrowing costs; its influence is important but not mechanically predictable. Financial news should not confuse a large move in Treasury yields with a confirmed default, or a disappointing earnings report with proof of an economy-wide breakdown.
Investors should separate observations from hypotheses: “credit spreads widened” is measurable; “credit spreads guarantee a crash next month” is speculative. Charts become more trustworthy when they show units, beginning and ending dates, and data sources. A scary percentage without a reference period may exaggerate or disguise risk.
Questions to ask before making portfolio changes
- What is the time horizon for this money and what spending does it need to cover?
- How concentrated is the portfolio in equities, technology or a single employer?
- Is there borrowing, margin exposure or a short-term cash obligation?
- Did the market move because of confirmed data, policy news or unverified speculation?
- Would a proposed trade still make sense if the market recovered tomorrow?
A clear checklist cannot eliminate losses. It can, however, keep a stressful search for “stock market crash” from turning into a decision based on a sensational headline alone.
Discover more from The Economy
Subscribe to get the latest posts sent to your email.
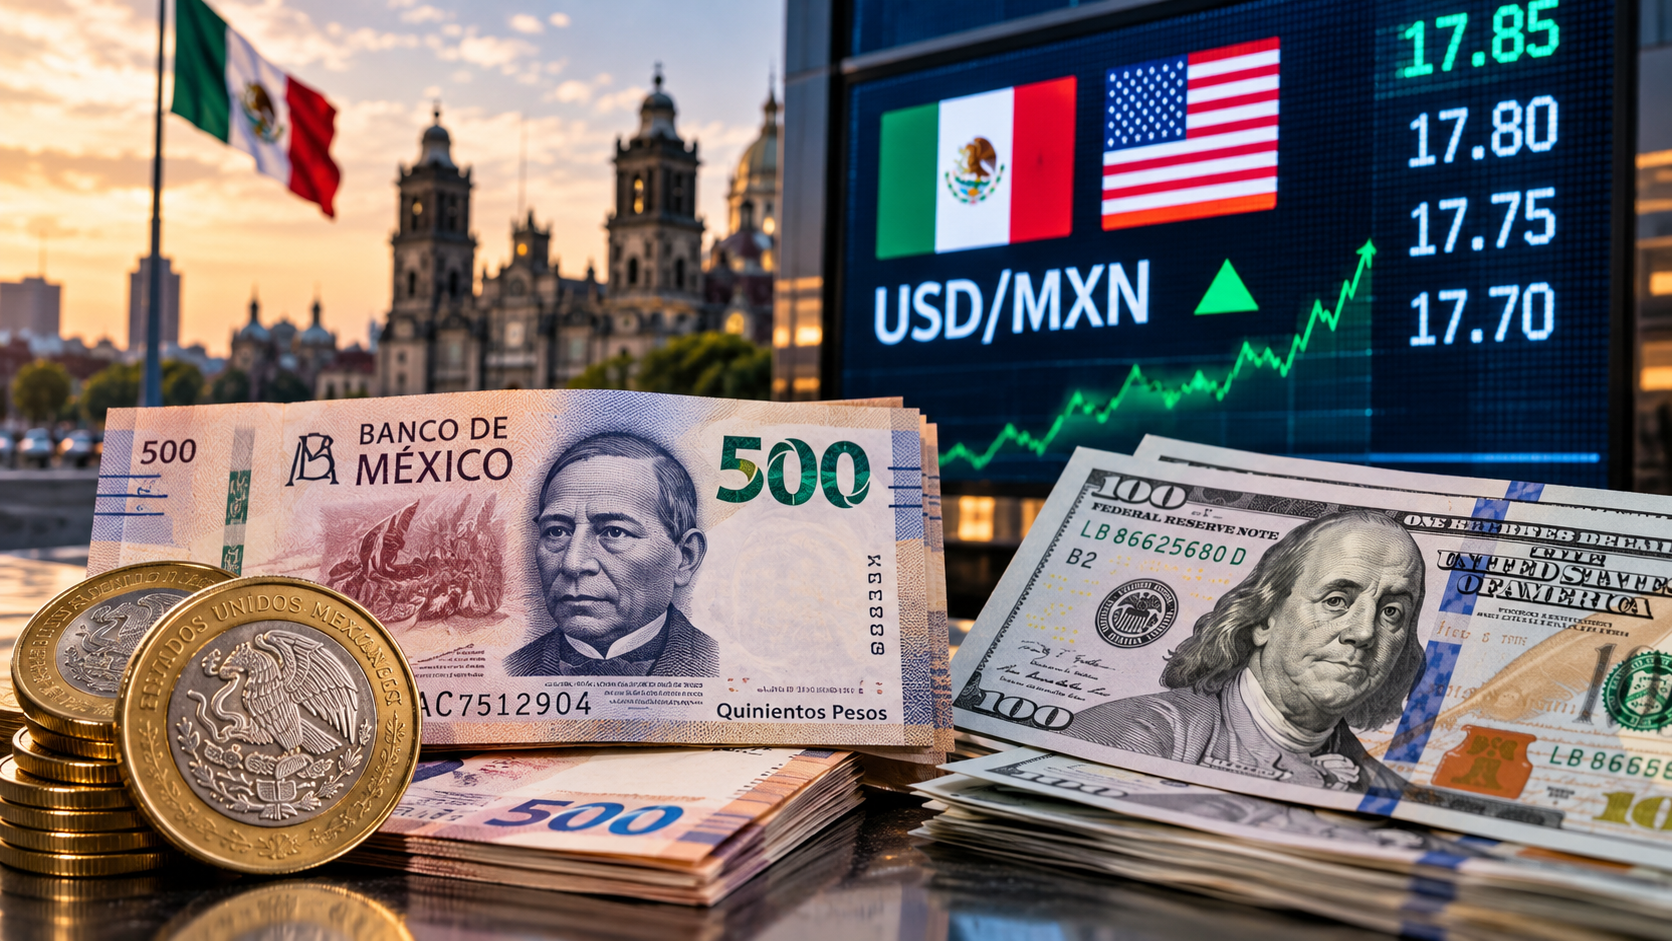
USD/MXN measures pesos per U.S. dollar. Compare the live exchange quote with transfer fees and the actual peso amount delivered, rather than relying on a headline rate. Research cutoff: October 12, 2026; confirm developing facts before publication.
What is happening and why readers are searching
The peso mexicano versus dólar estadounidense question is not just about a currency quote. It is about how many pesos arrive after an American sends money, what a Mexican importer pays in dollars and how a trader interprets movements in USD/MXN. As of October 12, the U.S. dollar is drawing support from geopolitical risk and expectations surrounding the next American inflation report, although that broad dollar trend cannot alone establish the peso’s intraday direction. Sources: Reuters currency coverage and BLS CPI.
The important context competitors can overlook
USD/MXN measures pesos per U.S. dollar: when the number rises, the dollar strengthens against the peso; when it falls, the peso gains. Mexico’s interest rates, inflation, trade flows, risk appetite and the relative direction of Federal Reserve policy all matter. Remittance services add a second layer: the advertised exchange rate and the transaction fee can change the amount a family receives even if the interbank quote is unchanged. For primary-source checks and current reporting, see Reuters currency coverage and World Trade Organization. The key distinction is separate fx price, bank spread and transfer cost.
A practical way to use this information
For a remittance, request an all-in quote from at least two providers at the same time and compare the final MXN delivered, not the headline “zero-fee” claim. For business invoices, set a clear payment date and decide whether locking a rate is worth the cost. For market commentary, label the observation time and data source; never publish an unverified live USD/MXN price or a one-way prediction as a fact.
The remittance calculation that matters
Suppose a provider quotes 18.00 pesos per dollar and charges a $5 fee on a $500 transaction. If the fee is deducted from the sending amount, the recipient would receive 495 × 18.00 = 8,910 MXN. A competing provider might quote 17.90 with no fee, delivering 8,950 MXN. These are invented teaching rates, not October 2026 exchange quotes. The second provider wins this narrow example even though its quoted exchange rate looks worse.
This is why a reader searching peso mexicano may need more than a Reuters market chart: the consumer question is about the effective rate. State fees, settlement speed and delivered pesos together, and use a current live provider quotation before publishing a recommendation.
What to verify before making a decision
The right next step is to identify the source, timestamp and applicable market or jurisdiction. Check whether a number is a historical observation, official announcement, target, forecast or scenario. If you intend to act financially, legally or commercially, use the relevant provider’s current terms and obtain professional advice where appropriate. The sources cited here establish context; they are not a substitute for live prices, individual eligibility checks or binding agreements.
Reader questions
Does a rising USD/MXN mean a stronger peso?
No. More pesos per dollar indicates a weaker peso relative to the U.S. currency.
Is the mid-market exchange rate what customers receive?
Usually not; providers may add a spread or fee.
How to read USD/MXN without reversing the direction
USD/MXN is conventionally quoted as the number of Mexican pesos required to purchase one U.S. dollar. If the quote rises from a hypothetical 18.00 to 18.50, the dollar has strengthened against the peso: one dollar buys more pesos. If it falls to 17.50, the peso has strengthened because fewer pesos are needed to buy a dollar. The exchange rate can change during the day, so comparisons should specify the timestamp, data provider and whether the quote is a wholesale mid-market price or a consumer rate.
The inverse quote, MXN/USD, tells a different story in presentation but describes the same relationship. A casual reader may see a number move downward and call it a “currency crash,” even though that direction means peso appreciation in the USD/MXN convention. Explaining the quote first prevents misleading conclusions in headlines, charts and transfer decisions. For monetary-policy background, compare official material from Banco de México and the Federal Reserve.
Interest-rate differences are important, not decisive
A higher Mexican policy rate relative to the U.S. rate can make peso-denominated assets attractive to some international investors. The appeal depends on expected exchange-rate moves, transaction costs, risk appetite and access to local instruments, not simply a subtraction of headline interest rates. If investors fear abrupt currency depreciation or escalating global conflict, the apparent interest-rate advantage may be overwhelmed by the exchange-rate loss. Expectations about future central-bank decisions often move the market before either institution changes its benchmark rate.
Mexico’s economic connections to the United States complicate any simple theory. Manufacturing exports, remittances, tourism receipts, foreign investment and import payments create flows into and out of pesos. A slowing U.S. economy could affect Mexican exporters while simultaneously altering expectations for U.S. rates. The peso may therefore respond to employment, trade and geopolitical news in ways that do not align neatly with the daily dollar index. Currency forecasts should acknowledge competing drivers rather than state a one-way outcome as inevitable.
The real cost of sending money to Mexico
A remittance comparison must combine the fee and the provider’s exchange rate. Suppose someone sends $500 when an illustrative mid-market exchange rate is 18.00 pesos per dollar. Before charges, the theoretical value is 9,000 pesos. Provider A offers 17.75 and charges $4; if the fee is deducted from the amount exchanged, the recipient receives 496 × 17.75 = 8,804 pesos. Provider B offers 17.85 with an $8 deducted fee, yielding 492 × 17.85 = 8,782.20 pesos. The provider advertising the better exchange rate does not necessarily deliver the larger amount.
This comparison is hypothetical and ignores any receiving-bank deductions. For genuine comparisons, require a final “recipient gets” figure at the same moment and for the same payment method. Some providers promote the first transfer, then use different rates afterward. Others offer faster delivery at a higher cost. The family receiving the funds should also check whether a mobile-wallet, bank-account or cash-pickup method suits its needs and whether the quoted conversion remains locked until delivery.
A simple scenario map for consumers and companies
Consider three scenarios rather than a single USD/MXN prediction. In a calmer global market, investors might place more weight on Mexican yields and economic fundamentals. During a global risk-off event, a rush toward dollar liquidity may dominate even if Mexican domestic indicators have not materially changed. Under a sharp change in U.S.-Mexico trade expectations, importers and exporters could adjust demand for foreign currency independently of speculative flows. The probability and timing of these scenarios cannot be read directly from a single chart.
An importer paying suppliers in dollars generally benefits from a stronger peso when other variables are unchanged; a Mexican exporter receiving dollars can face the opposite currency translation. A U.S. family sending dollars to Mexico usually receives fewer pesos when the peso strengthens, although improved purchasing power or local inflation trends may change how far those funds go. Each reader must identify which side of the exchange is relevant before deciding whether a move is favorable.
Before exchanging or transferring
Write down the amount, recipient currency, exact provider fee, offered exchange rate, receipt deadline and whether cancellation is allowed. Compare at least two actual all-in quotes, not screenshots taken hours apart. If the funds are needed for rent or medical treatment, certainty of delivery may outweigh a marginal rate improvement. Traders should separately consider position sizing, liquidity and overnight risk; a retail-remittance guide is not a strategy for leveraged currency speculation.
For updated context, consult a current Banxico economic release alongside verified currency-market reporting. An article can explain currency mechanisms for months, but a quoted USD/MXN price without a fresh timestamp can mislead within minutes.
Discover more from The Economy
Subscribe to get the latest posts sent to your email.

Price transparency and dynamic pricing are different issues. Compare the mandatory total and resale terms before committing to an event. Research cutoff: October 12, 2026; confirm developing facts before publication.
What is happening and why readers are searching
Fans shopping for concerts frequently find that an attractive listed ticket price does not describe the whole purchase. The Federal Trade Commission’s rule on unfair or deceptive fees, effective May 12, 2025, requires upfront disclosure of total mandatory prices for covered live-event tickets and short-term lodging offers. It does not ban dynamic pricing or prohibit a particular fee amount. Sources: Federal Trade Commission and FTC job scam guidance.
The important context competitors can overlook
Dynamic pricing can change the base ticket price in response to demand. Resale listings add another layer of uncertainty: the buyer should identify the seller, venue transfer method, seating details, restrictions and refund terms. A prominent “VIP” description may not include the experience the customer assumes. Consumers should judge the final basket total, not the teaser price. For primary-source checks and current reporting, see Federal Trade Commission and IFPI. The key distinction is reader-oriented fee transparency and scam prevention.
A practical way to use this information
Before paying, visit the artist or venue’s official ticket links, confirm the total including mandatory charges and keep a screenshot of checkout terms. Compare with authorized resale platforms where permitted. Be wary of social accounts requesting wire transfers or cryptocurrency. If prices exceed budget, set an upper limit rather than allowing scarcity messaging to dictate spending.
What to verify before making a decision
The right next step is to identify the source, timestamp and applicable market or jurisdiction. Check whether a number is a historical observation, official announcement, target, forecast or scenario. If you intend to act financially, legally or commercially, use the relevant provider’s current terms and obtain professional advice where appropriate. The sources cited here establish context; they are not a substitute for live prices, individual eligibility checks or binding agreements.
Reader questions
Did the FTC ban ticket service fees?
No. Its rule targets deceptive display of mandatory fees and total prices.
Can tickets still use dynamic pricing?
Yes. The rule does not prohibit pricing strategies as such.
What the total ticket price should tell you
An advertised concert ticket might display a face value before mandatory service or facility fees are added. U.S. Federal Trade Commission rules for covered live-event ticket sales require disclosure of the total price including mandatory fees, with certain permitted exclusions such as applicable taxes or optional add-ons handled according to the rule. This consumer-protection framework is not a cap on prices and does not prohibit dynamic pricing. The critical editorial distinction is between how a price is disclosed and how the price itself is set. A correctly disclosed expensive ticket may still be expensive.
If a ticket is listed at $90 but carries unavoidable charges totaling $25, a shopper should evaluate the $115 total rather than treating $90 as the economic commitment. Two providers listing the same artist and section may also have different terms, transferable rights or guarantees. Before checkout, look for a full price, seat location, refund conditions and any separate costs for parking or travel. The FTC’s official fee-rule guidance explains the covered disclosures and limits.
Dynamic pricing is a market system, not a single fee
Dynamic pricing refers broadly to changes in offered prices based on factors such as demand, remaining inventory or timing. It is distinct from a fixed mandatory service charge. A ticket can become more expensive because the offered face price changes, because inventory moves into a higher-priced category or because the buyer is shopping a resale marketplace. An article that treats every increase as a hidden fee loses this nuance. Consumers should save the total checkout price and evaluate it against their budget, not assume that a lower price is guaranteed if they refresh a webpage later.
Presales add another layer. Access to a code or membership may give a fan a chance to buy before a general sale, but it does not necessarily guarantee availability or a particular price. Fans should read whether a presale requires a paid membership or special card and whether those costs are worthwhile. Fear of missing out is a powerful sales driver; a clear spending ceiling set in advance can counter pressure to accept a ticket that becomes unaffordable.
Primary sale, verified resale and risky third-party links
Primary tickets are generally offered through the event’s authorized seller, while resale listings may be posted by previous buyers or brokers. Authorized resale platforms can provide transfer and authenticity processes, but a displayed resale listing is not the same as a seat being available from the artist’s primary allocation. The buyer should determine which marketplace they are using, how tickets are delivered and what happens if the event is canceled or postponed. Buyer guarantees can differ, so review the actual terms.
Imitation ticket sites may rank in search results or appear in sponsored promotions. A fraudulent seller might send a static image of a barcode that cannot be transferred or accepted. Avoid payment by gift card, cryptocurrency or person-to-person methods when such payment removes meaningful purchase protection. Navigate from the performer’s or venue’s official website when locating the authorized ticket source. Retain receipts and confirmation numbers.
What a concert trip really costs
A $140 ticket can become a much larger commitment after transportation, parking, meals, accommodation and child care. If the show is in another city, also consider change or cancellation penalties. For example, two hypothetical $140 tickets cost $280, but $60 in travel, $35 in parking and $80 for food bring the evening to $455. A person who compares only the per-ticket price may be surprised by the final household cost. A price comparison is more helpful when it includes the whole event budget.
Sometimes a neighboring city’s show offers a lower face price but creates more travel expense; other times better seating or a convenient date makes the higher ticket price worthwhile. Value is subjective, but total cost is measurable. Establish a maximum budget across tickets and travel rather than increasing the ticket budget while ignoring the accompanying charges.
If the show is canceled, postponed or rescheduled
Refund and exchange rights can differ depending on the event terms, platform, jurisdiction and nature of the schedule change. A cancellation is not identical to a postponed concert with a replacement date. Review the organizer’s official notice and the seller’s policy before requesting a chargeback. A venue’s statement should not be confused with an unverified social-media rumor. Travel expenses may be governed by entirely separate supplier agreements even if ticket money is returned.
The best consumer article helps readers distinguish price transparency, seat availability, resale protection and cancellation rights. Those are related aspects of ticket buying, but none can be reduced to a single “junk fees” headline.
Three decisions that protect concert buyers
Choosing between the original seller and resale: Compare the entire checkout price, guarantee and transfer method. A resale seat might be more expensive despite an apparently attractive listing. A ticket bought through an unauthorized seller can introduce uncertainty about validity. Follow verified artist or venue links, especially during a high-demand presale.
Deciding whether a premium seat is worth it: Compare the extra cost with sightlines, proximity and any included services. Premium packages sometimes include amenities, but the value depends on what is actually delivered. A fan who simply wants to hear the performance may prefer a lower-cost seat, while another may value accessibility or a particular viewing position. Neither choice is inherently correct.
Handling a postponed event: Read the organizer’s final notice and ticket platform terms before assuming a refund is automatic or unavailable. Save the original event date and purchase confirmation. Separate ticket policies from hotel and transport arrangements, which may need their own cancellation requests.
Discover more from The Economy
Subscribe to get the latest posts sent to your email.

Oil and Diesel Prices in October 2026: How Supply Shocks Can Reach Inflation

AI Chip Demand in 2026: What TSMC, Nvidia and Data-Center Spending Reveal

Q3 2026 Earnings Season: The Bank, AI and Consumer Signals That Really Matter

Treasury Yields in 2026: Why Higher Bond Rates Matter for Stocks, Mortgages and Savings

KOSPI 2026: Why South Korean Stocks Turned Volatile and What AI Investors Should Watch

IREN Stock in 2026: AI Cloud Growth, Bitcoin Transition and the Risks Investors Miss

Stock Market Crash in 2026? Warning Signs, Scenarios and a Calm Investor Checklist

Peso Mexicano vs Dólar Estadounidense: A Practical USD/MXN Guide for October 2026

Is the Stock Market Open on Columbus Day 2026? NYSE, Nasdaq and Bonds Explained

Concert Ticket Prices in 2026: Dynamic Pricing, Fees and How to Buy Safely

High-Yield Savings Accounts in 2026: How to Compare APY Without Chasing a Headline

EU-China Trade Deal 2026: How Beijing and Brussels Avoided a Trade War—and Who Wins

Social Security 2027 COLA Announcement: Date, Formula and What Retirees Should Check

China’s AI Microdrama Boom: How Beijing Is Reshaping Global Media

China Stocks Today: Are Big Economies in Asia Nearing a Market Bottom?

World’s Largest Economies: Ranking the Top Global Powers

Global Pension Systems Ranked: The World’s Best and Worst Retirement Frameworks

Elon Musk’s Next Moves: Disrupting the 2026 Global Economy

Pakistan Economy 2026: Inside the SBP’s Balancing Act

Crude Oil & Petroleum Market Analysis: OPEC+ Decisions and Price Forecasts

GasBuddy Market Insights: How Crude Price Shifts Impact Local Fuel Cost Averages

Global Equity Market Divergence: US Tech vs. European Dividend Stocks vs. Asian Growth

IMF & World Bank Global Economic Outlook: Growth Forecasts Across Europe and Asia

Silver Price Today: Why the Xi-Trump AI Standoff Is Fueling a Safe-Haven Rally

Bitcoin Price Forecast 2026–2027: Will the 4-Year Cycle Hold?

The Future of Silicon: Supply Chain Vulnerabilities in the 2026 Tech Sector

Asian Stock Markets 2026: Japan, China, Pakistan & More

SpaceX IPO: How Aerospace Is Reshaping Tech Startup News
-

 Markets & Finance9 months ago
Top 15 Stocks for Investment in 2026 in PSX: Your Complete Guide to Pakistan’s Best Investment Opportunities
-

 Analysis8 months ago
Johor’s Investment Boom: The Hidden Costs Behind Malaysia’s Most Ambitious Economic Surge
-

 Analysis8 months ago
Top 10 Stocks for Investment in PSX for Quick Returns in 2026
-

 Banks9 months ago
Best Investments in Pakistan 2026: Top 10 Low-Price Shares and Long-Term Picks for the PSX
-

 Analysis8 months ago
Brazil’s Rare Earth Race: US, EU, and China Compete for Critical Minerals as Tensions Rise
-

 Investment9 months ago
Top 10 Mutual Fund Managers in Pakistan for Investment in 2026: A Comprehensive Guide for Optimal Returns
-

 Global Economy10 months ago
15 Most Lucrative Sectors for Investment in Pakistan: A 2025 Data-Driven Analysis
-

 Global Economy10 months ago
Pakistan’s Export Goldmine: 10 Game-Changing Markets Where Pakistani Businesses Are Winning Big in 2025