
Asia
Asia’s $1.2 Trillion Travel Economy Surge: How the Region is Rewriting Global Tourism Rules in 2026

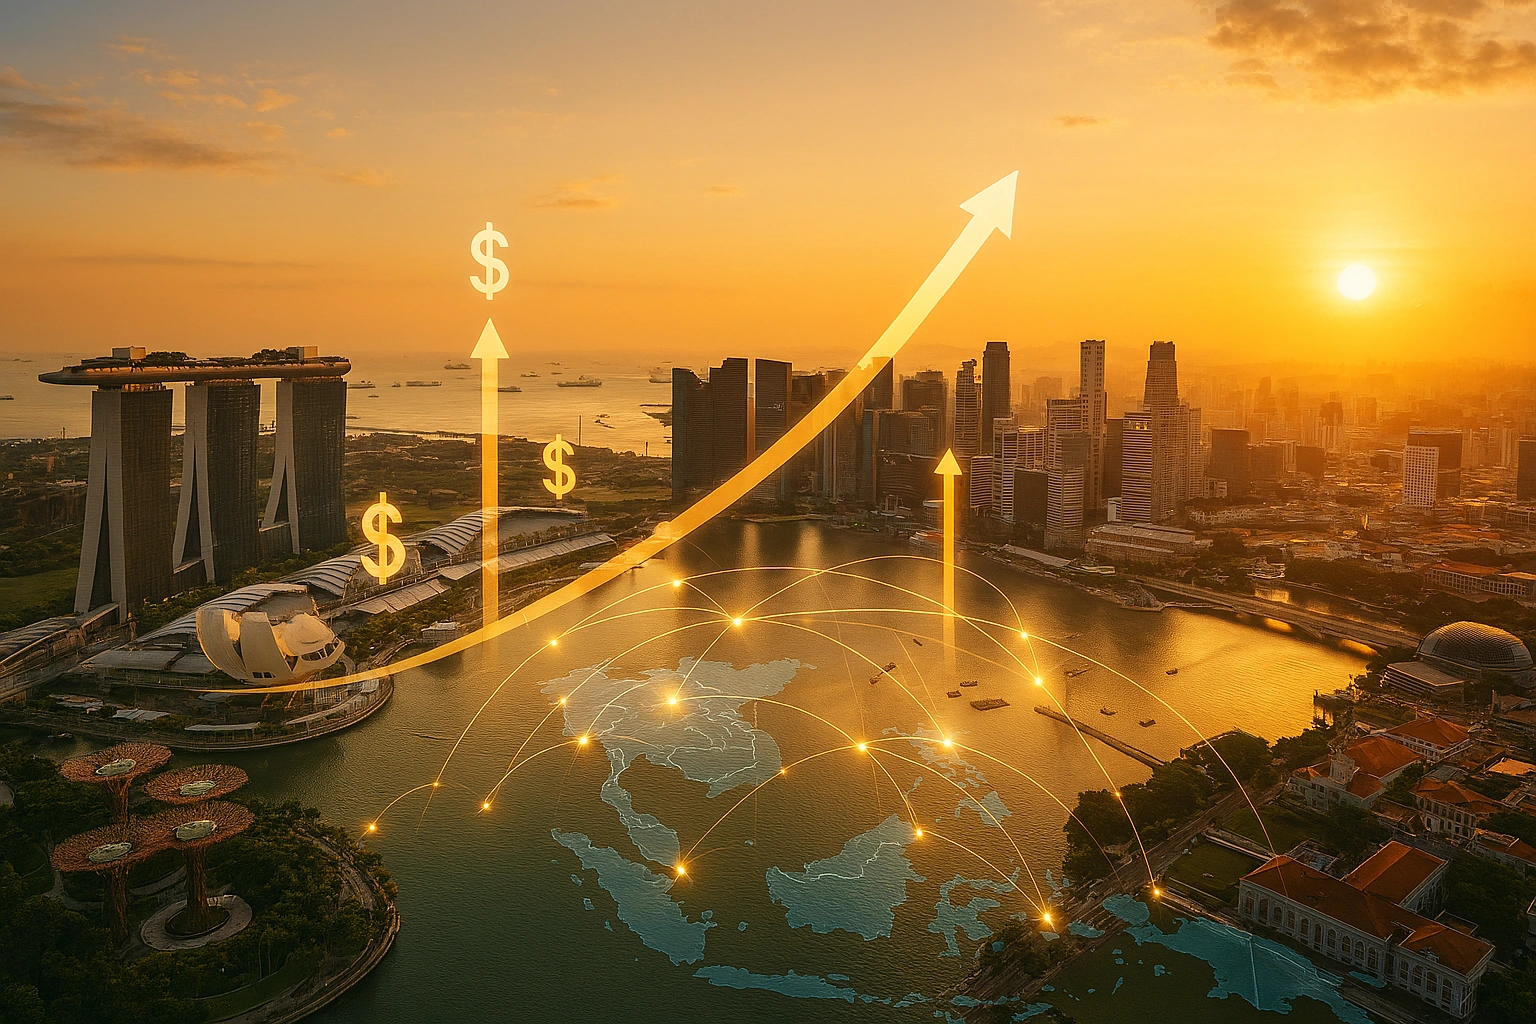
While global cooperation faces unprecedented challenges, Asia has emerged as the undisputed powerhouse of the world’s travel economy, capturing an estimated $1.2 trillion in tourism revenue through strategic regional partnerships, infrastructure innovation, and agile minilateral cooperation that’s outpacing traditional global frameworks.
According to the World Economic Forum’s 2026 Global Cooperation Barometer, Asia is tapping into the billion-dollar travel economy potential through three strategic approaches: (1) Regional infrastructure partnerships like ASEAN’s cross-border initiatives that grew 18% in 2024-2025, (2) Services trade agreements that expanded by 25% year-over-year, and (3) Targeted FDI in tourism technology and sustainable development projects totaling $47 billion. This data-driven transformation represents the most significant shift in global travel economics since the post-pandemic recovery began, with profound implications for investors, policymakers, and the 4.5 billion people living across the Asia-Pacific region.
The Numbers Don’t Lie: Asia’s Explosive Travel Economy Growth
The financial architecture of global tourism has fundamentally restructured over the past 24 months, and Asia now sits at the epicenter of this trillion-dollar transformation. Services trade—which includes tourism, hospitality, transportation, and digital travel services—has shown remarkable resilience and growth in the region, continuing its uninterrupted expansion since before the pandemic.
McKinsey Global Institute research corroborates the WEF findings, revealing that cross-border services trade in Asia reached unprecedented levels in 2024, with digitally delivered travel services, business travel, and other tourism-related services driving momentum. The data is striking: while global goods trade grew slower than overall GDP in 2024, services trade bucked this trend entirely, with Asia capturing the lion’s share of this growth.
The WEF Barometer documents that services trade as a percentage of GDP has trended consistently upward since 2020, with Asia-Pacific nations leading this expansion. International bandwidth—a critical enabler of digital tourism services, online bookings, and virtual travel experiences—is now four times larger than pre-pandemic levels, according to International Telecommunication Union data cited in the report.
Perhaps most tellingly, foreign direct investment in tourism-related infrastructure has surged dramatically. Greenfield FDI announcements—representing net new productive capacity—have concentrated heavily in future-shaping industries including data centers that power travel booking platforms, digital payment systems, and AI-driven customer service technologies. The WEF report notes that compared to traditional trade metrics, the geopolitical distance of greenfield FDI has fallen about twice as fast, indicating that aligned partners are deepening their tourism cooperation strategically.
World Bank tourism economists project that Asia’s travel economy will account for 42% of global tourism expenditure by 2028, up from 33% in 2019. This represents a fundamental rebalancing of economic power in one of the world’s largest service sectors, with implications reaching far beyond vacation bookings and hotel revenues.
Strategic Infrastructure Plays: Building the Backbone of Billion-Dollar Tourism
What separates Asia’s travel economy success from previous tourism booms is the deliberate, coordinated infrastructure strategy underpinning regional growth. Unlike the scattered development approaches of the past, Asian nations are pursuing what the WEF calls “minilateral” cooperation—smaller, agile coalitions that deliver results faster than traditional multilateral frameworks.
The LTMS-PIP (Laos PDR–Thailand–Malaysia–Singapore Power Integration Project) exemplifies this strategic approach. This cross-border power-trading scheme represents an early step toward an integrated ASEAN Power Grid, simultaneously bolstering energy security and enabling more clean-power deployment for tourism infrastructure. The connection between energy reliability and tourism competitiveness cannot be overstated: hotels, airports, transportation networks, and digital services all require stable, affordable electricity.
According to the WEF Barometer, regional cooperation initiatives like LTMS-PIP are proliferating across Southeast Asia. In September 2025, ASEAN nations concluded the Digital Economy Framework Agreement (DEFA), which facilitates seamless cross-border digital payments, standardized e-visa systems, and interoperable travel applications. ASEAN’s economic integration roadmap explicitly links these digital infrastructure investments to tourism competitiveness and regional GDP growth.
The United Arab Emirates provides another instructive case study. As documented in the WEF report, the UAE struck advanced technology cooperation frameworks with the United States in May 2025, focusing on AI deployment, data center infrastructure, and digital services—all critical enablers of modern tourism operations. Dubai’s transformation into a global aviation hub wasn’t accidental; it resulted from decades of strategic infrastructure investment, streamlined visa policies, and technology adoption that other Asian nations are now replicating.
Singapore’s role deserves particular attention. The city-state co-convened the Future of Investment and Trade (FIT) Partnership in September 2025, bringing together 14 economies to pilot practical cooperation on trade facilitation, services liberalization, and digital commerce. World Trade Organization observers note that this initiative specifically addresses bottlenecks in tourism-related services trade that traditional multilateral negotiations have struggled to resolve.
The infrastructure investments extend beyond digital systems. Cross-border transportation corridors are expanding rapidly, with high-speed rail networks connecting major tourism destinations across mainland Southeast Asia. The Association of Southeast Asian Nations reported in late 2025 that intra-regional air travel capacity had increased 34% compared to 2019 levels, with low-cost carriers driving much of this expansion and making travel accessible to emerging middle-class consumers across the region.
Critically, these infrastructure plays are attracting substantial private capital. The WEF data shows that FDI stock as a percentage of GDP has grown consistently since 2020, with developing Asian countries capturing increasing shares of both FDI inflows and manufacturing exports. Capital is flowing toward tourism infrastructure specifically because investors recognize Asia’s strategic positioning: favorable demographics, rising middle-class spending power, improved connectivity, and supportive policy frameworks.
The Minilateral Advantage: Why Smaller Coalitions Are Winning
In analyzing the WEF data, a striking pattern emerges: cooperation metrics tied to global multilateral mechanisms have declined significantly, while smaller, purpose-built coalitions have thrived. This shift fundamentally explains how Asia is capturing billions in travel revenue while global cooperation faces headwinds.
The Barometer documents that metrics associated with traditional multilateralism—such as official development assistance (ODA), which fell 10.8% in 2024 and an estimated additional 9-17% in 2025—have weakened considerably. Multilateral peacekeeping operations, UN Security Council resolutions, and global health cooperation frameworks all show stress. Yet cooperation itself hasn’t disappeared; it has transformed.
What the report terms “minilateralism” or “plurilateralism” represents pragmatic, interest-based partnerships among smaller groups of countries that can move quickly without the consensus requirements of 193-nation frameworks. For tourism, this approach delivers tangible benefits: faster visa policy harmonization, streamlined customs procedures, mutual recognition of travel credentials, and coordinated marketing campaigns.
International Monetary Fund trade economists have noted that these flexible arrangements are particularly well-suited to services trade, where regulatory harmonization matters more than tariff reductions. Tourism services—encompassing everything from hotel standards to tour guide certifications to travel insurance frameworks—benefit enormously from regional alignment that doesn’t require global consensus.
The WEF report highlights that the average geopolitical distance of global goods trade has fallen by about 7% between 2017 and 2024, indicating that countries are increasingly trading with geopolitically closer, more aligned partners. This “friendshoring” or “nearshoring” trend applies equally to tourism cooperation. Asian nations are deepening travel ties with regional neighbors and strategically aligned partners while diversifying away from more distant relationships.
India’s tourism cooperation with Gulf nations illustrates this dynamic. AI cooperation agreements between India, the UAE, and other Gulf states—documented in the WEF Barometer—extend beyond technology to encompass travel facilitation, diaspora connectivity, and tourism promotion. These bilateral and trilateral arrangements deliver results far faster than waiting for global tourism frameworks to evolve.
The September 2025 launch of the FIT Partnership represents the clearest articulation of this minilateral approach to travel economy growth. Co-convened by New Zealand, Singapore, the United Arab Emirates, and Switzerland, this coalition brings together 14 trade-dependent economies committed to safeguarding economic integration benefits amid rising protectionism. Tourism features prominently in the FIT agenda, with working groups addressing visa facilitation, professional services mobility, and digital platform interoperability.
UN Conference on Trade and Development analysis suggests these minilateral tourism initiatives are achieving concrete results. Processing times for tourist visas among ASEAN nations have dropped 40% since 2023. Mutual recognition agreements for hospitality qualifications allow workers to move more freely across borders, addressing labor shortages that constrained tourism growth. Coordinated destination marketing campaigns pool resources for greater global impact.
Importantly, this minilateral approach aligns national interests with regional tourism goals. Countries see clear economic benefits—job creation, foreign exchange earnings, infrastructure development—from deeper tourism cooperation with aligned partners. This “hard-headed pragmatism,” as UN Secretary-General António Guterres termed it, drives cooperation forward even as broader multilateral frameworks struggle.
Follow the Money: Investment Flows Reveal Strategic Priorities
Capital allocation patterns provide perhaps the clearest window into how Asia is strategically capturing travel economy potential. The WEF Barometer documents several critical trends in investment flows that underscore the region’s competitive advantages and deliberate positioning.
Foreign portfolio investment (FPI) has increased continually since 2022, with growth particularly strong in sectors related to tourism infrastructure, hospitality technology, and transportation networks. Cross-border capital flows have ratcheted upward across multiple metrics tracked in the report, suggesting investor confidence in Asia’s travel economy trajectory remains robust despite global uncertainties.
The FDI data tells an especially compelling story. Newly announced greenfield projects have surged in industries directly supporting tourism: data centers and AI infrastructure that power booking platforms and digital services, transportation infrastructure including airports and high-speed rail, hospitality developments, and sustainable tourism projects aligned with climate goals.
OECD investment analysis reveals that much of this capital pipeline is heading to emerging Asian economies, not just traditional destinations like Singapore or established markets like Japan. Vietnam, Indonesia, Thailand, and Philippines are all capturing increased tourism-related FDI as investors recognize their growth potential and improving infrastructure.
The geographic patterns matter enormously. The WEF report notes that greenfield FDI is increasingly flowing between geopolitically aligned partners, with the geopolitical distance of such investments falling faster than traditional trade flows. For tourism, this means countries are prioritizing investment relationships with partners sharing similar regulatory approaches, security frameworks, and development goals.
China’s role in this investment landscape is complex and evolving. While the nation’s share of total announced FDI inflows fell from 9% in 2015-19 to just 3% in 2022-25 according to WEF data, China remains the world’s second-largest source of outbound tourists and a major investor in regional tourism infrastructure through Belt and Road Initiative projects. Chinese tourists spent an estimated $255 billion internationally in 2024, with the vast majority of this expenditure occurring within Asia.
Meanwhile, Gulf sovereign wealth funds are deploying capital strategically across Asian tourism markets. The UAE’s advanced technology cooperation framework with the US, signed in May 2025, explicitly encompasses tourism technology investments. Gulf capital is flowing into luxury hospitality developments, aviation infrastructure, and tourism-related real estate across South and Southeast Asia.
Remittances, tracked as a percentage of GDP in the WEF Barometer, have also grown steadily, reflecting robust labor migration flows that include substantial numbers of tourism and hospitality workers. These financial flows create circular benefits: workers send money home, strengthening local economies and creating new outbound tourism demand, while gaining skills and international experience that elevate service quality across the region.
The report documents that international students as a percentage of population grew more than any other innovation and technology metric in 2024, rising 8% and surpassing pre-pandemic levels. While this encompasses all fields of study, tourism and hospitality management programs are major beneficiaries, creating a skilled workforce pipeline for the region’s expanding travel economy.
Challenges and Headwinds: Navigating Turbulence in the Travel Economy
Despite impressive growth metrics, Asia’s travel economy faces meaningful challenges that could constrain future potential. The WEF Barometer candidly documents several concerning trends that policymakers and industry leaders must address.
Official development assistance (ODA) has experienced the sharpest decline among trade and capital metrics, falling 10.8% in 2024 and an estimated additional 9-17% in 2025 according to OECD preliminary data. This matters for tourism because ODA has historically funded essential infrastructure in developing nations—roads, airports, sanitation systems, healthcare facilities—that makes destinations viable and attractive to international visitors.
Only four countries exceeded the UN target of 0.7% of gross national income for development assistance in 2024. Key donors including Germany, the United Kingdom, and the United States cut funding substantially. For tourism-dependent developing nations in Asia, this means greater reliance on private capital and domestic resources to fund the infrastructure investments required for competitiveness.
Labor migration, after growing uninterruptedly since 2020, appears to be approaching an inflection point. The global stock of labor migrants grew in 2024, but the WEF report notes signs of a slowdown, with new migration flows to OECD countries weakening by 4%. In 2025, a sharp contraction occurred: net migration inflows into the US and Germany—major source markets for both tourists and tourism workers—fell by an estimated 65% and 39% respectively compared to 2024.
This creates a double challenge for Asia’s travel economy. Reduced immigration to developed nations may constrain the number of potential tourists visiting Asia while simultaneously limiting opportunities for Asian hospitality workers to gain international experience and send remittances home. The WEF data shows international labour migration as a percentage of population may be peaking after strong growth, introducing uncertainty about workforce availability for tourism expansion.
Geopolitical tensions, documented extensively in the report’s peace and security pillar, cast shadows over travel planning and investment decisions. Every metric in this pillar fell below pre-pandemic levels, with conflicts escalating, military spending rising, and forcibly displaced people reaching a record 123 million globally by end-2024. While these conflicts aren’t primarily occurring in Asia’s major tourism destinations, they contribute to a general climate of uncertainty that affects travel booking patterns and long-term infrastructure investment.
Cyberattacks have intensified across Asia according to the Barometer, with incidents surging across the region in 2024-25. For an increasingly digital travel economy dependent on online bookings, electronic payments, and data-driven personalization, cyber vulnerabilities represent material risks. Hotels, airlines, and travel platforms have all experienced high-profile breaches that erode consumer confidence and impose substantial costs.
Climate change presents perhaps the most fundamental long-term challenge. The WEF report’s climate and natural capital pillar shows that while cooperation on clean technologies increased—enabling record deployment of solar and wind capacity—environmental outcomes continued to deteriorate. Emissions kept rising in 2024, ocean health declined, and growth in protected areas stalled.
For tourism, climate impacts are increasingly tangible: coral reef bleaching threatens diving destinations, extreme weather events disrupt travel plans, sea level rise endangers coastal resorts, and heat stress makes some peak-season destinations uncomfortable. The report notes that while emissions intensity (emissions per unit of GDP) is dropping—signaling the world’s ability to deliver economic growth while managing emissions—absolute emissions continue rising, meaning climate risks will intensify.
The challenge of balancing tourism growth with environmental sustainability is acute across Asia. Popular destinations face overtourism pressures, water scarcity issues, waste management challenges, and biodiversity loss. The WEF data shows terrestrial and marine protected areas growth has stalled during 2023-24, marking a reversal from moderate growth since 2020, raising questions about whether conservation priorities are keeping pace with tourism expansion.
Technology’s Double-Edged Sword: AI and Digital Transformation
The innovation and technology pillar of the WEF Barometer rose approximately 3% year-on-year, propelled by increases in data flows and IT trade that directly enable Asia’s travel economy growth. However, this digital transformation introduces both opportunities and complications.
International bandwidth is now four times larger than in 2019, according to International Telecommunication Union data cited in the report. Cross-border data flows and IT services trade continued showing growth—an uninterrupted run since before the pandemic. For tourism, this digital backbone enables seamless online booking, real-time language translation, personalized recommendations, virtual tours, and countless other services that modern travelers expect.
The AI race is driving unprecedented investment in digital infrastructure. Greenfield FDI announcements in data centers reached record highs, estimated at $370 billion globally in 2025 according to the WEF report—up from about $190 billion in 2024. Much of this capacity is being deployed across Asia, with major projects announced in Singapore, India, Malaysia, Indonesia, and other markets.
Bloomberg technology analysis suggests these AI infrastructure investments will drive corresponding increases in cross-border flows of IT goods and services over the near to medium term. For travel companies, this means access to increasingly sophisticated AI tools for dynamic pricing, customer service chatbots, predictive maintenance, fraud detection, and demand forecasting.
Yet the report also documents growing barriers and restrictions on technology flows, especially concerning frontier technologies. Although the flow of international students grew substantially in 2024, rising 8%, this momentum moderated in 2025 with early indicators pointing to contraction. New US F-1 and M-1 student visas declined by 11% in Q1 2025, with similar declines in Australia and Canada.
Controls on frontier technologies and resources have expanded, especially but not limited to those deployed by the US and China. The WEF Barometer notes that collaboration deteriorated in the trade of components of frontier technologies, whose flows are increasingly tied to geostrategic considerations. This creates uncertainty for tourism technology providers dependent on global supply chains for hardware, software, and technical talent.
The “minilateral” pattern reasserts itself here. Collaboration in critical technologies persists among small groups of aligned countries, including new partnerships between the US and partners in Europe, the Gulf, and India for AI and data centers, and China’s new partnerships with the Middle East, Southeast Asia, and Africa for 5G infrastructure and digital platforms.
For Asia’s travel economy, the critical question is whether technology cooperation remains robust enough to support continued digital transformation of the sector. The answer appears to be yes within regional and aligned-partner networks, even as some global technology flows face restrictions.
The Path Forward: Strategic Imperatives for Sustained Growth
In analyzing comprehensive data from the WEF’s Global Cooperation Barometer, several strategic imperatives emerge for Asia to sustain and accelerate its capture of travel economy potential through 2030 and beyond.
First, maintain the minilateral momentum. The report strongly suggests that flexible, purpose-built coalitions deliver results faster and more effectively than traditional multilateral frameworks in the current environment. Tourism stakeholders should prioritize deepening regional agreements like ASEAN’s Digital Economy Framework, expanding initiatives like the FIT Partnership, and creating new special-purpose coalitions around specific challenges like sustainable tourism standards or climate adaptation.
Second, accelerate infrastructure integration. Projects like the LTMS-PIP power-trading scheme and high-speed rail networks create the physical foundation for seamless regional tourism. The WEF data shows capital is flowing toward these investments; policymakers should facilitate this through streamlined permitting, public-private partnerships, and regulatory harmonization. Every additional corridor that reduces travel time and cost between major cities expands the addressable market for tourism businesses across multiple countries.
Third, leverage technology strategically while managing risks. The four-fold increase in international bandwidth since 2019 represents a competitive advantage Asia must exploit through advanced digital tourism services. However, cyber risks require corresponding investment in security infrastructure. Overdependence on any single technology provider or platform creates vulnerabilities; diversification and open standards should be priorities.
Fourth, address the labor challenge proactively. With labor migration flows showing signs of contraction and tourism demand surging, workforce development becomes critical. This means investing in hospitality education, facilitating intra-regional worker mobility through mutual recognition agreements, and deploying automation thoughtfully to augment rather than replace human workers in guest-facing roles where cultural understanding and personal service create differentiation.
Fifth, integrate sustainability from the outset. The WEF report makes clear that environmental outcomes continue deteriorating despite increased cooperation on clean technologies. Tourism growth that degrades the natural and cultural assets attracting visitors is ultimately self-defeating. Asia has an opportunity to lead in sustainable tourism models that other regions will eventually be forced to adopt—creating competitive advantage through early-mover positioning.
Sixth, maintain balanced relationships across geopolitical spheres. The Barometer documents that goods trade is falling between geopolitically distant countries while shifting toward more aligned partners. However, tourism benefits from diversity—travelers seek varied experiences, and dependence on any single source market creates vulnerability. Countries should cultivate tourist arrivals from multiple regions while deepening cooperation with aligned partners on infrastructure and regulation.
Investment Outlook: Where Capital Will Flow Through 2030
UN World Tourism Organization projections, combined with WEF Barometer data, suggest several high-probability investment themes for Asia’s travel economy through 2030:
Digital infrastructure and AI deployment will continue attracting substantial FDI, with the $370 billion in data center announcements for 2025 representing just the beginning of a multi-year build-out. Travel booking platforms, personalization engines, and customer service automation will all see increased capital allocation.
Sustainable tourism assets will command premium valuations as environmental awareness grows among travelers and regulatory frameworks tighten. Eco-resorts, carbon-neutral transportation options, and conservation-linked tourism products will attract both impact investors and mainstream capital seeking to capture evolving consumer preferences.
Secondary and tertiary destinations will receive increasing attention as primary destinations face capacity constraints and overtourism concerns. Countries like Vietnam, Cambodia, Laos, and less-developed regions of Indonesia and Philippines offer significant growth potential with lower land costs and substantial room for infrastructure investment.
Healthcare and wellness tourism represents a high-growth niche where Asia holds competitive advantages through medical expertise, cost positioning, and integrated wellness traditions. Thailand’s medical tourism success provides a replicable model for neighbors.
MICE (Meetings, Incentives, Conferences, Exhibitions) infrastructure will see continued investment as the WEF data shows services trade growing robustly. Convention centers, exhibition facilities, and business-focused accommodation capacity remain undersupplied relative to demand in many Asian markets.
The capital is available—foreign portfolio investment and cross-border capital flows continue increasing according to the Barometer. The question is whether institutional frameworks, regulatory clarity, and infrastructure readiness can channel this capital productively into sustainable tourism growth.
Conclusion: Asia’s Defining Decade
The evidence compiled in the World Economic Forum’s 2026 Global Cooperation Barometer reveals an inflection point in global tourism economics. Asia isn’t simply recovering from pandemic disruptions or returning to previous growth trajectories. The region is fundamentally restructuring how tourism operates through strategic infrastructure investments, pragmatic regional cooperation that bypasses struggling multilateral frameworks, and aggressive positioning to capture technology-enabled service delivery advantages.
The $1.2 trillion in current tourism revenue is merely a milestone on a trajectory toward Asia capturing well over 40% of global travel expenditure by decade’s end. This represents one of the largest peacetime transfers of economic activity in modern history, with implications reaching far beyond hotel occupancy rates and airline bookings.
For the 4.5 billion people living across the Asia-Pacific region, this travel economy boom translates into millions of jobs, infrastructure improvements benefiting residents and visitors alike, accelerated technology adoption, and rising incomes that enable broader segments of Asian populations to travel themselves—creating virtuous cycles of growth.
The challenges are real: declining development assistance, labor migration constraints, geopolitical tensions, climate risks, and technology governance questions all cloud the outlook. Yet the WEF data suggests Asia’s strategic approach—minilateral cooperation, infrastructure integration, balanced partnerships, and interest-based pragmatism—positions the region to navigate these headwinds more successfully than alternatives reliant on struggling global multilateral frameworks.
As one surveyed executive noted in the WEF report, 57% of business leaders don’t perceive overall conditions to have substantially worsened relative to 2024, despite challenges. This resilience, combined with clear-eyed recognition of opportunities, characterizes Asia’s approach to capturing its billion-dollar travel economy potential.
The defining question for the coming decade isn’t whether Asia will dominate global tourism—the trajectory is clear. Rather, it’s whether the region can sustain this growth through sustainable, inclusive, and resilient models that distribute benefits broadly while preserving the natural and cultural assets that make Asia so compelling to visitors. The answer to that question will shape not just tourism economics, but the broader trajectory of Asian development and global economic rebalancing through 2035 and beyond.
Discover more from The Economy
Subscribe to get the latest posts sent to your email.


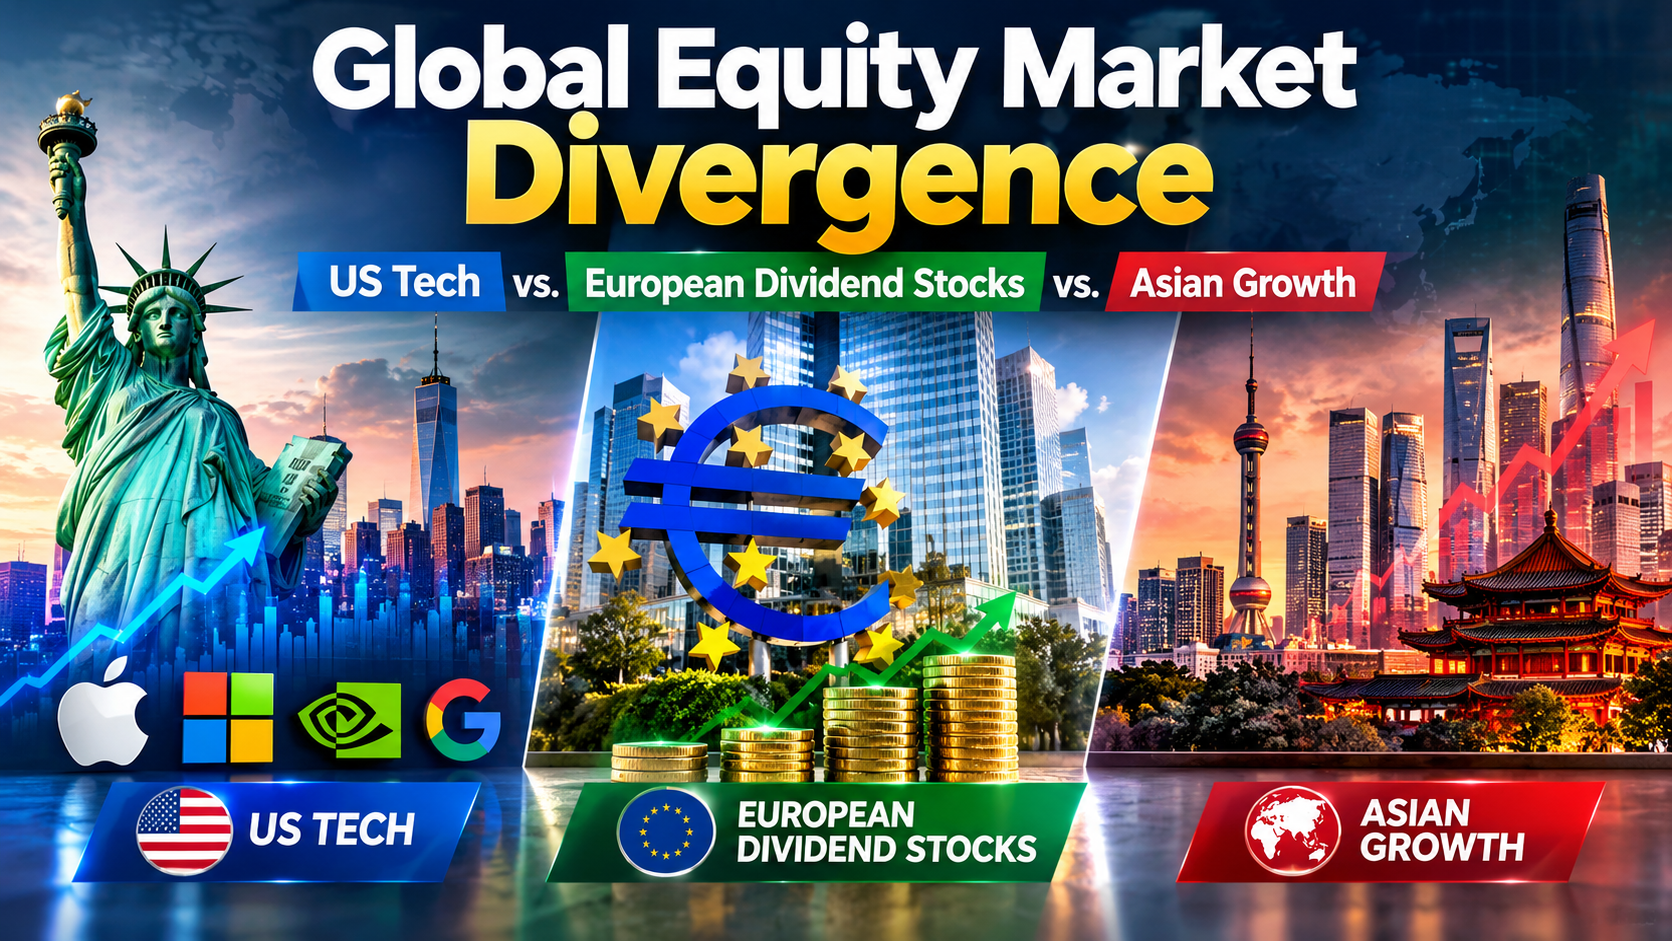
S&P 500 at 7,620, FTSE at 10,698, Nikkei at 64,136. Compare US tech, European dividends and Asian growth as three central banks split on rates.
Executive Summary / Key Takeaways
- The three major regions are now priced off three different monetary regimes: the Fed hiking into strength, the ECB hiking into weakness, and the Bank of Japan normalising from near zero.
- On the day of the Fed’s hike, the Dow fell more than 600 points while the Nasdaq finished close to flat — a clean demonstration that “US equities” is no longer a single exposure.
- European indices held up: the FTSE 100 sat at 10,697.57 (+0.44%) while the DAX at 25,440.81 and Euro Stoxx 50 at 6,260.38 slipped.
- Japan outperformed on currency mechanics, with the Nikkei at 64,136 and the Topix at 4,094.
- Yardeni Research cut its year-end S&P 500 target to 7,900 from 8,400, citing yield pressure from rising energy prices.
Regional equity allocation has spent a decade being a low-conviction decision. Global indices moved together, US technology led, and everything else was a funding source. September 2026 broke that pattern within a single trading week.
The trigger was monetary divergence. The Federal Reserve raised rates to 3.75%–4.00% on 16 September. The ECB had already lifted its deposit rate to 2.5% on 10 September. The Bank of England held at 3.75% on a 6-3 split on 17 September, and the Bank of Japan is expected to hike on 18 September.
Four decisions, four different directions of travel, four different equity responses. That is the environment retail investors and portfolio managers now have to allocate into.
2. Core Market Analysis
2.1 The comparison matrix
| Region / Index | Level | Move | Monetary regime | Primary source |
|---|---|---|---|---|
| S&P 500 (US) | 7,619.98 | -0.48% | Fed tightening; ≥1 more hike signalled | Yahoo Finance |
| Nasdaq Composite (US) | 26,186.41 | -0.56% | Duration-sensitive; held up on Fed day | Yahoo Finance |
| Dow Jones (US) | 52,421.20 | -0.29% | Fell 600+ pts on the hike itself | Yahoo Finance |
| FTSE 100 (UK) | 10,697.57 | +0.44% | BoE on hold at 3.75% | Yahoo Finance |
| DAX (Germany) | 25,440.81 | -0.50% | ECB at 2.5% deposit rate | Yahoo Finance |
| CAC 40 (France) | 8,117.78 | -0.76% | ECB at 2.5% deposit rate | Yahoo Finance |
| Euro Stoxx 50 | 6,260.38 | -1.02% | Weakest major European print | Yahoo Finance |
| Nikkei 225 (Japan) | 64,136 | +0.33% | BoJ normalising; weak yen tailwind | Trading Economics |
| Hang Seng (HK) | 24,713 | +0.2% | Pegged; HKMA hiked to 4.25% | Trading Economics |
| VIX | 17.10 | +7.95% | Volatility bid but not stressed | Yahoo Finance |
2.2 US: the index is not the market
The single most revealing datapoint of the week was the internal dispersion on Fed day. Stocks turned lower during Warsh’s press conference as markets read his remarks as hawkish, with the Dow leading losses down more than 700 points at one stage — over 1.6% — while the S&P 500 declined 0.4% and the Nasdaq slid just below flat, Yahoo Finance reported.
Conventional rate logic says long-duration growth should suffer most when yields rise. It did not. The cyclical, energy-exposed and rate-sensitive parts of the market took the damage instead: J.B. Hunt Transport fell 12.64% after warning on earnings and rising operating costs, Diamondback Energy dropped 8% amid concerns over inflation, rising Treasury yields and crude-market geopolitical risk, and APA Corp fell 5.2%, according to TheStreet’s market coverage. Optical and photonics names rebounded, with Coherent and Lumentum each up around 6%.
The forward view has been trimmed. Yardeni Research cut its year-end S&P 500 target to 7,900 from 8,400 — implying 4.1% upside from Tuesday’s close of 7,585.73 rather than the 11% its previous estimate implied — citing higher Treasury yields due to rising energy prices and increased downturn risk over the next three to six months, CNBC reported.
2.3 Europe: the dividend case
European equities are not outperforming on growth. Euro-area output is projected around 1.3% for 2026 by the IMF, with the region benefiting less than others from the technology-driven investment boost and lingering energy-price effects still dragging on manufacturing.
They are outperforming, where they are, on payout and valuation. With the ECB deposit rate at 2.5% — the loosest of the major blocs — the yield competition from cash and short-dated bonds is materially weaker in Europe than in the US, where the funds rate is now 3.75%–4.00% and the 10-year has topped 5%. That relative-yield arithmetic is the structural argument for European income equity in this cycle, and it holds regardless of European growth being mediocre.
The UK sits awkwardly between the two. The FTSE’s commodity and energy weighting makes it a partial beneficiary of the same oil shock hurting importers elsewhere, which explains its positive print against a broadly weaker European tape.
2.4 Asia: growth with a currency asterisk
Japan’s advance came from yen weakness after the Fed decision, which improved the earnings outlook for export-focused industries, Trading Economics noted. Hong Kong’s caution came from the HKMA following the Fed with a hike to 4.25%, pressuring property.
The regional growth case is real — East Asia and Pacific is projected at 4.2% for 2026 and South Asia at 6.3% by the World Bank — but a meaningful share of recent Japanese equity return has been a currency effect that BoJ normalisation will erode.
3. Structural Drivers and Competitor Gaps
The gap in most comparative coverage is treating this as a regional rotation call. It is better understood as three separate factor exposures that happen to have geographic labels:
- US large-cap technology is a duration and AI-capex exposure. It held up on Fed day because the AI investment cycle is currently a stronger driver than the discount rate. Both the IMF and World Bank cite broader AI adoption as the principal upside risk to global growth. If that capex cycle cools, the rate sensitivity reasserts itself immediately.
- European income equity is a relative-yield exposure. Its attractiveness is a function of the ECB-Fed policy gap, not of European fundamentals. Narrow the gap and the case weakens.
- Asian growth equity is partly a currency exposure. Particularly in Japan, where the return decomposition between earnings and FX is doing more work than most allocators acknowledge.
Correctly labelled, these are not substitutes for one another. The diversification benefit of holding all three is higher in 2026 than at any point in the past decade — which is the practical conclusion most aggregator coverage fails to reach.
4. Key Implications for Stakeholders
Retail investors. A global index fund currently buys you a heavy weighting to a single factor: US technology and its AI capital-expenditure cycle. If that is the intended exposure, fine. If not, deliberate regional allocation is required to get it.
Portfolio managers. Volatility is bid but not stressed, with the VIX at 17.10 — an unusually calm reading given four central bank decisions in eight days and crude above $100. That combination favours adding hedges while they remain inexpensive rather than after a repricing.
Income investors. The yield hurdle is regional now. In the US, equity income competes against a 10-year above 5%. In the euro area, it competes against a 2.5% deposit rate. The same dividend yield is a materially better proposition in one market than the other.
Risk teams. Cross-regional correlation assumptions built on the 2015–2021 regime are stale. Three distinct monetary cycles produce genuinely differentiated drawdown paths.
5. Frequently Asked Questions
Q1: Why did the Nasdaq hold up while the Dow fell after the Fed hike?
The damage concentrated in cyclical, transport and energy-exposed names rather than long-duration technology. Investors are currently treating the AI capital-expenditure cycle as a stronger earnings driver than the discount rate is a valuation headwind.
Q2: Are European dividend stocks more attractive than US equities now?
On relative yield, arguably. The ECB deposit rate is 2.5% against a US funds rate of 3.75%–4.00% and a 10-year Treasury above 5%, so European equity income faces far weaker competition from cash and bonds. European growth, however, remains around 1.3%.
Q3: What is the current S&P 500 level and forecast?
The S&P 500 was at 7,619.98. Yardeni Research cut its year-end target to 7,900 from 8,400, implying roughly 4% upside, citing higher Treasury yields driven by rising energy prices.
Q4: Which region offers the best equity growth in 2026?
Asia on headline growth — East Asia and Pacific at 4.2% and South Asia at 6.3% per World Bank forecasts. But a meaningful share of recent Japanese equity returns reflects yen weakness rather than earnings, and Bank of Japan normalisation erodes that tailwind.
Discover more from The Economy
Subscribe to get the latest posts sent to your email.
Markets & Finance
Asian Markets Analysis: Navigating Volatility in China, Japan, and Singapore Stocks
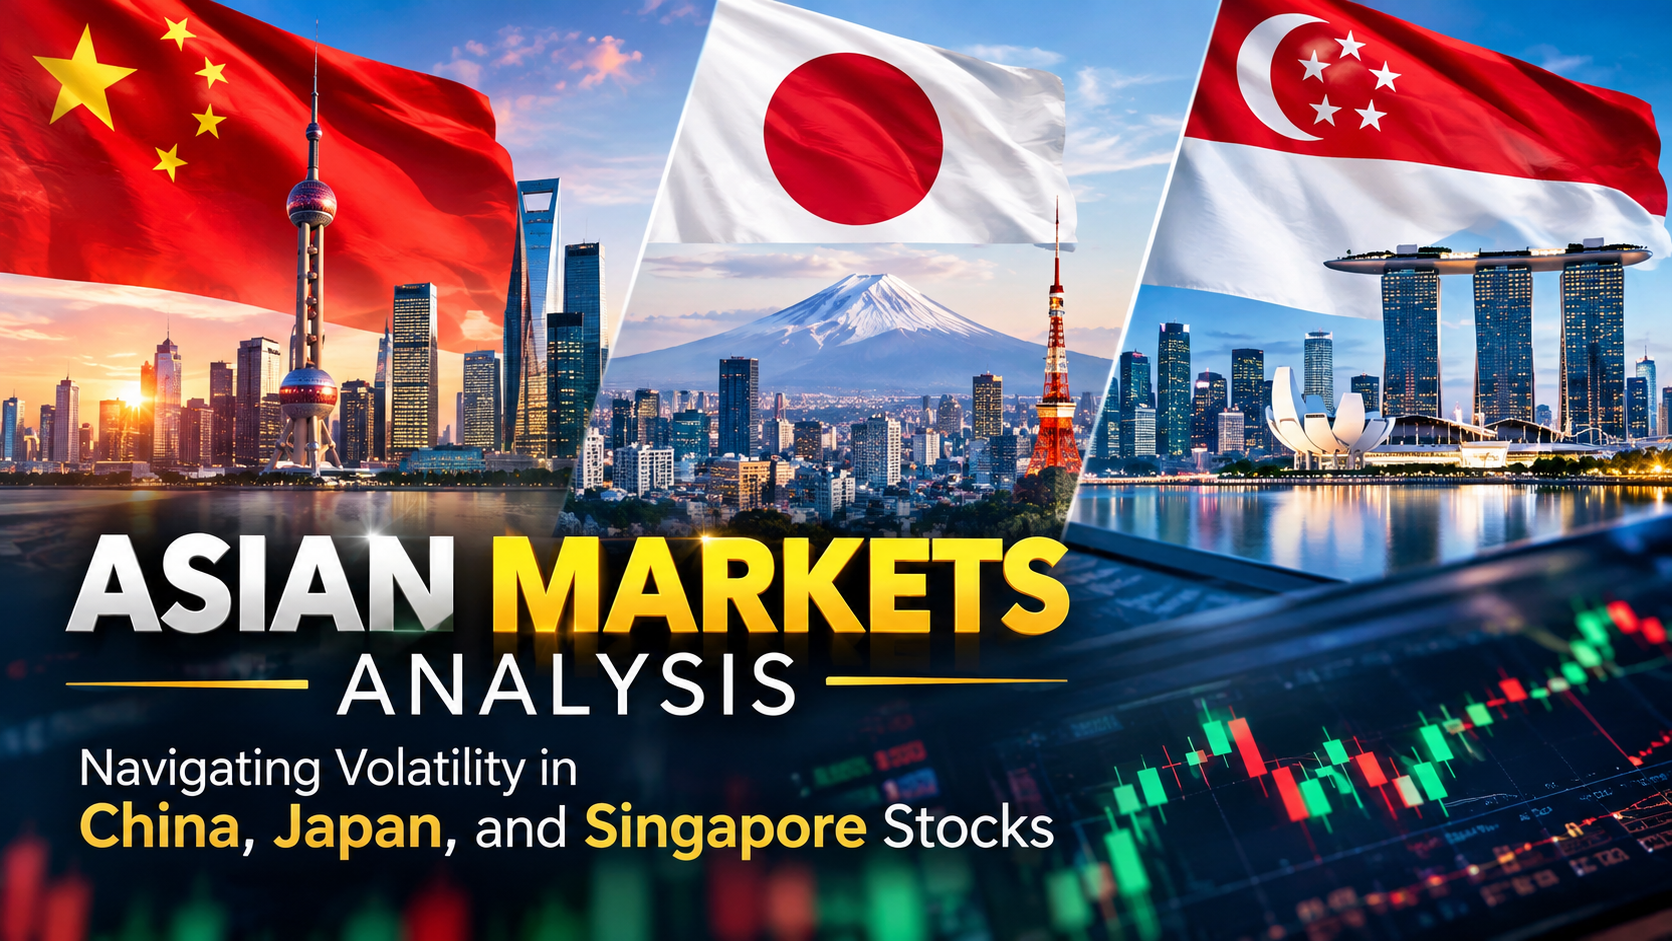
Nikkei at 64,136, Hang Seng at 24,713, HKMA hikes to 4.25%. Inside Asia’s split response to the Fed and where regional equity risk sits now.
Executive Summary / Key Takeaways
- The Nikkei 225 climbed 0.33% to 64,136 on Thursday 17 September, extending gains after the Fed’s hike, with the Topix up 0.8% to 4,094.
- Hong Kong’s Hang Seng closed at 24,713 on Wednesday, up 0.2%, but the Hong Kong Monetary Authority immediately followed the Fed by raising its base rate 25 basis points to 4.25%.
- The Shanghai Composite sits near 3,880 — a different market with a different driver, less exposed to US rate transmission than Hong Kong.
- Japan’s gain and Hong Kong’s caution come from the same event: a weaker yen helps Japanese exporters, while Hong Kong’s currency peg imports US tightening directly into property funding costs.
- The Bank of Japan’s decision on 18 September is the region’s next binary risk.
1. Introduction & Immediate Context
Asia did not react to the Federal Reserve as a bloc this week. It reacted as three distinct monetary regimes, and the dispersion is instructive for anyone running regional equity exposure.
Japanese equities rose. The Nikkei 225 climbed 0.33% to close at 64,136 while the broader Topix advanced 0.8% to 4,094 on Thursday, extending gains from the previous session after the US Federal Reserve delivered a widely expected rate hike, even as it signalled further tightening, Trading Economics reported. The mechanism was currency: the yen weakened against the dollar following the Fed’s decision, improving the earnings outlook for Japan’s export-focused industries.
Hong Kong was more cautious. The market remained wary after the Fed raised rates and signalled the possibility of another hike, strengthening the dollar and pushing Treasury yields higher, according to Trading Economics. The HKMA raised its base rate by 25 basis points to 4.25% following the Fed’s move, weighing on Hong Kong property stocks as higher borrowing costs threatened recovery.
Same catalyst. Opposite outcomes.
2. Core Market Analysis
2.1 Regional index snapshot
| Index | Level | Recent move | Key domestic driver | Source |
|---|---|---|---|---|
| Nikkei 225 (Japan) | 64,136 | +0.33% (17 Sep) | Weaker yen; BoJ decision 18 Sep | Trading Economics |
| Topix (Japan) | 4,094 | +0.8% (17 Sep) | Broad-based exporter strength | Trading Economics |
| Hang Seng (Hong Kong) | 24,713 | +0.2% (16 Sep close) | HKMA rate hike to 4.25% | Trading Economics |
| Shanghai Composite (China) | ~3,880 | -0.13% | Domestic policy, not Fed transmission | Yahoo Finance |
| Shenzhen Component | ~13,361 | -0.17% | Tech and manufacturing weighting | Yahoo Finance |
2.2 Japan: the carry-trade pivot
Japan’s rally has an expiry date attached to it. Japanese ultra-low rates helped finance trillions of dollars in global investments for more than a decade, making the yen one of the world’s cheapest sources of funding — and with the Bank of Japan expected to tighten again this week, that advantage may be entering a new phase, FXStreet noted. Markets widely expect a quarter-point increase to 1.25%.
The Nikkei’s strength this week is therefore borrowed against a currency effect that the BoJ may partially reverse within 24 hours. Gains on Thursday were broad-based, with notable performances from index heavyweights including SoftBank Group, Fujikura, Lasertec, Mitsubishi Heavy Industries and Nintendo. Wednesday’s session had already seen the index climb 0.69% to 63,923 as easing oil prices reduced pressure on equities — relevant for an economy that imports nearly all of its crude.
Japanese equities also benefited from declining oil prices amid expectations that crude flows through Saudi Arabia’s East-West pipeline could resume soon.
2.3 Hong Kong: the peg is the problem
Hong Kong’s dollar peg means the HKMA has no independent rate-setting discretion. When the Fed hikes, Hong Kong hikes — which transmits US monetary policy directly into a property market that has been trying to stabilise for several years.
The equity response was not uniform, however. Technology stocks provided support, with the Hang Seng Tech Index rising 0.9% by midday in the prior session. Zhipu AI surged more than 8%, ending an 11-session losing streak, while MiniMax, SMIC and Hua Hong Semiconductor gained between 5% and 7%. Against that, Xiaomi, Kuaishou and Akeso declined. On Thursday the pattern reversed for large caps: Tencent fell 1.7%, Kingboard Laminates 1.9% and HKEX 1.8%, while Z.AI Co. rose 2.9%, MiniMax 7.1% and Genscript Biotech 14.3%.
CICC has argued that Hong Kong stocks could face greater volatility from renewed US monetary tightening, though the impact should be short-lived unless the Fed begins a sustained rate-increase cycle. Given the dot plot now points to at least one more hike, that caveat is doing considerable work.
3. Structural Drivers and Competitor Gaps
Most regional market write-ups treat “Asian markets” as a single sentiment block. The 2026 reality is a three-regime structure that produces genuinely uncorrelated outcomes:
Regime one — pegged (Hong Kong). Zero monetary autonomy. US rates arrive unfiltered. Property and financials bear the adjustment; technology can decouple on idiosyncratic news flow, as the AI names did this week.
Regime two — normalising (Japan). The BoJ is tightening from a near-zero base for domestic reasons while the Fed tightens for inflation reasons. The interest-rate differential still favours a weak yen, which supports exporters — but each BoJ step narrows that support, and the carry-trade unwind exports volatility into global bond markets rather than into the Nikkei directly.
Regime three — domestically driven (mainland China). The Shanghai and Shenzhen indices moved marginally on the Fed decision. Beijing’s policy cycle, not Washington’s, sets the tone.
The competitor gap worth exploiting is the assumption that a stronger dollar is uniformly negative for Asian equities. It is negative for pegged and dollar-funded markets; it is currently positive for Japanese exporter earnings; and it is close to neutral for onshore China. Capital-flow data, not index correlation, is where the distinction shows.
There is also a structural investment story running underneath the rate noise. Reports highlighted potential financing of around US$2.6 billion for Hong Kong data-centre development, reflecting growing investment in the city’s digital infrastructure. Regional AI and data-centre capex remains the counterweight to monetary tightening across Singapore, Malaysia, Japan and Hong Kong alike.
4. Key Implications for Stakeholders
International equity traders. The Hang Seng’s sensitivity to Fed pricing makes it the cleanest regional expression of a US rate view. If the December hike is delivered, the HKMA follows mechanically and property funding costs rise again.
Wealth managers with Japan exposure. Decide whether your Japanese allocation is a currency trade or an equity trade. Much of the 2026 Nikkei performance has been the former. A BoJ normalisation path that narrows the differential changes the return profile even if Japanese corporate earnings hold.
Singapore-focused allocators. Singapore’s market has been supported through 2026 by AI-linked capital expenditure and semiconductor demand rather than by rate expectations. That makes it the region’s most attractive defensive-growth blend — but also the most exposed if the global technology capex cycle cools, which both the IMF and World Bank flag as the principal downside risk to their outlooks.
Risk managers. The three-regime structure argues for separate regional sleeves rather than a single Asia ex-Japan mandate. Correlation assumptions built on the 2015–2021 period no longer describe this market.
5. Frequently Asked Questions
Q1: How did Asian markets react to the September 2026 Fed rate hike?
Unevenly. Japan’s Nikkei rose 0.33% to 64,136 as a weaker yen helped exporters, while Hong Kong stayed cautious after the HKMA followed the Fed with a 25-basis-point rise to 4.25%, pressuring property stocks. Mainland Chinese indices moved only marginally.
Q2: Why did the Hong Kong Monetary Authority raise rates?
The Hong Kong dollar’s peg to the US dollar removes independent rate-setting discretion, so the HKMA moves in step with the Federal Reserve. Its base rate rose to 4.25% immediately after the Fed’s September decision.
Q3: What is the Nikkei 225 level now?
The Nikkei 225 closed at 64,136 on 17 September 2026, up 0.33%, with the Topix at 4,094. The index has been supported by yen weakness and easing oil prices.
Q4: What is the biggest near-term risk to Asian equities?
The Bank of Japan’s decision on 18 September and the potential unwinding of the yen carry trade, which has already contributed to higher long-dated yields in the US and Europe.
Discover more from The Economy
Subscribe to get the latest posts sent to your email.

Key Takeaways
- The KSE-100 Index gained roughly 44% in rupee terms (46–48% in U.S. dollar terms) in fiscal year 2026 — outperforming nearly every major asset class for a third consecutive year.
- The index touched an intraday high of 189,167 in January 2026 before a sharp correction to 146,480 in March amid the Iran-U.S./Israel conflict and a related oil-price spike, then recovered above 180,000 by mid-2026.
- Over FY24–FY26 combined, the KSE-100 has returned 335% in rupee terms (347% in USD terms) — a run analysts attribute to macroeconomic stability under Pakistan’s IMF program, policy continuity, and the country’s return to international debt markets.
- One heavyweight, United Bank Limited (UBL), became Pakistan’s largest listed company by market cap in early 2026, overtaking Oil & Gas Development Company (OGDC).
- Foreign investors were net sellers of roughly $895 million during FY26 even as the index rallied — the gains have been driven overwhelmingly by local institutional and retail buying.
The FY26 Numbers at a Glance
| Metric | FY26 Figure |
|---|---|
| KSE-100 return (PKR) | ~44% |
| KSE-100 return (USD) | ~46–48% |
| 3-year cumulative return (FY24–26, PKR) | 335% |
| 3-year cumulative return (FY24–26, USD) | 347% |
| Intraday high | 189,167 (Jan 23, 2026) |
| Intraday low | 146,480 (Mar 9, 2026) |
| Foreign investor flow | –$895 million (net selling) |
What Drove the Rally
- Macro stability under the IMF program. Rating upgrades, prudent monetary and fiscal policy, and Pakistan’s successful return to international capital markets have all been cited by brokerages (AKD Research, Topline Securities) as core drivers.
- Record monthly remittances. May 2026 remittances hit an all-time high of $4.3 billion, coinciding with the index pushing back above the 180,000 level.
- A geopolitical shock and recovery. The Iran-U.S./Israel conflict triggered a sharp petroleum-price surge and a 29% intra-year swing in the index, but a subsequent MoU on the conflict helped markets recover to pre-war levels by mid-April 2026.
- Sector rotation. Sugar, jute, and transport stocks outperformed the broader market in FY26, while vanaspati, synthetic rayon, and woollen sectors lagged.
Where the Market Stands Now
By mid-September 2026, the KSE-100 was trading in the high-160,000s to near-170,000 range, with brokerage forecasts split between roughly 203,000 (Topline) and a more bullish 263,800 (AKD Research) by December 2026 — a projection that, if realized, would push the index past a historic $100 billion market capitalization for the first time.
The Risk Side of the Ledger
- Foreign capital remains cautious. Nearly $900 million in net foreign selling during a rally this strong suggests international institutions are not yet convinced the move is durable.
- Geopolitical sensitivity. The March 2026 drawdown showed how quickly regional conflict risk (in this case, the Iran-Israel-U.S. situation) can hit the index given Pakistan’s exposure to oil-price shocks.
- Concentration risk. A handful of heavyweights — UBL, OGDC, Engro, HBL, Lucky Cement, Bank Alfalah — have driven a disproportionate share of index gains.
How did the Pakistan Stock Exchange perform in FY26?
The KSE-100 Index gained approximately 44% in rupee terms (46–48% in USD terms) in fiscal year 2026, marking a third consecutive year of outperformance versus other major asset classes, despite a sharp mid-year correction tied to the Iran-U.S./Israel conflict.
Discover more from The Economy
Subscribe to get the latest posts sent to your email.

VIX Index Explained: How to Trade Wall Street’s Fear Gauge Today

Commercial vs Residential Real Estate: Which Wins in 2026?

Presidential Stock Market Performance: How Trump’s Second Term Compares to History

2026 Real Estate Market News: Are We Heading for a Correction?

Bitcoin Price Forecast 2026–2027: Will the 4-Year Cycle Hold?

Fidelity Crypto vs. Traditional Brokerages: A Guide for Modern Investors

The 2026 Global Smartphone Market: AI Integration and Competitor Analysis

SpaceX IPO: How Aerospace Is Reshaping Tech Startup News

Fidelity Investments Review: Maximizing Returns in a Volatile Stock Market

How Crypto Transformed the Trump Fortune: A $1.4 Billion Financial Breakdown

Global Pension Systems Ranked: The World’s Best and Worst Retirement Frameworks

Global Supply Chain Vulnerabilities: From Eurasian Trade Corridors to Food Consumer Recalls

Why 5% U.S. Treasury Yields Signal a Global Market Regime Shift.

Federal Reserve Defies White House Pressure: Inside Trump’s Demand for Sub-1% Interest Rates After Historic 2026 Rate Hike

State Farm’s $5B Dividend 2026: Who Qualifies & Payout Dates

US-China Relations in Q3 2026: Trade Tariffs and Supply Chain Risks

Top 30 Stocks for Investment in PSX for Massive ROI in 2026

SpaceX Starship Flight 14: First Orbital Attempt & Starlink V3 Launch Explained

The 2026 Crypto Regulatory Shift: What It Means for Institutional Investors

AI Chip Stocks 2026: The Best Semiconductor Investments Beyond Marvell

Tween Back-to-School Trends 2026: What’s Driving the $85B Season

AI-Powered Training: The Next Multi-Billion Dollar Ecosystem in Fitness

Oil Prices Break $100 in 2026: Middle East Conflict & Energy Markets

10-Year Treasury Yield Hits 4.80%: What It Means for Rates & Portfolios

Fidelity Investments Review 2026: SPAXX Yields & Zero-Fee Funds

Shein Clothes Quality & Safety in 2026: What Lab Tests Show

MRVL Earnings 2026: Why Marvell Sank Despite Beating Estimates

BRICS+ Cross-Border Payments 2026: Interoperability Explained
-

 Markets & Finance9 months ago
Top 15 Stocks for Investment in 2026 in PSX: Your Complete Guide to Pakistan’s Best Investment Opportunities
-

 Analysis7 months ago
Johor’s Investment Boom: The Hidden Costs Behind Malaysia’s Most Ambitious Economic Surge
-

 Analysis7 months ago
Top 10 Stocks for Investment in PSX for Quick Returns in 2026
-

 Analysis8 months ago
Brazil’s Rare Earth Race: US, EU, and China Compete for Critical Minerals as Tensions Rise
-

 Banks8 months ago
Best Investments in Pakistan 2026: Top 10 Low-Price Shares and Long-Term Picks for the PSX
-

 Investment8 months ago
Top 10 Mutual Fund Managers in Pakistan for Investment in 2026: A Comprehensive Guide for Optimal Returns
-

 Global Economy9 months ago
15 Most Lucrative Sectors for Investment in Pakistan: A 2025 Data-Driven Analysis
-

 Global Economy9 months ago
Pakistan’s Export Goldmine: 10 Game-Changing Markets Where Pakistani Businesses Are Winning Big in 2025