
Analysis
10 Ways ASEAN Could Be Instrumental in Competing with the US Dollar Through a Common Currency for Economic Stability
This article discovers 10 powerful ways an ASEAN common currency could challenge US dollar dominance, reduce regional vulnerability, and drive ASEAN economic stability — backed by 2026 data, policy frameworks, and forward-looking analysis.
Introduction: The Dollar’s Grip Is Loosening — And ASEAN Is Watching Closely
For nearly eight decades, the US dollar has been the undisputed axis of global commerce. Roughly 88% of all foreign exchange transactions still involve the greenback, according to the Bank for International Settlements. But across Southeast Asia, something quietly tectonic is underway.
In boardrooms from Jakarta to Kuala Lumpur, and in the policy corridors of the ASEAN Secretariat, a once-fringe conversation has turned urgent: what would it take for Southeast Asia to build a monetary architecture less tethered to Washington’s fiscal cycles, Federal Reserve rate decisions, and geopolitical preferences?
The numbers are compelling. AMRO-ASIA.org’s 2026 Regional Economic Outlook projects ASEAN+3 growth at 4.0% in 2026, outpacing advanced economies by a considerable margin. ASEAN’s digital economy is on track to hit $560 billion by 2030 per the World Economic Forum. Local Currency Settlement (LCS) transactions have more than doubled, now accounting for an estimated 15% of intra-regional trade flows, up from under 7% in 2021.
An ASEAN common currency — or at minimum, a deeply integrated ASEAN currency framework — is no longer a utopian thought experiment. It is a strategic imperative gaining institutional momentum. This analysis explores ten actionable, data-grounded pathways through which ASEAN could leverage monetary integration to challenge dollar dominance and build lasting ASEAN economic stability.
1. Building a Regional Payment Connectivity Infrastructure That Bypasses SWIFT
The most immediate lever available to ASEAN is not a single currency, but a shared payments rail that reduces the transactional footprint of the dollar. The Regional Payment Connectivity (RPC) initiative, linking real-time payment systems across Indonesia, Malaysia, the Philippines, Singapore, and Thailand, is already live. By 2025, QR-code cross-border payments between these nations had processed over $4 billion in cumulative transactions without a single dollar intermediating the exchange.
Project Nexus, developed under the BIS Innovation Hub, takes this further by creating a multilateral, instant payment network across ASEAN member central banks. When payment infrastructure no longer defaults to dollar-clearing, the cognitive and institutional bias toward dollar invoicing weakens — and that behavioral shift is where ASEAN de-dollarization truly begins.
The lesson from Europe is instructive: SEPA (Single Euro Payments Area) preceded full monetary union, normalizing euro-denominated transactions before the currency itself matured as a reserve asset. ASEAN’s RPC is playing that exact role today.
2. Scaling Local Currency Settlement Frameworks Between Bilateral Pairs
Before any multilateral ASEAN monetary union is politically feasible, bilateral local currency frameworks are quietly rewiring trade finance. Japan and Indonesia formalized a yen-rupiah settlement corridor in 2023, allowing direct conversion without dollar intermediation. China-Malaysia ringgit-yuan corridors, Thailand-India baht-rupee agreements, and Singapore’s multi-currency MAS frameworks have followed in rapid succession.
According to the Asian Development Bank’s Asian Economic Integration Report 2025, local currency transactions in ASEAN as a share of total bilateral trade have risen by approximately 8 percentage points since 2020. The key insight: each bilateral corridor reduces the marginal cost of a future multilateral settlement system, essentially pre-building the plumbing of regional monetary union one pipe at a time.
| Framework | Currency Pair | Trade Volume (2025 est.) | USD Bypassed? |
|---|---|---|---|
| Japan-Indonesia LCS | JPY-IDR | ~$18B | Yes |
| China-Malaysia | CNY-MYR | ~$32B | Yes |
| India-Thailand | INR-THB | ~$9B | Yes |
| Singapore MAS Multi-FX | SGD-basket | ~$55B | Partial |
3. Leveraging CBDCs and mBridge to Create a De Facto ASEAN Digital Currency Layer
Central Bank Digital Currencies (CBDCs) may be the most underappreciated vehicle for ASEAN currency integration. The mBridge project — a multi-CBDC platform co-developed by the central banks of China, Hong Kong, Thailand, and the UAE under BIS coordination — has already completed pilot transactions worth over $22 million in wholesale cross-border settlements.
More significantly, Thailand’s Bank of Thailand and Singapore’s MAS are both advancing retail CBDC frameworks with interoperability protocols designed for regional use. If ASEAN’s ten central banks converge on a common CBDC interoperability standard — even without a single currency — the practical effect would be a synthetic “ASEAN digital currency layer” enabling seamless cross-border payments in ASEAN at near-zero cost and without dollar conversion.
The IMF’s 2025 Working Paper on CBDC Cross-Border Implications notes that multi-CBDC arrangements can reduce FX transaction costs by up to 50% and settlement times from two days to under ten seconds. For a region conducting $3.8 trillion in annual intra-regional trade, that efficiency dividend is enormous — and denominated in local currency, not dollars.
4. Establishing an ASEAN Monetary Fund as a Credible Backstop
One of the dollar’s most durable advantages is not transactional but psychological: it is the currency of last resort. When crises hit — as they did for Thailand in 1997, Indonesia in 1998, or regionally during COVID-19 — nations scramble for dollar liquidity. An ASEAN common currency or even a deep currency cooperation framework requires an equally credible regional lender of last resort.
The Chiang Mai Initiative Multilateralisation (CMIM), currently sized at $240 billion, represents the seed of such an institution. But its activation threshold remains politically high — historically requiring IMF co-conditionality — and it has never been fully drawn upon. Reforming CMIM into a more autonomous, rapidly deployable ASEAN Monetary Fund, modeled on the European Stability Mechanism (ESM), would provide the credibility backstop that a regional currency requires.
The ADB estimates that deepening CMIM and reducing its IMF linkage could cut member nations’ precautionary reserve holdings by 15-20% — freeing up hundreds of billions in dollar reserves currently sitting idle as insurance policies.
5. Reducing Commodity Invoicing in Dollars Through Petrochemical and Agricultural Benchmarks
ASEAN is one of the world’s most commodity-rich regions — the top exporter of palm oil, a major LNG producer, and a growing force in critical minerals essential for the energy transition. Yet nearly all of these commodities are priced and invoiced in US dollars, a structural dependency that amplifies currency volatility for producing nations whenever the Fed tightens policy.
An ASEAN commodity pricing benchmark — beginning with palm oil, which Malaysia and Indonesia effectively control as a duopoly — denominated in a basket of regional currencies or an ASEAN unit of account, could begin the process of de-linking commodity flows from dollar pricing. This is not unprecedented: the euro has steadily gained ground as an invoicing currency in European energy markets since the early 2000s, reducing eurozone nations’ exposure to dollar energy shocks.
Indonesia’s President Joko Widodo’s 2022 push to price nickel exports in non-dollar terms was politically bold but logistically premature. By 2026, with deeper regional payment rails in place, the infrastructure conditions for ASEAN vs US dollar dominance in commodity pricing are maturing meaningfully.
6. Harmonizing Capital Market Regulations to Attract Intra-ASEAN Investment in Local Currency
ASEAN financial resilience requires not just payment systems but deep, liquid capital markets denominated in regional currencies. Currently, ASEAN’s bond markets are fragmented, illiquid at the regional level, and heavily reliant on dollar-denominated issuance to attract foreign capital. The ASEAN+3 Bond Market Initiative (ABMI) has made progress, but intra-ASEAN bond holdings remain disproportionately low relative to the region’s economic weight.
A harmonized ASEAN capital market framework — common listing standards, mutual recognition of securities, and a unified clearing infrastructure — would enable pension funds, sovereign wealth funds, and insurers to diversify into ASEAN-currency assets at scale. Singapore’s SGX, Bursa Malaysia, and the Stock Exchange of Thailand collectively manage over $1.2 trillion in market capitalization; deeper integration could create a market rivaling the London Stock Exchange in depth.
The WEF’s 2026 ASEAN Competitiveness Report flags regulatory harmonization as the single highest-return, lowest-cost reform available to reduce US dollar dependence in ASEAN — yet one where political will remains the binding constraint.
7. Using the ACU (ASEAN Currency Unit) as a Basket Reference Unit Before Full Union
History suggests that successful currency unions pass through a reference unit phase before full monetary integration. The European Currency Unit (ECU), a weighted basket of EC member currencies, operated from 1979 to 1999 — a twenty-year normalization period during which markets, contracts, and institutions built comfort with a pan-European monetary reference.
An ASEAN Currency Unit (ACU) — a GDP-weighted or trade-weighted basket of member currencies — could serve a similar bridging function today. It would not require surrendering monetary sovereignty (the ECU never did), but it would provide a common reference for intra-ASEAN contracts, bond issuances, and ultimately central bank reserve allocations. Over time, as ACU-denominated markets deepen, the ACU could organically evolve toward a transactional currency.
Academic research published on ResearchGate by Plummer & Chia (2024) modeling optimal ASEAN currency basket weights suggests that a trade-weighted ACU would have reduced exchange rate volatility for member nations by an estimated 22-31% during the 2020-2024 period of dollar strength — a powerful empirical case for its adoption.
8. Anchoring ASEAN Currency Integration to the Digital Economy Boom
ASEAN’s digital economy is the region’s most compelling growth narrative — and arguably its most powerful argument for ASEAN currency integration. A $560 billion digital economy by 2030 will generate billions of micro-transactions, platform payments, and cross-border digital service flows that are inherently inefficient to route through dollar FX conversion.
Grab, Sea Limited, GoTo, and Lazada together process hundreds of millions of transactions annually across multiple ASEAN currencies. The FX conversion friction in these ecosystems represents both a cost and a strategic vulnerability: dollar strengthening directly erodes the purchasing power of consumers and merchants transacting in baht, rupiah, ringgit, and peso.
A unified ASEAN digital payment token — not necessarily a legal tender replacement, but a layer-two settlement mechanism for digital commerce — could eliminate this friction entirely. Singapore’s MAS has been quietly piloting exactly this through its Project Ubin and subsequent initiatives, and the Financial Times has reported growing private sector appetite among ASEAN fintechs for a regional stablecoin framework backed by a basket of central bank reserves.
9. Coordinating Monetary Policy Through an Enhanced ASEAN+3 Macroeconomic Framework
ASEAN economic stability ultimately requires more than infrastructure — it requires policy coordination. One of the most persistent criticisms of any ASEAN monetary union proposal is the region’s structural heterogeneity: Singapore’s per capita GDP exceeds $80,000; Myanmar’s barely clears $1,200. A one-size-fits-all monetary policy would be genuinely destabilizing for the weaker economies.
But coordinated monetary policy — a middle path between full union and complete independence — is both feasible and urgently needed. The AMRO (ASEAN+3 Macroeconomic Research Office) already serves as a regional surveillance body, publishing quarterly assessments of member economies. Empowering AMRO with formal policy coordination mandates — analogous to the ECB’s role before it assumed full monetary authority — could enable synchronized interest rate corridors, coordinated FX intervention frameworks, and a regional inflation target that reduces policy divergence over time.
AMRO’s 2026 projections showing ASEAN+3 growth at 4.0% amid global headwinds demonstrate that the region already moves with a degree of macroeconomic synchronicity that underpins the case for deeper coordination.
10. Deploying ASEAN’s Geopolitical Moment to Build Institutional Legitimacy
Perhaps the most undervalued driver of ASEAN de-dollarization is geopolitical timing. The fracturing of the post-Cold War US-led financial order — accelerated by the weaponization of dollar-clearing systems against Russia in 2022, US-China decoupling pressures, and the Global South’s growing frustration with IMF conditionality — has created a window of institutional legitimacy for regional monetary alternatives that did not exist a decade ago.
ASEAN’s non-aligned tradition, its “ASEAN Way” of consensus-building, and its position as a credible neutral party in US-China competition make it uniquely placed to lead a monetary architecture that is neither a dollar replacement nor a yuan vehicle, but something genuinely multipolar. The WEF’s 2026 analysis on ASEAN strategic autonomy frames this moment as a “once-in-a-generation” opportunity for the region to shape global financial norms rather than merely comply with them.
Indonesia — the world’s fourth most populous nation, G20 member, and 2023 ASEAN Chair — has increasingly articulated a vision of ASEAN currency leadership as part of its broader Global South positioning. With ASEAN’s combined GDP crossing $4.5 trillion in 2025 and the region on track to become the world’s fourth-largest economic bloc by 2030, the geopolitical credibility to back institutional monetary ambition is materially present.
Conclusion: Not If, But When — And How Carefully
The question facing ASEAN’s finance ministers, central bankers, and heads of government is not whether a common currency or deep monetary integration is desirable in principle. Most economists agree it is. The question is sequencing: building the payment rails first, then the settlement frameworks, then the reference currency unit, then the institutional governance — and doing each step well enough that markets, not just politicians, begin to trust the architecture.
The euro’s cautionary tale is relevant here. Its design flaws — a monetary union without fiscal union — nearly tore the eurozone apart in 2010-2012. ASEAN must learn from that near-catastrophe: any ASEAN common currency must be accompanied by adequate fiscal transfer mechanisms, flexible convergence criteria that respect member diversity, and democratic accountability structures that prevent technocratic overreach.
But the trajectory is unmistakable. Cross-border payments in ASEAN are growing, dollar invoicing is declining at the margin, CBDC interoperability is advancing, and the geopolitical wind is at the region’s back. An ASEAN monetary framework competitive with — not necessarily replacing — the US dollar is not a fantasy. It is a project already underway, gathering institutional mass and market momentum with every bilateral LCS agreement, every mBridge pilot transaction, and every digital payment processed in baht instead of dollars.
The dollar will not fall. But its monopoly is ending. And Southeast Asia is positioning itself to shape what comes next.
Key Sources & Further Reading
- AMRO-ASIA.org — ASEAN+3 Regional Economic Outlook 2026
- IMF.org — Dollar Dominance in Trade and Finance
- ADB.org — Asian Economic Integration Report 2025
- WEF.org — ASEAN Strategic Autonomy 2026
- BIS.org — Project Nexus: Enabling Instant Cross-Border Payments
- FT.com — ASEAN Digital Currency Frameworks
- Economist.com — The Future of the Dollar as Reserve Currency
- ResearchGate — Plummer & Chia (2024): Optimal Currency Areas in ASEAN
- ASEANBriefing.com — Local Currency Trade in ASEAN
- ASEAN Exchanges — Currency Resilience Report 2025
Discover more from The Economy
Subscribe to get the latest posts sent to your email.


Analysis
Wall Street Banks Set to Report $40bn Trading Haul as the Iran War Rekindles Market Volatility
Wall Street’s biggest banks are tracking a $40bn Q1 2026 trading bonanza fueled by the Iran war’s oil shock, VIX spike, and Hormuz chaos. Who profits — and who pays the price.
Key Statistics at a Glance
| Metric | Figure | Context |
|---|---|---|
| Combined trading haul | ~$40bn | Q1 2026, top 6 U.S. banks |
| Equities trading (top 5) | $18bn | 2× the aggregate a decade ago |
| Hormuz transit collapse | 94% | Vessel-count drop since strikes |
| Brent crude peak | $110/bbl | Intraday high, March 2026 |
| VIX high (March 2026) | ~32 | From mid-teens pre-conflict |
| S&P 500 YTD (Mar 31) | −7% | Worst start to a year since 2020 |
The Paradox No One Wants to Name
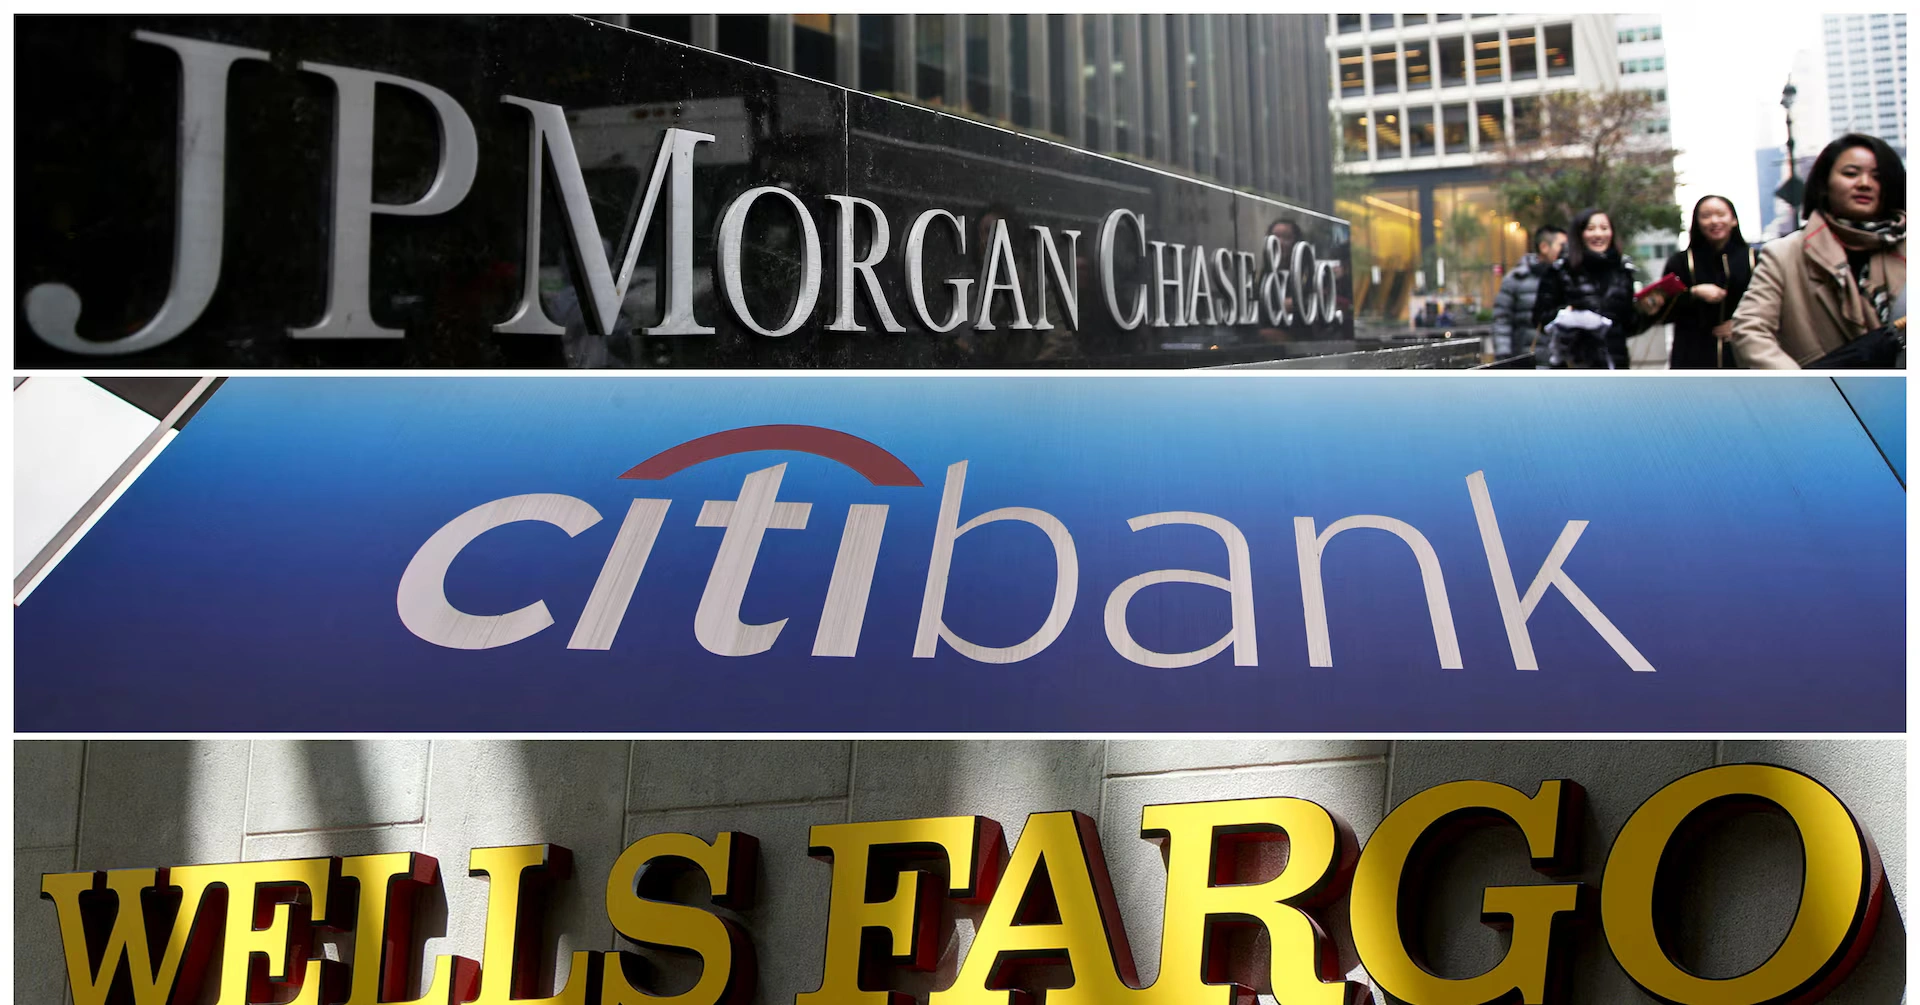
There is a particular kind of cognitive dissonance that settles over financial journalism every time war and earnings season collide. On one side of the ledger: oil past $100 a barrel, stagflation fears coursing through emerging markets, and American families facing a pump-price shock that risks reshaping the 2026 midterms. On the other: the trading floors of JPMorgan, Goldman Sachs, Morgan Stanley, Bank of America, Citigroup, and Wells Fargo, humming at a frequency they haven’t reached in years — their desks positioned to collect what analysts now project as a combined $40 billion in Q1 trading revenues.
That number lands this week in earnings releases beginning with Goldman Sachs on April 13 and continuing through the major banks over the following two days.
That number — $40 billion — deserves context. The equities component alone — roughly $18 billion for the top five banks, according to data compiled by Goldman Sachs and cited in analyst notes — represents more than double what those same desks harvested a decade ago. The math is unambiguous. Volatility is Wall Street’s oxygen. And war, it turns out, is among the most reliable oxygen tanks ever invented.
“The market doesn’t fear negative news per se. What the market really fears is what we call a ‘second-moment shock’ — a fancy way of saying uncertainty.”
— John Bai, Professor of Finance, Northeastern University
By the Numbers: What Each Bank Is Expected to Report
The earnings season unfolds in a compressed four-day window. Here is what the analyst consensus looks like heading into those critical spring mornings, drawing on data compiled by Alphastreet, Zacks Research, and FinancialContent:
| Bank | Q1 2026 Revenue Est. | YoY Growth | Report Date | Key Trading Signal |
|---|---|---|---|---|
| Goldman Sachs | $16.9bn | +12% | Apr 13 | ECM surge + trading desk dominance |
| JPMorgan Chase | ~$48.9bn | +8% | Apr 14 | FICC +16%; equities up 40% YoY |
| Citigroup | $23.6bn | +9% | Apr 14 | EPS est. +34% YoY; EM repositioning |
| Wells Fargo | $21.8bn | +8% | Apr 14 | Financials sector upgrade; oil hedging |
| Morgan Stanley | $19.7bn | +11% | Apr 15 | Defense/aerospace sector rotation |
| Bank of America | TBA | 16th consec. quarter ↑ | Apr 15 | 16th consecutive quarter of trading rev. growth |
JPMorgan’s Commercial & Investment Bank (CIB) division told investors to expect fixed-income markets revenues of $6.78 billion — a 16% increase year-over-year — with management guiding investment banking fees up “mid-to-high-teens.” That is before accounting for the full March shock, which many strategists believe will push the final tally above consensus. For Goldman, the same forces that have stalled M&A — geopolitical friction, elevated rates, regulatory scrutiny of “defense and energy megamergers” — have paradoxically supercharged the trading desk it built precisely for this moment.
The Iran Catalyst: A Supply Shock Without Precedent
The trigger for all of this is now five weeks old and still, as of this writing, unresolved at its roots. Following U.S.-Israeli strikes on Iranian facilities, commercial vessel-count data confirmed a 94% collapse in Strait of Hormuz transits. Goldman Sachs commodity strategist Daan Struyven was direct in his characterization: the Hormuz disruption represents the largest oil supply shock in recorded history, surpassing the 1973 OPEC embargo, which interrupted roughly 7% of global supply. At stake today: approximately 20%.
Brent crude, which opened the year well below $90 per barrel, breached $103 at the open of one Monday trading session before the G7’s promise of supply support pulled it back toward $94 — before President Trump’s April 1 primetime address sent it above $100 once more, with Goldman revising its April forecast to $115 a barrel. Twice. In two weeks.
The result, for trading desks, was a cascade of profit opportunities that textbooks cannot fully capture. Commodity trading advisers alone sold roughly $48 billion in S&P 500 futures over a single month — a mechanical deleveraging that amplifies market volatility regardless of directional conviction. The VIX, Wall Street’s canonical fear gauge, spiked from mid-teen levels to a high of approximately 32 in early March, settling near 26 as a ceasefire announcement arrived on April 10. For options desks, for FICC traders, for prime brokerage teams managing liquidity under extraordinary pressure — this is precisely the environment for which they are staffed, capitalized, and compensated.
“The largest oil supply shock in history — surpassing 1973 OPEC, with approximately 20% of global supply at stake.”
— Daan Struyven, Goldman Sachs Commodity Strategist
Inside the Desks: Goldman Maps Three Scenarios, Tells Clients to Reduce Exposure
The most revealing window into how Wall Street’s trading machinery actually operates during a crisis came from Tony Pasquariello, Goldman Sachs’s partner and global head of hedge fund coverage. Rather than projecting false confidence about the conflict’s resolution, Pasquariello told institutional clients directly that the desks had “no high-confidence edge” on probabilities across three distinct Iran scenarios:
Scenario 1 — Mission Accomplished
Rapid conflict conclusion. Oil retraces. Equities recover. Volatility collapses. A short-window hedge unwind enriches those positioned correctly on both the entry and the exit.
Scenario 2 — 45-Day Ceasefire
Hostilities pause without resolution. Sustained Hormuz disruption lingers. Inflation persists. The Fed remains constrained. FICC desks continue to earn elevated spread income through the second quarter.
Scenario 3 — Ground Escalation
A prolonged campaign. Oil approaches $130. The stagflation scenario Wells Fargo Investment Institute and Charles Schwab both identify as a genuine tail risk materializes. Global recession odds rise meaningfully. Credit provisions follow — but only later.
Pasquariello’s recommendation was textbook in its elegance: manage gross equity exposure lower, hold highly liquid securities, and for those seeking directional upside, use call spreads rather than outright longs. This is not just prudent risk management — it is geopolitical monetization at institutional scale. The very act of mapping uncertainty, pricing it, offering hedges against it, and facilitating client repositioning generates spread income. War, in this framing, is not a disruption to Wall Street’s business model. It is a feature of it.
Charles Schwab’s April 10 analysis noted that the ceasefire announcement markets responded to appears driven more by “rapid unwinds of hedges and speculative positioning than by a fundamental resolution of the conflict” — a phrase that, read between the lines, describes exactly the kind of two-sided liquidity provision that trading desks bill for, on the way in and on the way out.
The Fed Trap: When Geopolitical Risk Meets the Rate Cycle
The macro backdrop against which all of this is unfolding is simultaneously the greatest tailwind and the greatest threat to sustained trading profitability. The Federal Reserve, after successfully guiding rates into a “neutral” zone of 3.50% to 3.75%, now faces an inflation print running near 3% — constrained from cutting by precisely the energy shock that Wall Street is monetizing. Morgan Stanley’s Global Investment Office was blunt: “The key economic risk is duration. Sustained higher oil prices can broaden into other costs and raise the odds of higher rates for longer.”
Higher-for-longer rates are, on balance, positive for bank trading revenues in the near term — elevated Treasury yields sustain FICC volumes, credit spreads widen and compress with every headline, and duration management becomes a daily imperative for institutional portfolios. But they compress the M&A pipeline, weigh on leveraged buyout activity, and create the very private credit stress that several strategists now quietly flag as a shadow risk for Q3 and Q4 balance sheets. The banks are collecting a trading haul today that may fund the credit provisions of tomorrow.
A Structural Shift, Not a Volatility Bonus
The deepest insight embedded in this $40 billion quarterly figure is not the number itself, but what it reveals about the permanent reconfiguration of bank revenue streams. A decade ago, the combined equities trading haul for the top five American banks would have been roughly half of the $18 billion now projected. The growth is not simply a function of larger balance sheets or more sophisticated instruments. It reflects the structural entrenchment of geopolitical volatility as a permanent feature of market pricing — not an episodic shock, but a baseline condition.
Morgan Stanley’s research arm put the point elegantly in its 2026 outlook: “Investors may need to price in a world where regional blocs and strategic competition drive markets, risk premiums and asset allocation.” This is the world the trading desks already live in. Since 2020, each year has delivered at least one macro shock of sufficient magnitude to supercharge volatility: a pandemic, a land war in Europe, a regional banking crisis, tariff escalation, and now a direct U.S. military engagement in the Persian Gulf. The trading desks have not merely adapted to this environment — they have structurally expanded to capture it.
Goldman’s own framing of its Q1 story is instructive here. Analysts note the firm is pivoting its advisory services toward “geo-risk management” — a euphemism that would have been unthinkable in a Goldman pitch deck circa 2015, but which now represents an entire product category. The client who needs to hedge Hormuz exposure, protect an energy book, or reposition a sovereign wealth fund away from Middle Eastern risk is, for Goldman’s trading floor, a revenue event.
The Moral Hazard the Market Doesn’t Want to Discuss
There is an uncomfortable corollary to all of this that financial journalism often elides in the rush to publish earnings previews. The same conflict that is funding Wall Street’s most profitable quarter in years is, for most of the global economy, an unambiguous catastrophe. European and Asian equity markets — far more exposed to Middle Eastern energy imports — have been particularly punished, with stagflation fears driving median real quarterly returns on the Stoxx 600 toward deeply negative territory. Gold, despite conventional wisdom about its safe-haven properties, headed for its worst monthly performance since 2008 as dollar strength and rate expectations overwhelmed the geopolitical bid.
For retail investors and pensioners whose savings are benchmarked to indices that fell 7% year-to-date through March, the Q1 trading bonanza of the six largest U.S. banks is a complex data point. It does not mean the system is broken. But it does illuminate the degree to which modern financial architecture is designed to extract revenue from volatility — which means, at some level, it is designed to extract revenue from crisis. That is not a conspiracy. It is a function. Understanding it clearly is the beginning of informed investing, not the end of it.
“Geopolitical risk is becoming a persistent part of the backdrop, not merely episodic. Investors may need to price in a world where regional blocs and strategic competition drive markets.”
— Morgan Stanley Global Investment Office, 2026
What Investors Should Actually Do
Across 40 major geopolitical events spanning 85 years, the S&P 500 lost an average of just 0.9% in the first month before recovering to gain 3.4% over the following six. The investors most harmed by crises are almost always those who exit during the drawdown and miss the recovery. But this historical comfort requires nuance in 2026: the Iran conflict carries an inflation pass-through risk that is categorically different from typical geopolitical shocks, because it operates through the most persistent input price in the global economy — energy. If Brent stays above $100 long enough to embed in core inflation expectations, the Fed’s path narrows further, and the multiple compression on long-duration assets becomes self-reinforcing.
Wells Fargo Investment Institute currently favors U.S. Large- and Mid-Cap Equities over international markets, with a preference for Utilities, Industrials, and — critically — Financials. The banks set to report this week are themselves a favored sector in a stagflation-adjacent environment: their trading revenues rise with volatility, their FICC desks benefit from elevated rates, and their balance sheets are substantially better capitalized than in any prior geopolitical stress episode. Morgan Stanley adds defense, aerospace, drones, satellites, and missile defense to the structural overweight list — sectors whose multiyear demand is now underwritten by government balance sheets on both sides of the Atlantic.
The most important thing, in the current environment, is to distinguish between what is temporary and what is structural. The ceasefire announced April 10 is likely the former. The world in which geopolitical volatility is Wall Street’s most reliable profit engine is emphatically the latter. Invest accordingly.
Key Takeaways
- Wall Street’s six largest banks are tracking approximately $40bn in combined Q1 2026 trading revenues, with equities alone generating roughly $18bn for the top five — more than double a decade ago.
- The Iran war triggered a 94% collapse in Strait of Hormuz transits — the largest oil supply shock in recorded history according to Goldman Sachs — sending Brent above $100 and the VIX toward 32.
- Goldman Sachs’s Tony Pasquariello advised hedge fund clients to cut gross equity exposure and favor liquidity; the desk mapped three distinct Iran scenarios with no high-confidence base case.
- The Federal Reserve is effectively trapped by the energy-induced inflation shock, constraining its room for cuts and sustaining elevated yields that benefit FICC trading desks.
- The $40bn haul signals a structural shift: geopolitical risk is no longer episodic — it has become Wall Street’s baseline revenue driver. The trading desks have expanded specifically to capture it.
- History favors staying invested through geopolitical shocks; but the inflation pass-through risk from sustained $100+ oil makes the 2026 episode categorically more dangerous than most predecessors.
- Favored portfolio sectors: U.S. Large-Cap Financials, Energy, Defense/Aerospace, and gold as a medium-term hedge once dollar strength and rate expectations stabilize.
Frequently Asked Questions
Why are Wall Street banks reporting record trading revenues during the Iran war?
Conflict-driven volatility dramatically increases trading volumes across equities, fixed-income, currencies, and commodities. Banks earn spread income — the difference between buy and sell prices — on each transaction, as well as fees from facilitating client hedges and portfolio repositioning. The Iran war has elevated the VIX toward 32, sent oil above $100, and generated extraordinary demand for hedging instruments, creating near-ideal conditions for trading desk profitability.
What is the breakdown of the $40bn trading haul between equities and FICC?
Analysts project roughly $18bn in equities trading revenues for the top five banks in Q1 2026 — more than double the figure from a decade prior. The remainder ($22bn+) is distributed across Fixed Income, Currencies, and Commodities (FICC), with JPMorgan’s FICC desk alone expected to generate approximately $6.78bn, up 16% year-over-year.
How does the Iran war affect the Federal Reserve’s interest rate decisions?
The oil price shock from the Iran war has kept headline U.S. inflation running near 3%, well above the Fed’s 2% target. With rates already at a “neutral” 3.50–3.75%, the Fed has limited room to cut without risking a resurgence of inflationary pressure. Several forecasters project the elevated oil environment will push 2026 inflation forecasts higher, forcing the Fed to hold rates for longer — a scenario that continues to benefit bank FICC trading desks.
Should investors buy bank stocks heading into Q1 2026 earnings?
This article does not constitute investment advice. However, analyst consensus from Wells Fargo Investment Institute, Morgan Stanley, and Goldman Sachs currently favors the Financials sector in a stagflation-adjacent environment, citing elevated trading revenues, well-capitalized balance sheets, and FICC income resilience. Investors should weigh potential credit provision increases in the second half of 2026 as a meaningful counterbalancing risk.
Sources
- Goldman Sachs Q1 2026 Preview — FinancialContent / MarketMinute
- Goldman Traders Map Iran Conflict Scenarios — Prism News
- Iran War: Ceasefire Offers Relief, Not Resolution — Charles Schwab
- Iran Conflict: Oil Price Impacts and Inflation — Morgan Stanley
- Iran War Oil Shock: Stock Market Impacts — Morgan Stanley
- Bank Earnings Preview Q1 2026 — Alphastreet
- Is JPM a Buy Before Q1 Earnings? — Zacks
- Iran War and Your Portfolio — Defiant Capital Group
- Iran War Update — Wells Fargo Investment Institute
- Stocks, Bonds and Commodities: How Global Markets Have Traded the Iran War — CNBC
Discover more from The Economy
Subscribe to get the latest posts sent to your email.

Four critical developments point to where payments in the region are heading next — and why the apps-first era is already history.
The Curtain Falls on the App Era
There is a story the fintech industry loves to tell about Southeast Asia. It begins with a farmer in rural Java tapping his phone to pay for fertiliser, a street-food vendor in Bangkok scanning a QR code with a tourist from Shanghai, a domestic worker in Singapore sending her week’s wages back to Manila in seconds. The hero of that story, in the industry’s telling, has always been the app — the digital wallet, the super-app, the neobank sitting on a home screen, gleaming with UX refinement and venture-capital ambition.
That story is not wrong. It is simply finished.
The consumer-app chapter of Southeast Asia’s payments journey — the decade of Grab, GoPay, GCash, TrueMoney, MoMo, and a hundred others racing to own the digital wallet on 680 million phones — has run its course. By the end of 2025, over 60% of all transactions across the region were digital, a staggering shift from the cash-dominated economy of a decade prior. The region’s digital economy surpassed US$300 billion in gross merchandise value, with e-commerce alone projected at US$185 billion, according to the Google, Temasek and Bain & Company e-Conomy SEA 2025 report. The apps won the consumer. That battle is over.
The new war — less visible, exponentially more consequential — is being fought at the infrastructure layer. In 2026, the real competition for Southeast Asia’s next trillion dollars of fintech value is not about which app sits on a consumer’s home screen. It is about who owns the rails, the nodes, the settlement fabric, and the intelligence layer that quietly powers every transaction, regardless of which logo the end-user sees. The payments infrastructure era has begun, and the region that builds it best will set the terms of global digital commerce for a generation.
“The most important infrastructure is the kind you never see.”
The Quiet Revolution Beneath the Surface
To understand why the infrastructure layer now matters more than any individual application, consider what has changed structurally across the region in the past 24 months.
First, the digital payments market has reached a scale where the marginal cost of acquiring the next user is rising sharply, while the marginal value of owning one more wallet is declining. Market consolidation — always the terminus of a platform land-grab — is well underway. The super-apps have converged. GrabPay, Sea’s ShopeePay, and Gojek’s GoPay have matured into relatively stable oligopolies in their respective markets. The frantic days of cash-burning to subsidise transactions and build habitual loyalty are drawing to a close as investors — who poured a stabilised $8 billion into the region’s digital economy in 2025, up 15% year-on-year — now demand sustainable unit economics over raw growth.
Second, the bottleneck in Southeast Asia fintech has visibly shifted. For years, the constraint was adoption: could you get enough people to download an app, link a bank account, and transact digitally? That problem is largely solved in the urban cores of Singapore, Bangkok, Jakarta, Kuala Lumpur, Manila, and Ho Chi Minh City. The remaining constraint is structural: cross-border friction, B2B settlement inefficiency, financial exclusion in second-tier cities and rural corridors, and the chronic inability of small businesses to access working capital embedded in their payment flows. None of these problems is solved by a prettier consumer interface. All of them are solved — or not solved — at the infrastructure layer.
Third, and most consequentially, a wave of state-backed, multilaterally coordinated infrastructure projects has arrived at exactly the right moment. Governments and central banks across the region have recognised that payments infrastructure is a public good — too important to be left entirely to private platform dynamics — and have committed serious institutional capital to building interoperable, open, sovereign rails.
The result is a region undergoing a quiet but profound rewiring. The apps remain. But the ground they stand on is being rebuilt.
The Four Critical Developments
1. Interoperable Real-Time Rails: The Plumbing That Changes Everything
The most architecturally significant development in Southeast Asia payments right now is not happening inside any startup. It is happening in central bank boardrooms and at the Bank for International Settlements in Basel, Switzerland.
Project Nexus — the BIS Innovation Hub initiative to connect the domestic instant payment systems of Malaysia (DuitNow), the Philippines (InstaPay/PESONet), Singapore (PayNow), Thailand (PromptPay), and India (UPI) into a single multilateral network — has crossed from blueprint into structured implementation. In March 2025, Nexus Global Payments incorporated in Singapore, established by the founding central banks, to manage the formal rulebook, technical implementation guides, and ISO 20022 specifications. A live pilot was completed in 2025, with full cross-border implementation targeted for 2026. The European Central Bank has been in an exploratory phase regarding integration, a development that would extend the network’s potential reach to over 2 billion people.
The significance of this is difficult to overstate. Previously, enabling real-time cross-border payments between, say, a Thai migrant worker in Singapore and her family in Chiang Mai required bilateral agreements negotiated country-by-country, each with its own technical integration, FX arrangement, and compliance framework. Project Nexus replaces that web of bespoke connections with a single multilateral hub — meaning that any country connected to Nexus can transact with every other connected country, instantly and cheaply. For the region’s estimated 10 million migrant workers, and for the SMEs engaged in intra-ASEAN trade, this is transformative.
Alongside Project Nexus, the ASEAN Regional Payment Connectivity (RPC) initiative has been quietly standardising QR code infrastructure across the region. Eight national QR systems — Cambodia’s KHQR, Indonesia’s QRIS, Lao PDR’s Lao QR, Malaysia’s DuitNow, the Philippines’ QR Ph, Singapore’s PayNow, Thailand’s PromptPay, and Vietnam’s VietQR — are now connected, enabling real-time currency conversion and cross-border scanning at point of sale. Japan is exploring integration. The tourist from Seoul scanning a Thai QR code, or the Indonesian exporter receiving instant payment from a Singaporean buyer — these are no longer aspirational scenarios. They are operational realities.
What the apps gave consumers was digital convenience within national borders. What the real-time rails give the entire economy is borderless, frictionless settlement as a foundation for the next decade of trade, tourism, and commerce.
2. Embedded Finance and Invisible B2B Infrastructure
The second critical development is less photogenic than a glowing network diagram, but arguably more commercially consequential: embedded finance is transitioning from a buzzword to actual infrastructure, and it is rewiring the B2B economy with particular force.
Embedded finance — the integration of financial services (credit, insurance, payments, FX) directly into non-financial platforms — is well past the pilot stage in Southeast Asia. But the frontier has shifted decisively from consumer-facing embeds (buy now, pay later at checkout; insurance at ride-hailing checkout) toward B2B and supply-chain infrastructure. Small businesses that once faced weeks-long bank loan processes can now access instant credit decisions directly within e-commerce or business platforms, enabled by open banking APIs that connect financial institutions to real-time transaction data.
This matters enormously in a region where the MSME funding gap — the difference between what small businesses need and what they can access from formal credit sources — runs into the hundreds of billions of dollars. Indonesia’s MSME sector alone contributes over 60% of GDP but has historically been served poorly by traditional banks unwilling to underwrite businesses without collateral or formal financial histories. The infrastructure being built now — API-native lending rails, real-time cash-flow underwriting embedded inside e-commerce and logistics platforms, merchant payment data flowing into credit models — represents a structural solution to a structural problem.
The architecture of this embedded layer is increasingly API-first and cloud-native, with banking-as-a-service (BaaS) providers acting as regulated intermediaries that allow non-bank platforms to offer financial products without holding their own licences. The companies winning in 2026 built their entire architecture API-first, making integration and partnership frictionless. This is not a marginal shift. It represents the effective unbundling of banking from banks — and its rebundling inside the digital platforms where Southeast Asian businesses and consumers already spend their operational lives.
The competitive implications are stark. A logistics platform in Vietnam that embeds working-capital financing into its merchant dashboard is not just offering a payment feature. It is building a financial relationship that makes switching costs prohibitive, transaction data proprietary, and growth capital a competitive moat. The platform that controls embedded financial infrastructure controls the commercial relationship entirely. The app on the consumer’s phone is a front door. The embedded financial plumbing is the foundation.
3. Tokenised Assets, Stablecoins, and Programmable Money on Regulated Rails
The third development requires a clear-eyed separation of what is real from what is still speculative: stablecoins and tokenised money are arriving as serious payments infrastructure in Southeast Asia, but only on regulated rails, and the use cases that matter are not retail crypto wallets.
Singapore’s Monetary Authority (MAS) announced in November 2025 that it would hold trials to issue tokenised MAS bills in 2026, alongside plans to bring in laws to regulate stablecoins as it moves forward with building a scalable tokenised financial ecosystem. The MAS Single-Currency Stablecoin Framework — requiring full reserve backing, licensed issuers, and guaranteed redemption at par — is now being operationalised. Stablecoins are currently valued at US$250 billion globally, with the market expected to grow two to three times by 2028.
The most interesting action in Southeast Asia is happening at the infrastructure layer. StraitsX, the Singapore-based stablecoin settlement layer, saw its card transaction volume surge 40 times between Q4 2024 and Q4 2025, with card issuance growing 83-fold. More significantly, its XSGD stablecoin — pegged 1:1 to the Singapore dollar and fully backed by reserves held at DBS and Standard Chartered — is being used not as a speculative asset but as settlement infrastructure. When a tourist from Bangkok taps to pay in Singapore using a Thai e-wallet, a stablecoin layer runs in the background, handling cross-border settlement while merchants receive instant payment in Singapore dollars. The stablecoin is invisible. The outcome — instant, cheap, transparent cross-border settlement — is not.
In November 2025, StraitsX announced an expanded payment network connecting Singapore, Thailand (via KBank), Taiwan, and Japan, slated for go-live in Q2 2026, establishing a unified stablecoin-native settlement corridor linking Southeast and Northeast Asia. It also announced the launch of XSGD and XUSD on the Solana blockchain, positioning them as infrastructure for AI agent-to-agent micropayments — a foreshadowing of the machine-economy payment infrastructure to come.
Programmable money is the deeper story here. When a payment instrument can be embedded with conditions — “release this payment when the goods arrive at the warehouse,” “distribute this subsidy only at certified pharmacies,” “pay this supplier automatically when the invoice is confirmed” — the entire architecture of commercial settlement changes. Smart-contract-enabled stablecoins turn every payment into a mini-legal agreement, reducing counterparty risk, shrinking settlement windows, and enabling financial products that are impossible on traditional rails. Singapore’s Project Orchid has demonstrated this at government scale, distributing subsidies as purpose-bound money. The private sector is watching closely.
The geopolitical dimension here is acute. Approximately 99% of stablecoins currently on the market are USD-pegged, according to BIS and US Treasury data. The US GENIUS Act, signed in July 2025, locked in American regulatory dominance over the stablecoin stack. Singapore, Thailand, and Malaysia are making deliberate bets on local-currency stablecoin rails — XSGD, and emerging equivalents — precisely to retain monetary sovereignty in an infrastructure layer that could otherwise default entirely to the US dollar. This is not merely a financial decision. It is a geopolitical one.
4. AI-Powered Intelligence Layered Into the Plumbing
The fourth development is where the payments story and the AI story collide, and the collision is less about chatbots at the consumer interface than about intelligent systems embedded silently within transaction infrastructure.
Among fintech leaders surveyed by Money20/20 Asia for its 2026 Future of Fintech in APAC report, 63.5% identified fraud prevention as their top operational priority, with regulators and industry players investing heavily in real-time risk intelligence and AI-driven security systems. This is not surprising in a region where scam compounds in Myanmar, Cambodia, and Laos have turned organised online fraud into an industrial operation, generating billions annually. One in three Vietnamese consumers hesitates to use digital payments not because of unawareness of fraud, but because they have no mechanism to verify where their money is going — a trust deficit that is fundamentally an infrastructure problem, not an education problem.
The solution being built is AI embedded directly into the payment rails. Modern fraud detection systems operating across Southeast Asia’s real-time payment networks now use Graph Neural Networks (GNNs) to detect complex money-laundering patterns and synthetic identity fraud in sub-100-millisecond latency windows. Financial institutions implementing modern AI identity verification stacks have seen fraud attempts drop by 60 to 70%. The integration of ISO 20022 standards across cross-border payments has revolutionised data richness, allowing fraud detection systems to verify the ultimate beneficial owner and the purpose of every transfer with unprecedented precision.
But AI in payments infrastructure is not only a security story. It is a credit story, a liquidity story, and a compliance story. Real-time transaction data flowing through payment rails — the working capital flows of millions of SMEs, the spending patterns of previously unbanked consumers, the invoice cycles of regional supply chains — is now being fed into AI models that dynamically assess creditworthiness, predict cash-flow stress, optimise FX hedging, and flag compliance anomalies before they become regulatory events. The payment rail, in this model, is not just a pipe. It is a sensing network, continuously gathering the data that makes intelligent financial decisions possible.
Asia-Pacific’s strategy of integrating fraud prevention into financial infrastructure itself — rather than treating it as a bolt-on security product — is being watched globally as a model. The Philippines’ Anti-Financial Account Scamming Act, which moves liability onto financial institutions and mandates real-time automated fraud monitoring, is the legislative expression of a deeper architectural philosophy: security is infrastructure, not a feature.
Why This Matters: SMEs, the Unbanked, and Regional Competitiveness
The case for caring about infrastructure rather than apps is not merely intellectual. For Southeast Asia’s 71 million micro, small, and medium enterprises — the backbone of every national economy in the region — the infrastructure era is the difference between having access to the formal financial system and being permanently excluded from it.
An SME textile exporter in Bandung that can settle a cross-border invoice with a Singaporean buyer in seconds, using a DuitNow-PayNow link over Project Nexus infrastructure, does not need to maintain a correspondent-banking relationship or pay wire transfer fees that compress its margins. An embedded finance layer reading that exporter’s transaction history in real time can offer a working-capital line the morning a large order arrives, not six weeks later after a bank loan review. These are not incremental improvements. They are structural changes in what is economically possible for a small business operating in Southeast Asia.
For the region’s estimated 290 million unbanked and underbanked adults — concentrated in rural Indonesia, Vietnam, the Philippines, and Myanmar — the infrastructure era matters differently. Consumer apps reached many of them. But reaching someone with a digital wallet and actually integrating them into the formal financial system are different things. The latter requires the credit pipes, the identity infrastructure, the regulatory frameworks, and the dispute resolution mechanisms that constitute real financial inclusion. That is infrastructure, not UX.
At the macro level, Southeast Asia’s ability to compete as a unified economic bloc — rather than a collection of nationally fragmented markets — depends on getting the payment rails right. The ASEAN region aspires to be the world’s fourth-largest economy by 2030. That aspiration is only plausible if regional trade can be settled without the friction, cost, and delay that correspondent banking currently imposes. Project Nexus, the RPC, and the stablecoin settlement networks being built now are the payment preconditions for a genuinely integrated ASEAN market.
Key Data Box: Southeast Asia Payments Infrastructure at a Glance (2026)
| Metric | Figure | Source |
|---|---|---|
| SEA digital economy GMV | >US$305 billion | e-Conomy SEA 2025 (Google/Temasek/Bain) |
| E-commerce GMV (2025) | ~US$185 billion | e-Conomy SEA 2025 |
| Share of digital transactions | >60% of all payments | e-Conomy SEA 2025 |
| Project Nexus target go-live | 2026 | BIS / MAS |
| Potential users connected by Nexus (Phase 1) | 1.7 billion | BIS |
| Global stablecoin market value | ~US$250 billion | MAS / SingaporeLegalAdvice |
| Stablecoin market projected growth | 2–3x by 2028 | MAS |
| APAC fintech leaders citing fraud prevention as top priority | 63.5% | Money20/20 Asia 2026 |
| StraitsX card transaction volume growth (2024–2025) | 40x | CoinDesk / StraitsX |
| SEA as primary growth target among APAC fintech leaders | 22.9% | Money20/20 Asia 2026 |
Risks, Regulatory Watchpoints, and the Geopolitical Angle
It would be convenient, but dishonest, to tell only the optimistic version of this infrastructure story.
The interoperability agenda faces real governance risks. Connecting nine distinct fast-payment systems across a region of extraordinary regulatory diversity — where central bank sophistication ranges from the MAS (among the world’s most advanced financial regulators) to institutions in Cambodia, Laos, and Myanmar still building foundational capacity — is vastly harder in practice than in an architectural diagram. Technical standards are one challenge; liability regimes across borders are another entirely. Who bears the loss when an instant cross-border payment is fraudulent? No clear multilateral framework yet exists.
The stablecoin landscape, though maturing rapidly, remains geopolitically contested. The US GENIUS Act creates a strong presumption in favour of USD-denominated stablecoins, and the network effects of dollar liquidity are formidable. Southeast Asian central banks betting on local-currency stablecoins are swimming against a powerful current. If XSGD-equivalent instruments fail to achieve sufficient liquidity at competitive FX spreads, the default path for cross-border settlement in the region may effectively become a dollarised stablecoin rail — reducing monetary sovereignty regardless of what the regulatory frameworks say.
Cybersecurity risk scales with the connectivity of the infrastructure being built. A deeply interconnected payments network — where a PromptPay transaction in Bangkok can cascade through Nexus nodes into UPI rails in Chennai — is also a single threat surface of enormous consequence. Southeast Asian countries have built some of the world’s most dynamic real-time payment infrastructures, but the verification layer to provide upfront protections has been somewhat neglected. The speed at which infrastructure is being built must not outpace the speed at which it is being secured.
Finally, there is the broader geopolitical framing. ASEAN’s payments infrastructure decisions in the next three years will determine whether the region sits within, or outside, the emerging dollar-dominated digital financial architecture that the United States is constructing through the GENIUS Act and its diplomatic relationships with allied regulators. The choice is not binary — Singapore in particular is navigating it with characteristic precision — but it is real. Payments infrastructure, as the region is now discovering, is never merely technical. It is strategic.
The Next Decade Belongs to the Builders of Rails
In 2016, the prophets of Southeast Asia fintech pointed to a teenager in Surabaya tapping a phone to pay for a motorbike ride and said: this is the future. They were right, but only partially. The tap was a symptom. The future was always in what happened next — the fraction-of-a-second journey of that payment through authentication, routing, settlement, reconciliation, and risk assessment, across infrastructure that nobody designed for the digital age.
The decade ahead belongs to the architects of that invisible journey. Not the brands on the home screen, but the engineers of interoperability. Not the wallets, but the rails. Not the consumer experience, but the institutional plumbing that makes every consumer experience possible. As digital payments move toward becoming the default rails for the vast majority of Southeast Asia’s commerce — and as programmable money, AI-embedded intelligence, and multilateral settlement networks converge — the region is engaged in the most consequential infrastructure build of its economic history.
The apps were the beginning of the story. The infrastructure is the story itself. And the next trillion dollars will flow through whoever builds it best.
Discover more from The Economy
Subscribe to get the latest posts sent to your email.
Ten million barrels a day offline. Qatar’s LNG trains in ruins. Brent past $120. The ceasefire changes the headlines — it does not change the damage. The Middle East energy order as we knew it is not disrupted. It is broken.
There is a peculiar ritual that follows every great energy shock: within days of the first price spike, the soothing voices of market analysts and government spokespeople emerge to reassure us that supply disruption is temporary, strategic reserves are ample, and the world’s oil machine will self-correct. The ritual is underway again. But this time — after forty-three days of the largest supply disruption in the history of the global oil market, as the International Energy Agency has described it — those soothing voices are reciting from a script the facts no longer support. The 2026 Strait of Hormuz crisis is not a disruption to be managed. It is a structural wound.
The arithmetic alone is staggering. Since Iran’s Revolutionary Guards declared the strait “not allowed” to commercial shipping on February 28, 2026 — hours after the United States launched Operation Epic Fury — tanker traffic through the waterway has collapsed by more than 90 percent. Roughly 10 million barrels per day of oil production have been effectively taken off world markets. That is more oil than Germany, France, the United Kingdom, and Italy consume combined. Add the simultaneous shutdown of Qatar’s LNG exports — the world’s largest — and you have an energy rupture that dwarfs the 1973 Yom Kippur embargo, the 1979 Iranian Revolution, and the 1990 Gulf War disruption, rolled into one.
Crisis at a Glance — Key Metrics (as of 12 April 2026)
| Metric | Figure |
|---|---|
| Gulf oil production effectively offline | ~10 mb/d |
| Brent crude peak | $120+ per barrel |
| Qatar LNG capacity destroyed | 17% — 3–5 year repair timeline |
| QatarEnergy estimated annual lost revenue | $20 billion |
| Asian LNG spot price spike post-Ras Laffan strike | +140% |
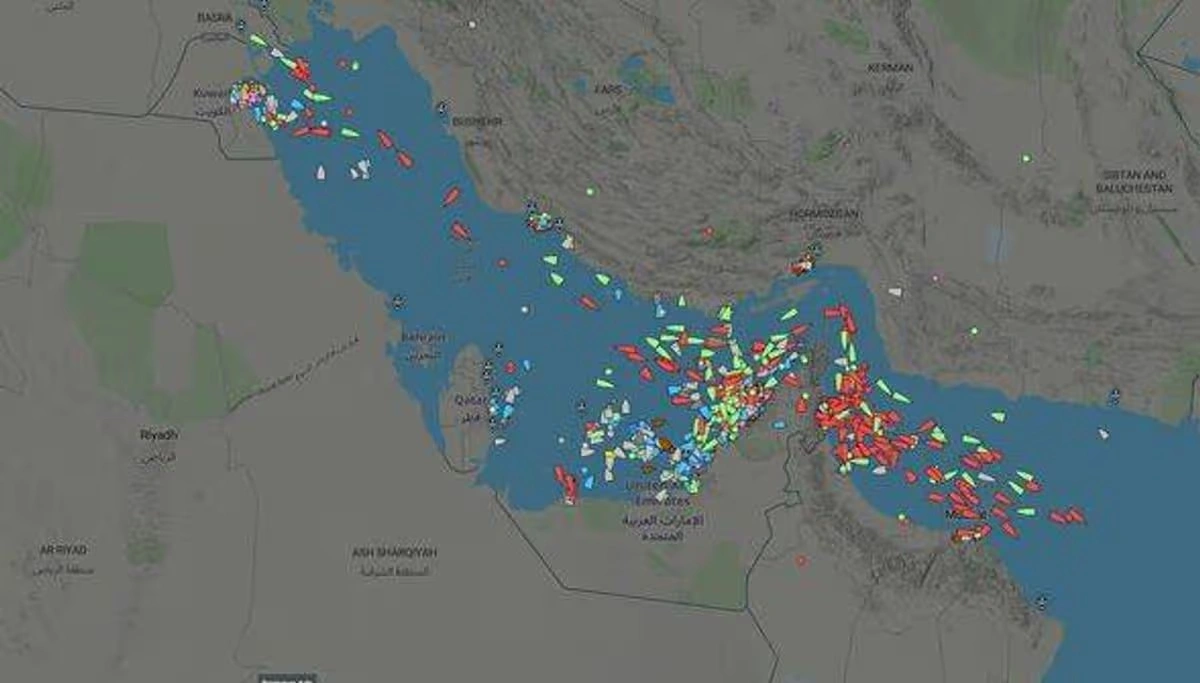
| Loaded tankers trapped in the Persian Gulf (9 Apr) | 230 vessels |
Yet numbers, however eye-watering, fail to capture the true nature of what has happened. The war has not merely interrupted flows through a choke point. It has physically destroyed irreplaceable infrastructure, accelerated a geopolitical realignment years in the making, and imposed costs — financial, strategic, and reputational — that the Gulf’s great petrostate empires will be paying for the better part of a decade. A fragile two-week ceasefire agreed on April 8 has not reopened the strait. By April 9, ADNOC CEO Sultan Al Jaber was blunt: “The Strait of Hormuz is not open. Access is being restricted, conditioned and controlled.” Two hundred and thirty laden tankers sat anchored inside the Gulf, waiting for a passage that, as of this writing, remains subject to Iranian veto.
The Physical Damage: Bombed Trains, Broken Compressors, Years of Repair
Start with the concrete and the steel — because in energy infrastructure, the physical damage is where the multi-year consequences begin. On March 18, Iranian missiles struck Ras Laffan Industrial City, the sprawling 200-square-kilometre complex eighty kilometres northeast of Doha that is, without exaggeration, the most important natural gas export hub on earth. QatarEnergy subsequently confirmed that two of its fourteen LNG production trains — the giant refrigeration units that liquefy gas for export — and one of its two gas-to-liquids (GTL) facilities were destroyed. According to Bloomberg, two of the plant’s 14 production trains were damaged, with repairs expected to take years.
QatarEnergy CEO Saad al-Kaabi was precise in his damage assessment: the attack wiped out capacity producing 12.8 million tonnes per year of LNG — 17 percent of Qatar’s total export capacity. Repairs will take three to five years. The reason is not a lack of money or will. It is physics and procurement. QatarEnergy requires replacement gas turbines to power the refrigeration compressors of the destroyed trains. Only three manufacturers worldwide produce the required equipment, and current order books put delivery timelines at two to four years. You cannot Amazon-Prime a gas turbine. The South site at Ras Laffan, which took the direct hits, has dropped from 36 million tonnes per annum capacity to 24 mtpa — a permanent loss that no ceasefire can rapidly undo.
“These are not repairs that can be made in a week or two. These are repairs that are going to take probably years to replace, and, by virtue of that, there is going to be a sizable impact.”
— Energy Economist, University of Colorado Denver, via Scientific American, March 2026
The damage beyond Qatar is less headline-grabbing but cumulatively severe. Kpler’s vessel-tracking analysis confirms that insurance withdrawal — not physical blockade alone — effectively shuttered the strait from day one of the conflict. By early March, insurance premiums for vessels transiting the passage had risen four to six times over the prior week. Iraq and Kuwait began curtailing oil well production by early March as onshore storage filled to capacity with crude that had nowhere to go. The collective oil output of Kuwait, Iraq, Saudi Arabia, and the UAE had dropped by a reported 6.7 million barrels per day by March 10, and by at least 10 million barrels per day by March 12. Saudi Arabia’s Ras Tanura refinery, one of the world’s largest at 550,000 barrels per day, was among Iranian targets. Iran also struck facilities in Kuwait, UAE, and threatened further strikes on the Jubail Petrochemical complex and UAE’s Al Hosn gasfield.
The infrastructure repair bill, when it is eventually totalled, will run well into the tens of billions of dollars across the Gulf. The direct $20 billion annual revenue loss from Ras Laffan alone — over a three-to-five-year repair horizon — implies a present-value destruction of somewhere between $40 billion and $70 billion in Qatari energy wealth, before secondary effects on planned expansions such as the North Field East project are accounted for.
The Hormuz Stranglehold: A 20% Global Oil Shock That the Pipelines Cannot Fix
One of the persistent myths of pre-war energy security planning was that Gulf producers had meaningful bypass routes. Saudi Arabia’s East-West Pipeline can carry crude to Yanbu on the Red Sea; the UAE’s Habshan-Fujairah pipeline offers an outlet to the Gulf of Oman. In theory, these could absorb some Hormuz disruption. In practice, as the Congressional Research Service noted in its March 2026 analysis, combined available capacity across both pipelines amounts to roughly 2.6 million barrels per day — a fraction of the 20 million barrels that normally transit the strait daily. Saudi Arabia did crank the East-West pipeline to its 7 million bpd capacity limit by end of March, according to Al Jazeera, pumping more oil through it than ever before. But there is no pipeline for LNG. Gas molecules trapped inside the Gulf have nowhere to go.
The scale of the supply shock — 20 percent of global seaborne oil trade suddenly offline — is without modern precedent. The 1973 embargo removed roughly 7 percent of global supply. The 1979 Iranian Revolution cut about 4 percent. Even combined, they did not approach what the 2026 Hormuz closure has achieved. Federal Reserve Bank of Dallas economists writing in March 2026 are unequivocal: “A complete cessation of oil exports from the Gulf region amounts to removing close to 20 percent of global oil supplies from the market.” Their models warn that a quarter-long closure would impose significant output losses on the global economy, weighted most heavily on Asia, which receives roughly 80 percent of Gulf crude exports.
The Asian Dilemma
China sourced roughly a third of its oil imports through Hormuz. Japan, as of February 2026, sourced 94.2 percent of its crude from the Middle East. India’s refineries pivoted rapidly to Russian crude — deepening a strategic dependency that will not easily reverse when the war ends. South Korea has emergency reserves estimated to last over a year. The Philippines, importing 98 percent of its oil from the Middle East, declared a state of national energy emergency on March 24. As Bloomberg’s analysis documents, fuel shortages spread from Thailand to Pakistan within weeks, while European traders warned of diesel scarcity if the strait remained closed.
Beyond Oil: The Invisible Damage — Fertilizer, Helium, and Food
This crisis has taught an uncomfortable lesson: the Strait of Hormuz is not merely an oil pipeline. It is a supply artery for the global agricultural system. Up to 30 percent of internationally traded fertilizers — primarily urea and ammonia — normally transit the strait. The Gulf region accounts for 30–35 percent of global urea exports and 20–30 percent of ammonia exports. Disruption to fertilizer supply during the Northern Hemisphere spring planting season could suppress corn yields in the United States, the world’s primary corn producer — with downstream effects rippling through beef, poultry, and dairy prices into 2027. Global fertilizer prices are estimated to average 15–20 percent higher in the first half of 2026 if the crisis continues.
Add to that helium — critical for MRI machines, semiconductor manufacturing, and scientific research — of which the Gulf is a major supplier. The crisis has constrained global helium supply, disrupting industries with few substitute suppliers. Sulfur — of which Gulf countries supply roughly 45 percent globally — faces similar choking, with knock-on effects on copper mining and acid production. The 2026 Hormuz crisis is not an energy crisis. It is a civilizational supply chain emergency whose secondary consequences will take years to fully surface.
“Every day the Strait remains restricted, the consequences compound. Supply is delayed, markets tighten, prices rise. The impact is felt beyond energy markets, in economies, industries and households worldwide.”
— Sultan Ahmed Al Jaber, CEO, ADNOC, via CNBC, 9 April 2026
The Structural Wound: Why This Is Not the 1970s — It Is Worse
Historical analogies are seductive in a crisis. Market veterans reflexively reach for 1973 and 1979, the canonical oil shocks. But the 2026 crisis differs from its predecessors in three ways that make it structurally more damaging.
First, physical destruction. The 1973 embargo was a political act — a tap turned off. The tap was always intact and could be turned back on. Ras Laffan’s destroyed LNG trains cannot be turned back on. The Pearl GTL facility — one of the world’s most complex energy installations — will require years of engineering work and two-to-four years of lead time just on gas turbine procurement. This is infrastructure damage, not a pricing dispute. The gap between “disruption” and “destruction” is measured in years, not quarters.
Second, the simultaneous closure of multiple commodity streams. The 1973 shock was an oil shock. The 2026 crisis is an oil shock, a gas shock, a fertilizer shock, a helium shock, and a food security shock — simultaneously, through a single choke point. The systemic interdependencies are categorically more complex, and the feedback loops — oil prices feeding into food prices feeding into inflation feeding into central bank tightening feeding into recession risk — operate faster in the digitally connected, just-in-time supply chain world of 2026 than they did in 1973.
Third, the Gulf Cooperation Council’s economic model has suffered a credibility rupture. Analysts describe a “systemic collapse of the GCC economic model” — the implicit contract in which Gulf states provided the world with uninterrupted energy flows in exchange for security guarantees and geopolitical accommodation. That contract has been violated. Not by choice, but by geography and the logic of warfare. Foreign investors who once treated Gulf energy infrastructure as the world’s most bankable physical asset are reassessing. Capital that was financing the Gulf’s Vision 2030-style economic diversification programmes will seek safer harbours, at precisely the moment when diversification was finally beginning to bear fruit.
Recovery Timeline: What Partial Ceasefire Actually Means
| Timeframe | Expected Milestone | Key Risk |
|---|---|---|
| May–June 2026 | Ras Laffan North site potentially restarts 12 operable LNG trains (Wood Mackenzie); 14 stranded LNG cargoes exit the Gulf | Fragile ceasefire collapses; Iran re-restricts passage |
| Aug–Sep 2026 | Ras Laffan South site earliest possible partial restart; tanker flows normalize if strait fully opens | Turbine procurement bottleneck; insurance market slow to re-normalise |
| 2027–2028 | Gulf oil production ramps back toward pre-war levels; stranded North Field East expansion resumes | Investor confidence gap; delayed capex decisions across region |
| 2029–2031 | Two destroyed LNG trains at Ras Laffan fully repaired and online (CEO estimate: 3–5 years from strike) | Gas turbine delivery delays; structural demand shift to US LNG may be permanent |
Wood Mackenzie’s assessment is sobering: even with a ceasefire, QatarEnergy cannot fully restart all twelve operable trains before late August at the earliest, assuming a May resumption — and that assumes security conditions permit it. “The ceasefire means it may be possible for the 14 trapped laden LNG cargoes in the Gulf to exit the Strait of Hormuz,” said Wood Mackenzie’s Tom Marzec-Manser. “But for there to be a real structural change in supply, the Ras Laffan site in Qatar would need to restart its 12 operable trains. It is unclear if QatarEnergy would consider doing this during a ceasefire.”
Winners, Losers, and the Accelerated Energy Transition
Winners
- US LNG exporters — structural demand shift from Qatar LNG by European and Asian buyers
- American shale producers — Brent above $100 makes marginal barrels highly profitable
- Russia — India and China deepening crude import dependency amid Gulf disruption
- Renewable energy developers — war accelerates energy diversification mandates globally
- Norwegian gas exporters — European pipeline gas alternatives gain premium
- Australian LNG — new long-term contracts from Asia locked in at elevated prices
Losers
- Qatar — $20B annual revenue loss, North Field expansion delayed, sovereign reputation damage
- Kuwait and Iraq — prolonged well shut-ins cause reservoir damage; fiscal crises deepen
- Asian LNG importers — Japan, South Korea, China facing multi-year supply tightness
- European industry — energy-intensive manufacturing faces existential competitiveness crisis
- Global food systems — fertilizer shock cascades into 2027 harvests
- Emerging markets — fuel import bills spike; currency crises in Philippines, Bangladesh, Pakistan
The most consequential long-run winner may be the energy transition itself — though not in any comfortable sense. As one executive interviewed by Bloomberg put it bluntly: “The main message is that we’re going to get the energy transition forced on us in a very painful way.” Forced transitions are rarely efficient ones. Governments scrambling to reactivate coal plants and speed-build LNG regasification terminals are making choices that will lock in infrastructure for thirty years. The crisis has simultaneously made fossil fuel investment look more profitable in the short term — producers will not rush to bet on multi-year projects given volatility risk — and made diversification away from Middle Eastern supply a strategic imperative. The result, paradoxically, may be more investment in both shale and renewables simultaneously, further compressing the role of Gulf producers in the global energy mix over the next decade.
Policy Implications: What Must Come Next
The 2026 Hormuz crisis has exposed the hollowness of decades of energy security planning. The assumption that strategic petroleum reserves — built for 90-day disruptions — could manage a complete cessation of Gulf supply was always a comforting fiction. The IEA’s emergency stock release mechanisms were designed for disruptions, not destructions. The fertilizer sector, as the Wikipedia crisis chronicle notes, lacks any internationally coordinated strategic reserves whatsoever, making supply disruptions there almost entirely unmanageable through existing tools.
- Establish international fertilizer strategic reserves — modelled on IEA oil emergency sharing agreements. The agricultural cascades from 2026 will arrive in 2027 and 2028; governments that act now can blunt the worst of them.
- Accelerate LNG import infrastructure in Europe and Asia — floating storage and regasification units can be deployed in 18–24 months. The lesson of 2026 is that no single supplier — not Qatar, not Russia — should command more than 20 percent of any country’s gas supply.
- Renegotiate the architecture of Gulf energy security guarantees — the implicit US-Gulf compact that underpinned the post-1945 energy order has cracked. New frameworks must involve China and India, as the world’s largest Gulf oil importers, in the burden-sharing of strait security.
- Design a Hormuz bypass financing mechanism — Saudi Arabia’s East-West Pipeline and UAE’s Fujairah pipeline together represent 2.6 mb/d of bypass capacity against a 20 mb/d strait flow. A multilateral infrastructure fund to expand and harden these alternatives is not just prudent; it is now an urgent civilizational priority.
- Resist the siren call of short-term shale bingeing — US producers face intense pressure to ramp output rapidly. But the lesson of every prior oil shock is that supply responses built on panic investment create the next crash. Disciplined, long-cycle capital allocation — not a shale free-for-all — will better serve global energy stability.
The Long View: A Region Diminished, a World Reconfigured
In the weeks since February 28, a great deal of commentary has focused on when the Strait of Hormuz will reopen. That is the wrong question. The right question is: what kind of Middle Eastern energy order will exist on the other side of this crisis?
The Gulf producers will recover. Kuwait and Iraq will pump oil again; Saudi Aramco will restore its formidable output; even Qatar will eventually restart its LNG trains, once replacement turbines arrive from the handful of manufacturers who make them. But the aura of invincibility — the sense that Persian Gulf energy infrastructure was somehow sheltered from the logic of warfare — has been permanently shattered. Every insurer, every long-term LNG contract negotiator, every sovereign wealth fund manager will price geopolitical risk in the Gulf differently for the next generation. Capital will diversify away from the region at the margin, year after year, compounding into a structural decline in Gulf market share even before physical recovery is complete.
The deeper irony is that Iran — by striking Qatar, a Muslim neighbour with whom it shares the world’s largest gas reservoir — has accelerated precisely the outcome it most fears: a world that finds its way around the Middle East’s energy geography. US LNG will lock in long-term supply contracts with Europe and Asia that were previously occupied by Qatari molecules. Australian and Norwegian exporters will sign deals that, under normal conditions, they could never have won on price. The energy transition, messy and painful as the crisis is making it, will receive a political mandate in Tokyo, Berlin, and Seoul that no climate conference could have generated.
History will record the 2026 Strait of Hormuz crisis as an inflection point — the moment when the post-1970s global energy order, already creaking under the weight of decarbonisation pressures and geopolitical fragmentation, finally broke. What replaces it will be more diversified, more expensive to build, and more resilient by design. The scars from Ras Laffan’s bombed LNG trains will fade, in time. The strategic wounds — to Gulf leverage, to the reliability premium that Middle Eastern energy once commanded — will not.
Every delay deepens the disruption, Sultan Al Jaber warned. He was speaking about tankers. He might just as well have been speaking about history.
Discover more from The Economy
Subscribe to get the latest posts sent to your email.
-

 Markets & Finance3 months ago
Top 15 Stocks for Investment in 2026 in PSX: Your Complete Guide to Pakistan’s Best Investment Opportunities
-

 Analysis2 months ago
Brazil’s Rare Earth Race: US, EU, and China Compete for Critical Minerals as Tensions Rise
-

 Banks3 months ago
Best Investments in Pakistan 2026: Top 10 Low-Price Shares and Long-Term Picks for the PSX
-

 Analysis2 months ago
Top 10 Stocks for Investment in PSX for Quick Returns in 2026
-

 Investment3 months ago
Top 10 Mutual Fund Managers in Pakistan for Investment in 2026: A Comprehensive Guide for Optimal Returns
-

 Asia3 months ago
China’s 50% Domestic Equipment Rule: The Semiconductor Mandate Reshaping Global Tech
-

 Global Economy3 months ago
Pakistan’s Export Goldmine: 10 Game-Changing Markets Where Pakistani Businesses Are Winning Big in 2025
-

 Global Economy3 months ago
15 Most Lucrative Sectors for Investment in Pakistan: A 2025 Data-Driven Analysis