
Asia
Vladimir Putin’s Huge Windfall from the Iran War: Why the Sugar High May Not Last

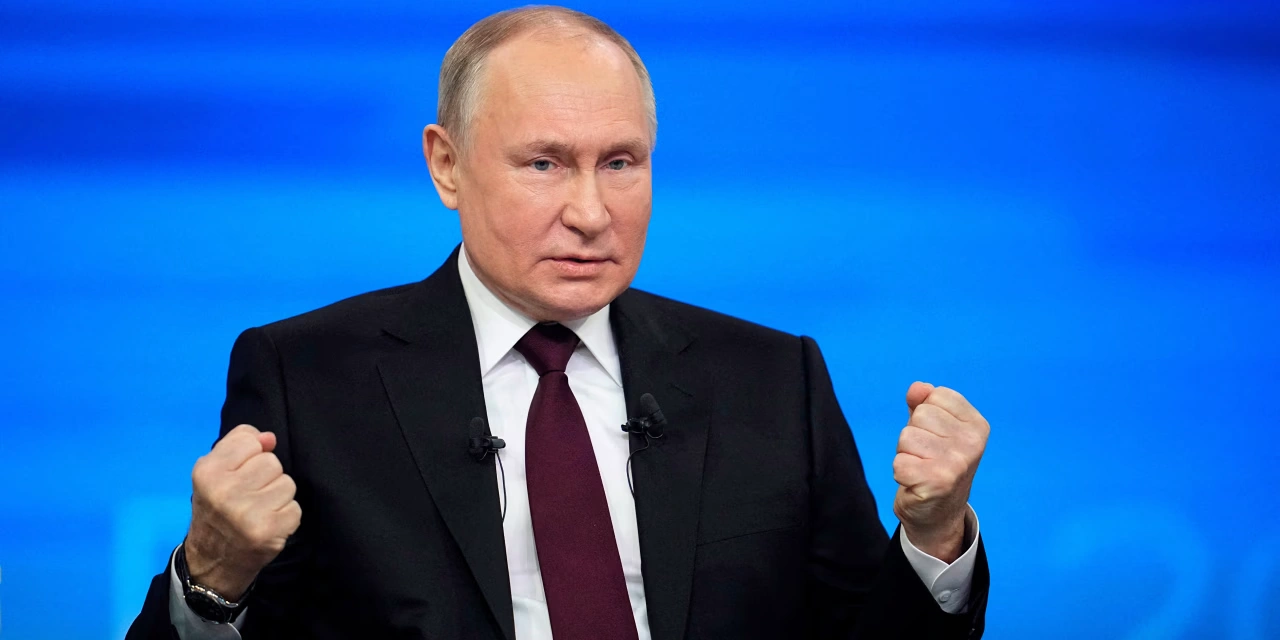
Russian oil prices have surged from $40 to over $100 a barrel in less than a fortnight. Vladimir Putin didn’t engineer this stroke of fortune — but he is quietly pocketing it. The question haunting energy desks from Houston to Mumbai is how long the party lasts.
The timing was almost cinematic. As missiles arced over the Strait of Hormuz in the opening days of March 2026 and Iranian crude abruptly vanished from global shipping lanes, the Kremlin’s oil accountants found themselves staring at spreadsheets they could scarcely believe. Urals crude price surge 2026 has become the phrase of the month in energy markets: in barely twelve days, Russia’s benchmark export blend climbed from a sanctions-depressed $40 per barrel to north of $100 — a trajectory that, as The Economist first reported, amounts to one of the most sudden revenue injections any petrostate has received since the invasion of Ukraine. Forbes calculates that every $10-per-barrel lift to Urals adds roughly $1.6 billion to Moscow’s monthly hydrocarbon revenues. Do the arithmetic on a $60 jump and the figure becomes staggering — and politically consequential in ways that extend far beyond the trading floor.
This is not a story Putin wrote. It is a story that was written for him.
The Sarah’s Midnight Pivot – How One Tanker Tells the Whole Story
On the evening of March 4, a Hong Kong-flagged vessel called the Sarah — twenty years old, unremarkable in every maritime register — completed a sharp course correction roughly 140 nautical miles southeast of Muscat. She had been loitering near the Omani coast for the better part of a week, waiting, as tanker-tracking analysts at Kpler and Vortexa now confirm, for a cargo assignment that kept shifting. When the assignment finally arrived, it was not the consignment of Middle Eastern crude her manifest had vaguely suggested. It was Russian Urals, loaded at Primorsk, bound for an Indian refinery on the west coast of Gujarat.
The Sarah is, in miniature, the entire geopolitical drama of this moment. She is part of what the industry calls the shadow fleet Russian crude network — a loose armada of ageing, often inadequately insured tankers assembled after Western majors abandoned Russian oil routes in 2022. Under normal conditions, this fleet operates at a discount, moving barrels that Western sanctions have rendered toxic to mainstream shipping and insurance markets. Under the conditions prevailing in early March 2026, it is operating at something close to a premium. With Iranian supply suddenly off the table and Brent lurching above $120, even the Sarah‘s unconventional provenance and patchy insurance history ceased to trouble her buyers. Beggars, as the saying goes, cannot be choosers — and India’s refining sector, with its voracious appetite for cheap feedstock, was not in a position to be precious.
The Sarah’s pivot is not an isolated data point. Bloomberg’s tanker-tracking desk reported that Indian refiners have snapped up approximately 30 million barrels of Russian crude in the first ten days of March alone — a volume that, spread across the country’s refining complex, represents a significant acceleration even by the elevated standards of the past three years. The Sarah and her sister vessels are not smugglers, exactly. They are the infrastructure of a sanctions regime that has been quietly, methodically hollowed out.
Three Tailwinds Handing Putin an Unexpected $1.6 Billion Windfall
Three forces have converged to produce what one senior European energy official, speaking privately, called “the sugar high Putin never asked for — and may not know how to manage.”
First: the price spike itself. The Urals-Brent spread, which had widened to an embarrassing $20–$25 discount through much of 2024 and early 2025, has collapsed dramatically. As of March 14, Urals was trading at a discount of barely $4 to Brent — a near-parity that would have been unthinkable eighteen months ago. The mechanism is straightforward: Iranian crude, which competes directly with Russian heavy-sour barrels in Asian refinery configurations, has essentially disappeared from the market. Refineries in India, China, and South Korea that had been blending Iranian and Russian feedstock are now bidding aggressively for whatever Russian supply is available. The Urals-Brent spread compression alone represents billions in additional monthly revenue for Rosneft, Lukoil, and Gazprom Neft.
Second: the extraordinary, if temporary, erosion of the sanctions architecture. Here the story takes a turn that has discomfited officials in Brussels and London considerably more than they publicly acknowledge. The Trump administration Russian oil waiver extension, formalised in a general license issued in mid-February and extended again on March 12 according to Reuters, was conceived as a pragmatic gesture to prevent a global price shock in the run-up to what Washington feared would be a disruptive Middle Eastern escalation. It has instead become, in the eyes of its critics, a subsidy to the Kremlin at the precise moment when the Kremlin is benefiting from that very escalation. The waiver permits certain categories of transaction — including, critically, Indian purchases of Russian crude above the G7 price cap — to proceed without triggering secondary sanctions. The result, as Forbes has noted, is that the price-cap mechanism, already severely strained, is now functioning as barely more than a paper constraint.
Third: China’s quiet desperation. Beijing’s role in this drama is less visible than India’s but arguably more structurally significant. Chinese independent refiners — the “teapots” of Shandong province — have been quietly rebuilding inventories of Russian ESPO blend and Urals at a pace not seen since the post-invasion purchasing surge of 2022. With Iranian barrels unavailable and Saudi Arabia managing production carefully, Chinese buyers find themselves with fewer alternatives than at any point in recent memory. This demand concentration gives Moscow unusual pricing leverage: for the first time since the sanctions regime was assembled, Russian oil exporters are, in certain grades and configurations, genuinely capacity-constrained rather than price-constrained.
Data Snapshot: Russia’s Oil Windfall in Numbers
- Urals price, March 14, 2026: ~$102/barrel (vs. ~$40 in late February)
- Urals-Brent spread: approx. –$4 (vs. –$22 in January 2026)
- Estimated monthly revenue uplift: $8–10 billion (based on ~130m barrels/month export volume)
- Indian Russian crude purchases, March 1–10: ~30 million barrels (Bloomberg)
- Shadow-fleet vessels active, Primorsk–Gujarat route: 47 (Kpler estimate, March 13)
- G7 price cap: $60/barrel — currently ~$42 below market
- US general-license waiver expiry (current extension): April 14, 2026
The Sugar High: Why This Boom Is Temporary
And yet. The history of petrostate windfalls is substantially a history of misallocated euphoria — of budget assumptions revised upward at precisely the moment when prudence counselled caution, and of fiscal structures reconfigured for a price environment that proved, in retrospect, to be an aberration rather than a new normal.
There are at least four reasons to believe that Putin’s present windfall is more confection than substance.
The most pressing is the US waiver expiry. The current general-license extension lapses on April 14. Renewing it has become politically toxic in Washington: critics on both sides of the aisle have framed it, with some justification, as a de facto subsidy to a country still prosecuting a war in Ukraine. The Treasury Department’s Office of Foreign Assets Control is under significant pressure not to issue a further extension, and several senior administration officials have privately indicated that the political calculus has shifted since February. If the waiver expires and is not renewed, the secondary-sanctions exposure for Indian and Chinese buyers increases materially — potentially enough to chill the purchasing volumes that are currently sustaining Urals prices.
The second constraint is European enforcement. The EU’s fourteenth sanctions package, adopted in late 2025, contains provisions targeting shadow-fleet operators that are only now beginning to be implemented. The Guardian has reported that three EU member states — Greece, Cyprus, and Malta, all major ship-registry and management jurisdictions — have begun issuing formal compliance notices to vessel owners suspected of shadow-fleet participation. The legal and insurance exposure for owners of vessels like the Sarah is rising in ways that have not yet been fully priced into freight markets.
Third: Indian payment hesitancy. The structural awkwardness of the India-Russia oil trade — routing payments through UAE-based intermediaries, using rupee-ruble conversion mechanisms that neither side finds entirely satisfactory — has not been resolved. Indian refiners have been willing to absorb this friction when Urals is trading at a significant discount. At near-parity with Brent, the calculation changes. IOC, HPCL, and BPCL are commercial enterprises with shareholder obligations; they will not pay a premium for Russian crude simply to accommodate Moscow’s revenue requirements. Several New Delhi-based energy executives have indicated, informally, that $95–100 Urals is approaching the threshold at which Middle Eastern or West African alternatives become genuinely competitive, logistical complications notwithstanding.
Fourth, and most structurally, there is the question of long-term demand destruction. The International Energy Agency’s March 2026 oil-market report (published the day before the Economist piece) contains a passage that has received insufficient attention: it projects that OECD oil demand will contract by 1.1 million barrels per day by end-2027, driven primarily by accelerating electric-vehicle penetration in Europe and the United States. Russia’s customer base — concentrated in Asia, where the energy transition is proceeding more slowly — provides a partial buffer. But China’s own EV market is the world’s largest, and Beijing’s long-term energy strategy explicitly targets reduced dependence on imported hydrocarbons. The demand floor beneath Russian crude is not collapsing, but it is demonstrably eroding.
What It Means for Global Energy Security and the Ukraine War
Set against the backdrop of the Ukraine conflict, now entering its fourth year, the revenue implications of this windfall are neither trivial nor transformative. Russia’s defence budget for 2026, as published by the Finance Ministry in December, assumes an average Urals price of $70 per barrel. Every dollar above that figure generates approximately $160 million annually in additional fiscal headroom. At $102 sustained through the year — an unlikely but not inconceivable scenario — the cumulative surplus above budget assumptions approaches $15 billion: meaningful, but not war-changing.
More significant, perhaps, is the political signal. Moscow has spent eighteen months managing a narrative of economic resilience under sanctions pressure — a narrative that required careful messaging precisely because the underlying data was, at points, genuinely uncomfortable. The windfall of March 2026 has handed Putin’s communications apparatus a gift: evidence, real and visible, that the Western sanctions architecture is porous, that Russia’s Asian market pivot was strategically correct, and that geopolitical chaos in one part of the world reliably generates revenue opportunities in another.
The New York Times and CNN have both noted, in recent days, the muted character of Western governments’ public response to the Urals surge. That muting is deliberate: calling attention to Putin’s windfall requires acknowledging the scale of sanctions erosion, which in turn raises uncomfortable questions about policy effectiveness that no Western capital is currently eager to answer in public.
Bloomberg’s energy desk put it with characteristic precision last week: “The price-cap was designed to constrain Russian revenues without starving global markets of supply. It is currently doing neither.”
For energy-security planners in Berlin, Tokyo, and Washington, the broader lesson of this episode may prove more durable than the episode itself. The Strait of Hormuz remains the world’s single most consequential chokepoint — a fact that the events of early March have re-dramatised with some force. Any disruption there creates immediate, cascading price effects that disproportionately benefit the alternative suppliers best positioned to absorb displaced demand. Russia, for all the damage inflicted by three years of sanctions, remains exactly such a supplier. That structural reality is not going to be wished away by policy declarations or price-cap communiqués.
The Sarah, her hull cutting south through the Arabian Sea toward Gujarat, is not carrying a political statement. She is carrying crude oil, loaded at a Russian Baltic terminal, bound for an Indian refinery that needs feedstock at a workable price. But the wake she leaves behind her traces the outline of a geopolitical problem that neither sanctions advocates nor their critics have fully resolved: how to constrain a major energy producer without either emptying your own consumers’ wallets or handing that producer a windfall every time the world’s other energy sources become unavailable.
Putin didn’t ask for this sugar high. But he is, for now, enjoying it — and spending the revenues in ways that will outlast the spike that generated them.
Discover more from The Economy
Subscribe to get the latest posts sent to your email.



The global AI retreat is not producing a uniform Asian reaction. The crucial dividing lines run through semiconductors, imported energy and domestic earnings.
The global AI retreat is not producing a uniform Asian reaction. The crucial dividing lines run through semiconductors, imported energy and domestic earnings. This analysis draws on primary documents and contemporaneous reports available on November 6, 2026; subsequent market movements or policy announcements may change the outlook.
Asian equities illustrate the danger of treating the region as a single asset class. Reuters reported on November 6 that South Korea’s Kospi had fallen about 8% and Japan’s Nikkei about 5% during the regional technology rout, while India’s Nifty 50 advanced roughly 0.51%. The divergence is notable because investors had spent years viewing Asian markets through a shared narrative of AI-led investment and export growth.
The IMF’s October Asia-Pacific outlook anticipated regional growth easing from 4.8% in 2026 to 4.4% in 2027, while still contributing disproportionately to global expansion. That is a strong headline but no guarantee for any individual exchange or company.
Chip supply chains create asymmetric risk
Japan, South Korea and Taiwan occupy different parts of the semiconductor, component and manufacturing ecosystem. Memory producers, equipment makers and foundries benefit when chip production and installation accelerate. Their shares can also fall sharply if markets question the volume, margins or ultimate returns on AI investment.
It is simplistic to equate the market reaction with the disappearance of AI demand. A business may continue growing while its share price corrects because valuations previously assumed flawless execution for years. Investors must separate an actual order cancellation from a fall in the multiple they are willing to pay for those orders.
India offers a different earnings composition.
India’s benchmarks include substantial financial, consumer and domestic-facing businesses. Lower imported crude prices can improve macroeconomic expectations through inflation, the trade balance and corporate margins. Reuters reported strong foreign buying on November 5 as sentiment improved. Such resilience can be meaningful even though it may reverse on later sessions.
An index’s headline performance can also conceal divergence. Financials may rise while smaller companies, richly valued technology suppliers or exporters weaken. A well-constructed comparison checks market breadth and earnings concentration instead of stopping at one benchmark return.
China and Hong Kong face their own constraints.
Chinese and Hong Kong-listed assets respond to property conditions, domestic consumption, export restrictions, currency dynamics and policy credibility. Their technology exposure overlaps with but is not identical to the U.S. AI trade. If global investors rotate away from expensive semiconductor leaders, relative valuations can help other markets—but only where credible profit growth supports them.
Exchange-rate effects complicate international performance. A local index can rise in home currency and still lose value for an investor whose base currency strengthens. Cross-border comparisons should therefore state whether results are in local currency or U.S. dollars.
Energy import dependence changes the ranking
The World Bank commodity outlook projects an elevated oil-price environment in 2026. Higher fuel prices reduce household purchasing power and raise transport and production costs in import-dependent economies. A reversal can offer relief, but the benefit varies with subsidy structures, hedging and exchange rates.
For Asian investors, the most revealing basket is not simply “technology versus everything else.” It includes oil-import sensitivity, export revenues, cash generation, financing costs and regulatory conditions. This is why a global shock can produce deeply divergent Asian sessions.
What a closer look at the source record shows
The available record supports a useful separation between confirmed developments and interpretation. The first column below identifies the type of evidence; the second explains the analytical use, not an independently measured market statistic.
| Research focus | How it informs this story |
|---|---|
| Confirmed evidence | Reuters Asian market divergence |
| Interpretive opportunity | Contrast national sector mixes |
| Secondary question | Use oil import exposure |
| Next verification | Track earnings guidance from memory suppliers and export manufacturers alongside crude prices and foreign portfolio flows. |
The research priority is relevance rather than sheer citation volume. Repeated references to the same press release do not represent independent confirmation, and authoritative data can support a narrower claim than an ambitious headline suggests. Wherever a numerical fact is used, the source date and stated coverage should travel with it.
How to interpret the evidence without overclaiming
The regional average hides national balance sheets. Manufacturers, banks, households and governments experience an oil shock differently. Even countries in the same region may face opposite effects through exports, import bills and currencies. In this article’s subject—Asian stock markets 2026—that distinction prevents superficially precise figures from becoming misleading conclusions. A credible account should explain exactly which evidence supports each inference and what would change the analysis.
The most useful comparison holds time and currency constant. Always align trading dates and specify whether reported returns are local-currency returns, translated-dollar returns or total returns. Otherwise, a comparison can be precise in appearance and misleading in substance. Track earnings guidance from memory suppliers and export manufacturers alongside crude prices and foreign portfolio flows. These checks are important because individual data points can be correct while the story assembled from them is incomplete.
Three specific tests make the coverage stronger:
- Contrast national sector mixes. Ask what the underlying observation actually measures, which population or companies it covers, and how recent it is. A relevant primary document outweighs a popular unsourced claim.
- Use oil import exposure. Compare plausible explanations and resist attributing every market or policy movement to one event. When an observed change has several possible causes, explain which are supported and which remain hypotheses.
- Separate multiple compression from demand. Describe what new fact would falsify the prevailing interpretation. Reporting that cannot be revised in the face of new evidence is advocacy, not analysis.
Three Asian market paths worth distinguishing
Technology spending stabilises. Asian chip exporters could recover if cloud companies reaffirm orders and memory suppliers report stable contract pricing. The recovery would still be uneven: a foundry, a memory producer and a consumer-electronics manufacturer respond to different demand drivers. Confirmation should come from corporate order books and earnings rather than a single regional index rebound.
A deeper investment retrenchment. If financing and power constraints delay new data-centre capacity, export-orientated producers in Japan, South Korea and Taiwan could face prolonged multiple compression and order revisions. Currency volatility may intensify foreign-investor returns, while an oil-price rebound would again pressure importers. The IMF’s regional growth projection would remain a baseline, not proof that equity earnings are safe.
Domestic-market rotation persists. India could continue to outperform on better energy terms of trade, bank earnings and household consumption even while North Asian technology stocks remain volatile. Yet an inflow-driven rally becomes fragile if valuations run ahead of earnings. Compare domestic profits, net foreign flows and oil import costs within each country before making regional generalisations.
A practical research checklist
A reader evaluating this issue should first open the primary sources linked in the article and check their publication dates. Next, identify the specific claim being tested, its units and its geographic or institutional scope. Then compare that evidence with at least one independent account, asking whether the sources are reporting the same underlying data or repeating one another. Finally, distinguish a dated observation from a prediction and note the developments that would demand an update.
For a working editorial desk, this sequence is equally important. A clearly dated article can remain valuable after prices or politics change if its explanations endure and its volatile numbers are identified as snapshots. An article that quietly presents yesterday’s quote as today’s fact, by contrast, loses credibility even when the broader argument is sensible.
Questions readers are asking
Why did India outperform some Asian markets on November 6?
Reuters highlighted lower oil prices, foreign inflows and rotation away from AI-related names as important contributors.
Are all Asian technology stocks exposed equally?
No. Memory, foundry, equipment, consumer electronics and software firms face different customers and valuation risks.
Does lower oil help every Asian country?
No. Net importers often benefit, while exporters and energy producers can be hurt, subject to domestic policy and exchange rates.
Which data matters for an Asia comparison?
Synchronised index closes, local currency moves, industry weights, foreign flows, sovereign yields and corporate earnings.
The judgement
The global AI retreat is not producing a uniform Asian reaction. The crucial dividing lines run through semiconductors, imported energy and domestic earnings. The most responsible conclusion is conditional: Track earnings guidance from memory suppliers and export manufacturers alongside crude prices and foreign portfolio flows. The argument should evolve when new source material is published, rather than being defended simply because it made a compelling headline on November 6. For readers, the value is a clearer distinction among what has already happened, what remains uncertain and what developments would actually change the decision.
Discover more from The Economy
Subscribe to get the latest posts sent to your email.

Asian equity markets have delivered a reminder that the AI investment boom is not simply an American technology story. South Korean memory producers, Taiwanese chip manufacturers, Japanese equipment suppliers and regional exporters are connected to global capital spending on computing. That creates an opportunity when orders surge and a vulnerability when assumptions change.
A Reuters market report on October 13 described a sharp risk-off episode in technology-linked Asian shares. Subsequent Wall Street Journal coverage described a partial rebound. Those moves are best understood as a test of expectations, not as proof that regional growth has reversed.
The first link: US AI spending and Asian earnings
The global chip supply chain has multiple layers. Advanced logic semiconductors, high-bandwidth memory, equipment, materials and packaging each respond differently to investment cycles. An AI server ordered in the United States can create revenue for numerous Asian firms, while supplier earnings remain vulnerable to delays or changes in product mix.
This concentration means broad stock indices may react strongly to a relatively narrow group of companies. The movement of an index is not necessarily a reliable representation of household consumption or the local services economy. Readers should check the contribution of leading constituents before interpreting a headline percentage drop.
Korea, Taiwan and Japan have different exposures
Korea’s market has significant memory-chip exposure. Taiwan has a major role in contract semiconductor manufacturing and its suppliers. Japan combines technology-related manufacturers with banks, exporters and domestic sectors. Exchange rates can amplify or offset changes in export competitiveness and returns for foreign investors.
Currency matters especially when an investor buys shares denominated in won, Taiwan dollars or yen. Even if a local index is unchanged, the return measured in dollars can change because of foreign-exchange movements. A regional market roundup should therefore include both equity and currency context.
Interest rates and oil can overwhelm the chip narrative
The AI industry competes for capital with governments, housing and ordinary businesses. When bond yields climb, distant profits are discounted more heavily; heavily indebted firms face rising refinancing expenses. Meanwhile high energy prices can pressure importers and manufacturers even when some technology exporters remain strong.
The IMF’s October outlook highlights both AI-related opportunities and inflation, conflict and fiscal vulnerabilities. That mixed picture argues against a single “Asia is booming” or “Asia is crashing” explanation.
The danger of extrapolating one trading session
A large daily decline can reflect positioning, forced selling or an abrupt change in sentiment. A rebound can reflect bargain hunting or short covering without resolving the original valuation issue. Neither movement establishes a sustainable trend. Investors should connect price action to revisions in earnings guidance, orders and financing conditions.
Useful evidence includes export orders, manufacturing surveys, semiconductor inventories, central-bank signals and capital flows. Compare the same measures over several months and distinguish expectations from realized data.
How to follow Asian markets responsibly
Build a dashboard with major indices, local-currency performance, exchange rates, benchmark bond yields and relevant oil prices. Record dates and market closing times; an Asian close may precede major US news that influences futures later. Avoid combining prices from different sessions as though they represent the same moment.
For a long-term investor, diversification across sectors and countries matters more than guessing the next technology stock to rebound. For a news reader, the essential question is whether a market move reflects an earnings change, financing risk or only a revision to how much investors are willing to pay.
Market structure can magnify headline moves
Market-capitalization-weighted benchmarks allocate more influence to companies with high market value. As chip and platform businesses grow, their success can make an index more concentrated. During a drawdown, selling pressure in those same names may dominate the index even if the median constituent is relatively stable. Equal-weighted sector comparisons and the share of stocks advancing can help distinguish broad weakness from concentration effects. Investors should also review whether an exchange was closed for a holiday and whether a quoted movement refers to a futures contract or the cash session. Time alignment is essential when comparing Asian and US markets.
Frequently asked questions
Why do Asian markets fall when US AI stocks sell off?
Regional firms supply chips, memory and equipment to the same global investment cycle, and investors frequently adjust exposure across markets at once.
Is a rebound proof the AI bubble is over?
No. Price recoveries do not necessarily resolve doubts about future returns and financing.
Which numbers are worth monitoring?
Earnings expectations, memory prices, exports, bond yields, currencies and oil prices give a more balanced picture than an index close alone.
Discover more from The Economy
Subscribe to get the latest posts sent to your email.
Markets & Finance
Beyond Singapore’s Borders: How Squeezed SMEs Can Unlock High-Yield Growth Across ASEAN

Faced with escalating domestic overhead, acute labor bottlenecks, and an ultra-saturated local market, Singapore’s small and medium-sized enterprises (SMEs) are approaching an operational inflection point. While the city-state remains an unrivaled global financial hub, domestic cost structures are increasingly compressing profit margins for mid-market businesses. Expanding across Southeast Asia is no longer merely a growth option—it has become a necessity for enterprise resilience and long-term value creation.
The Singapore Pressure Cooker: Why Domestic Growth Has Hit a Ceiling
Singapore SMEs contend with a uniquely challenging operating environment. According to economic assessments from the Monetary Authority of Singapore, structural cost pressures—spanning commercial real estate rents, utility hikes, and rising labor expenses—continue to outpace revenue growth across several non-oil domestic sectors.
Key factors squeezing Singapore SMEs include:
- Manpower Bottlenecks: Tightening foreign worker quotas and elevated salary thresholds under the Strategic Skills Framework have made local talent recruitment highly competitive and expensive.
- Property and Rental Overhead: Commercial and industrial space costs in prime logistics and office hubs remain among the highest in Asia, squeezing operational margins for retail, manufacturing, and services alike.
- Market Saturation: With a population of roughly 6 million, the domestic addressable market limits scale, making revenue compounding difficult without international customer acquisition.
To achieve sustainable multi-year growth, forward-looking business leaders are restructuring their footprint—using Singapore as an intellectual property (IP), treasury, and management headquarters while scaling operations into neighbor economies.
The ASEAN Dividend: Demographics, Digitalization, and Supply Chain Realignment
Southeast Asia represents a vibrant economic bloc of over 680 million consumers, characterized by rapid urbanization, an expanding middle class, and high mobile technology penetration. Research published by the Asian Development Bank highlights that regional GDP growth across ASEAN continues to outpace global averages, fueled by strong domestic demand and cross-border trade integration.
                  +-------------------------------------------------------+
                  |            Singapore Corporate Head Office            |
                  |     (IP, Treasury, Governance, R&D, Tech Core)        |
                  +-------------------------------------------------------+
                                              |
      +-----------------------+---------------+---------------+-----------------------+
      |                       |                               |                       |
      v                       v                               v                       v
+-----------+           +-----------+                   +-----------+           +-----------+
|  Vietnam  |           | Indonesia |                   | Malaysia  |           | Thailand  |
| (Mfg/Tech)|           | (Consumer)|                   | (Logistics|           | (Industrial|
|           |           |           |                   | & Services|           | & Auto Ops|
+-----------+           +-----------+                   +-----------+           +-----------+
Three macro drivers make ASEAN the primary expansion target for Singaporean firms:
- Supply Chain Diversification (“China+1”): Global multinationals and regional enterprises are diversifying manufacturing hubs toward Southeast Asia to enhance supply chain resilience, boosting local business ecosystems.
- Accelerated Digital Transformation: Digital economy report insights from McKinsey & Company reveal that regional cross-border e-commerce, fintech adoption, and digital services are projected to triple in market value by 2030.
- Regional Trade Integration: Agreements such as the Regional Comprehensive Economic Partnership (RCEP) and ASEAN Free Trade Area (AFTA) reduce trade barriers, lower tariffs, and simplify cross-border logistics.
Comparative Expansion Matrix for Target ASEAN Markets
Selecting the right expansion destination depends on sector alignment, talent requirements, and cost structures. The following framework maps core opportunities for Singapore SMEs across major ASEAN growth markets:
| Expansion Market | Primary Growth Drivers | Strategic Cost Advantage | High-Potential Sectors | Market Entry Complexity |
| Vietnam | Rapid industrialization, tech talent pool, strong export orientation | Low manufacturing and engineering labor costs | Precision engineering, electronics, software development | Moderate (Requires navigating local regulatory channels) |
| Indonesia | Massive domestic market (275M+ population), rising consumer class | High consumer volume potential, lower operational costs | B2C e-commerce, consumer tech, logistics, agritech | Moderate to High (Complex licensing & local partner rules) |
| Malaysia | Proximity to Singapore, shared talent language, integrated supply chains | Lower land and talent costs with minimal cultural friction | Cross-border logistics, professional services, food manufacturing | Low (High synergy with SG business models) |
| Thailand | Strong industrial base, advanced infrastructure, EV ecosystem | Cost-effective industrial facilities and skilled labor | Advanced manufacturing, automotive supply, healthcare, tourism tech | Moderate (Language barriers require local executive talent) |
A 4-Step Actionable Roadmap for Overseas Regionalization
Expanding across borders requires structured execution to avoid capital misallocation. Enterprise leaders can adopt this four-phase framework to mitigate market entry risks:
- Leverage Institutional Support and Co-FundingBefore committing capital, utilize government-backed regionalization initiatives. Programs administered by Enterprise Singapore—such as the Market Readiness Assistance (MRA) grant and the Enterprise Development Grant (EDG)—provide co-funding for market studies, legal set-up, and overseas business matching.
- Adopt a “Hub-and-Spoke” Operational ModelMaintain high-value activities (financing, IP management, advanced R&D, regional leadership) in Singapore to preserve institutional trust and regulatory clarity. Establish operational “spokes” in target ASEAN countries to handle high-volume manufacturing, customer support, and local marketing.
- Form Local Joint Ventures and Strategic AlliancesDirect market entry can carry regulatory hurdles and cultural blind spots. Partnering with established in-market distributors or joint-venture partners accelerates distribution access and ensures regulatory compliance.
- Capitalize on Cross-Border Digital InteroperabilityWith initiatives backed by the ASEAN Secretariat to build unified cross-border payment rails (such as real-time QR payment linkages between Singapore, Malaysia, Thailand, and Indonesia), businesses can handle cross-border payments with reduced friction and lower FX transaction costs.
Mitigating Risk: Structural Protocols for Cross-Border Success
While the growth prospects are significant, cross-border expansion presents operational challenges. SME leadership must address key risk categories:
- Regulatory and Foreign Ownership Restrictions: Certain jurisdictions enforce foreign ownership caps in specific sectors. Engaging qualified legal counsel early ensures proper corporate structuring and compliance with local equity mandates.
- Foreign Exchange Exposure: Currency volatility across emerging ASEAN markets can erode operating profits. Implementing formal hedging policies through treasury banking partners mitigates FX exposure.
- Taxation Structuring: Companies must optimize transfer pricing and leverage bilateral Avoidance of Double Taxation Agreements (DTAs) signed between Singapore and ASEAN member states to avoid overlapping tax obligations.
SMEs that treat regional expansion as a strategic imperative rather than a reactive survival tactic can leverage Singapore’s regional anchor status to capture long-term market share across Southeast Asia.
Discover more from The Economy
Subscribe to get the latest posts sent to your email.

Stock Market Crash 2026? What the November Rout Actually Tells Us

IMF Global Outlook 2027: The Recovery Is Real, but the Divide Is Growing

World Bank Debt Report 2026: The $9.4 Trillion Burden Behind the Recovery

Singapore Stock Market Outlook 2027: The STI’s Bank-and-Yield Test

Asian Stock Markets: Why the AI Rout Is Dividing the Region

Global Markets Today: The AI Sell-Off Has Become a Test of Liquidity

Global Finance 2027: Debt, Inflation and AI Are Pulling the Economy Apart

Brian Kemp’s Georgia Legacy: Economic Growth, Elections and the Costs of His Policy Choices

Dow Futures vs Dow Jones: What E-mini Contracts Really Tell You Before Wall Street Opens

China Tape Maker Stock Debut: Crown New Materials Soared 787%

Apple’s Earnings Beat Had a Catch: Look Past the Tariff Refund

Social Security Payments in November 2026: The Full Calendar and Two Important Changes

Johor–Singapore SEZ’s $21.8 Billion Bet: The Hard Part Starts Now

China’s 175 Trillion AI Tokens Reveal a Bigger Shift: The AI Boom

Crude Oil & Petroleum Market Analysis: OPEC+ Decisions and Price Forecasts

Top US Convenience Store Chains: Store Counts, EV Charging, and Sales Trends

Social Security Extra $90 Deposit: Who Qualifies for the October 2026 Medicare Rebate?

Gold Price Outlook 2026: The Forces Behind the Forecasts—and What Could Reverse Them

Stock Market Crash in 2026? Warning Signs, Scenarios and a Calm Investor Checklist

Anthropic Bans Sustained Abuse of Claude AI Under New Usage Policy Effective November 12, 2026

US–Iran Conflict in October 2026: Hormuz, Oil Prices and Diplomacy

US–China Critical Minerals Competition: Why a Trade Deal Cannot Fix Every Supply Risk

SSI November 2026 Payment: Why Benefits Arrive October 30

US–China AI Export Controls in 2026: Chips, Testing Rules and Corporate Risk

China’s AI Microdrama Boom: How Beijing Is Reshaping Global Media

EU vs UK Electric Vehicle Tariffs: Impact on Automotive Supply Chains & Consumer Prices

Pakistan IMF Programme 2026: Why Bailouts Keep Returning

Q3 2026 Earnings Preview: Can Record Profit Expectations Keep Wall Street’s Rally Alive?
-

 Markets & Finance10 months ago
Top 15 Stocks for Investment in 2026 in PSX: Your Complete Guide to Pakistan’s Best Investment Opportunities
-

 Analysis9 months ago
Johor’s Investment Boom: The Hidden Costs Behind Malaysia’s Most Ambitious Economic Surge
-

 Analysis9 months ago
Top 10 Stocks for Investment in PSX for Quick Returns in 2026
-

 Banks10 months ago
Best Investments in Pakistan 2026: Top 10 Low-Price Shares and Long-Term Picks for the PSX
-

 Analysis9 months ago
Brazil’s Rare Earth Race: US, EU, and China Compete for Critical Minerals as Tensions Rise
-

 Investment10 months ago
Top 10 Mutual Fund Managers in Pakistan for Investment in 2026: A Comprehensive Guide for Optimal Returns
-

 Global Economy10 months ago
15 Most Lucrative Sectors for Investment in Pakistan: A 2025 Data-Driven Analysis
-

 Global Economy10 months ago
Pakistan’s Export Goldmine: 10 Game-Changing Markets Where Pakistani Businesses Are Winning Big in 2025