
Analysis
Inside HSBC’s 2026 Restructuring: The $600bn Balance Sheet Optimization Play
In the mahogany-rowed offices of Canary Wharf, the air has shifted. For decades, HSBC—the “World’s Local Bank”—tried to be everything to everyone, a sprawling colonial-era relic attempting to compete in every corner of the financial universe. But under the clinical leadership of CEO Georges Elhedery, the bank is shedding its skin.
The result? The emergence of a $600 billion debt machine.
By pivoting away from high-glamour, low-yield advisory and equity underwriting in Western markets, HSBC has effectively doubled down on what it does best: moving massive amounts of credit through its global arteries. As revealed in the HSBC 3Q 2025 Earnings Release, the bank is no longer just a lender; it is a high-velocity origination and distribution engine.
The $600 Billion Balance Sheet: HSBC’s New Powerhouse
At the heart of Elhedery’s “Simplification” program is the newly minted Corporate and Institutional Banking (CIB) division. This isn’t just a name change; it’s a consolidation of power. By merging Global Banking and Markets with Commercial Banking, HSBC has created a unit with a near-$600 billion balance sheet dedicated to dominating the credit lifecycle.
This strategy—which we might call HSBC balance sheet optimization—is designed to exploit the bank’s unique footprint. While Wall Street titans like JPMorgan often struggle with local liquidity in emerging markets, HSBC sits on a $1.7 trillion deposit base (as of 3Q 2025).
Why the Shift to Debt?
The math is simple. Equity underwriting is volatile and requires expensive “star” bankers. Debt financing, however, is the bread and butter of global trade. By focusing on HSBC financing strategies that prioritize debt origination over M&A advice, the bank is targeting more predictable, recurring revenue streams.
“We are moving from 0% single accountability… to now about 60% of our revenue generated under single accountability,” Elhedery recently noted, signaling an end to the “matrix” bureaucracy that once slowed the bank to a crawl.
The Mechanics of the Machine: CLOs, SRTs, and Private Credit
To keep this machine running without falling foul of stringent capital requirements, HSBC is employing a sophisticated toolkit of financial engineering.
The “machine” functions through three primary levers:
- Significant Risk Transfers (SRTs): By selling the “first loss” piece of its loan portfolios to private investors, HSBC can reduce its risk-weighted assets (RWAs) without actually selling the loans. This allows for rapid capital recycling.
- Collateralized Loan Obligations (CLOs): HSBC has become a dominant force in the CLO market, bundling mid-market loans into tradable securities, essentially acting as a bridge between corporate borrowers and yield-hungry institutional investors.
- HSBC Private Credit Alliances: In a “if you can’t beat ’em, join ’em” move, the bank has formed deep partnerships with private credit funds. This allows HSBC to originate loans that might be too risky for its own balance sheet and pass them off to partners, earning a fee in the process.
This shift toward global debt distribution has allowed HSBC to report a Q3 2025 pre-tax profit of $7.7 billion (excluding notable items), as reported by Reuters.
The Rivalry: How HSBC is Competing with JPMorgan in Debt Markets
For years, the narrative was that US banks had won the global banking war. However, 2025 has seen a surprising counter-offensive. While JPMorgan remains the undisputed king of the “bulge bracket,” HSBC is winning the battle for the “Global South” and tech-heavy corridors.
Data from Bloomberg suggests that HSBC has overtaken several US peers in dollar-denominated bond bookrunning for tech giants and emerging market sovereigns. The bank’s ability to offer “end-to-end” financing—from simple credit lines to complex cross-border debt issuance—makes it a formidable opponent.
| Feature | HSBC Strategy | JPMorgan Strategy |
| Primary Focus | Debt Origination & Trade Finance | Full-service Investment Banking |
| Geographic Edge | Asia & Middle East (The “East-West” Bridge) | US Domestic & Global M&A |
| Capital Tool | Balance Sheet Scale ($3T+ Assets) | Market Making & Fee-Based Advisory |
Risks in the Gears: Macroeconomic Headwinds
No machine is without its friction points. As The Economist has frequently warned, a “debt machine” is only as healthy as the global economy’s ability to service that debt.
- Interest Rate Volatility: While high rates have boosted banking net interest income (NII) to an expected $43 billion+ for 2025, a sharp “hard landing” could lead to a spike in expected credit losses (ECLs).
- The Hong Kong Factor: Despite the pivot, HSBC remains heavily exposed to the Hong Kong commercial real estate (CRE) sector, which has seen significant pressure in 2025.
- Regulatory Scrutiny: Regulators are increasingly wary of “shadow banking” ties, particularly the private credit alliances that HSBC is now championing.
Conclusion: The Investor’s Journey
HSBC’s transformation is a journey from a sprawling empire to a focused, high-tech fortress. For investors, the appeal lies in the bank’s commitment to a 50% dividend payout ratio and its upgraded Return on Tangible Equity (RoTE) guidance of “mid-teens or better” for 2025.
By fashioning a $600 billion debt machine, Georges Elhedery isn’t just cutting costs; he is redefining what it means to be a global bank in a fragmented world. Whether this machine can weather the next global downturn remains the $600 billion question.
Discover more from The Economy
Subscribe to get the latest posts sent to your email.


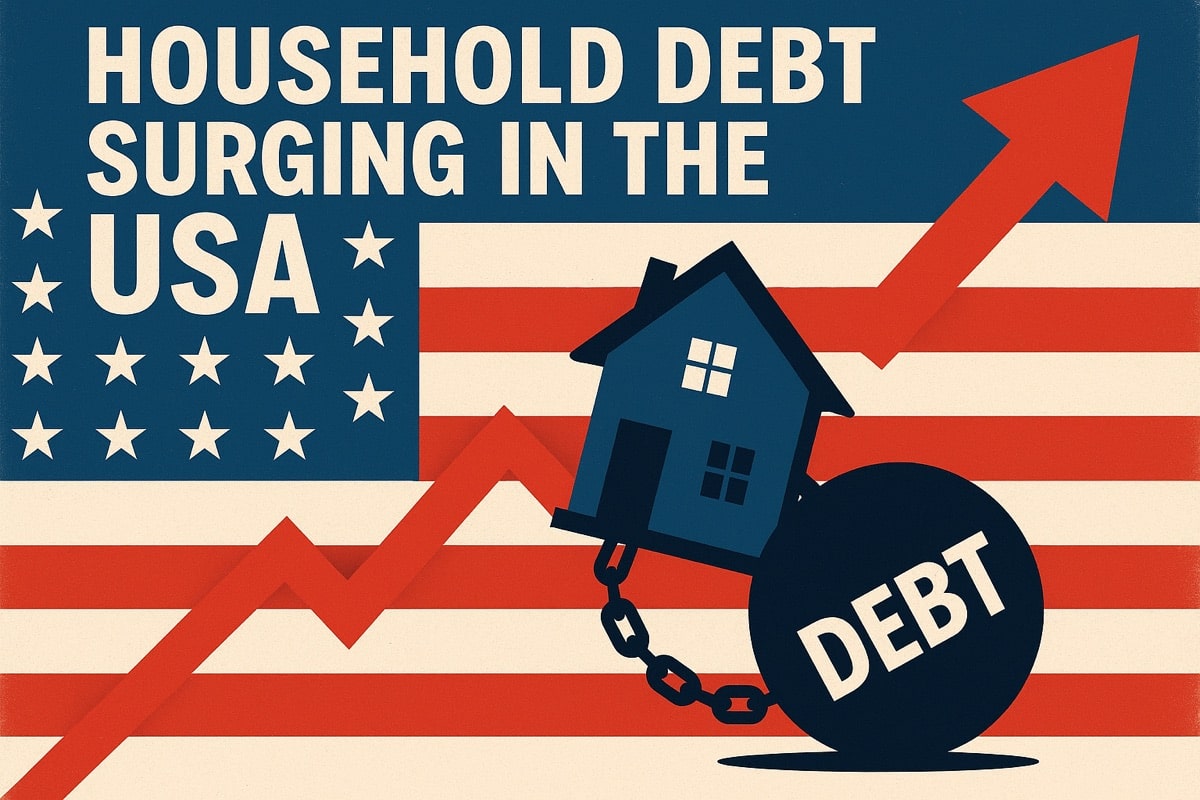
US household debt has risen to $18.8 trillion in Q1 2026 as 2.6 million additional student loan borrowers default and credit card balances stay near record highs. Here’s what the data reveals about the true state of American household finances.
Introduction: Behind the Economic Headlines, a Household Finance Crisis
The macroeconomic headlines of 2026 have been dominated by oil prices, the Iran war, and Federal Reserve drama. But beneath the market volatility and geopolitical maneuvering, a quieter and more personal crisis has been building in American household balance sheets — one that affects tens of millions of families far more directly than the dot plot or the Brent crude price.
The latest data from the Federal Reserve Bank of New York tells a sobering story: total US household debt has risen to $18.8 trillion, credit card balances remain near record levels despite a modest seasonal dip, and student loan defaults are surging at a pace that threatens the financial futures of millions of borrowers who never saw the crisis coming (Experian).
This article provides a comprehensive breakdown of where that debt sits, who is feeling the most pain, and what the numbers mean for the broader US economy.
The $18.8 Trillion Household Debt Mountain
According to the Federal Reserve Bank of New York’s latest Quarterly Report on Household Debt and Credit, total household debt rose slightly to $18.8 trillion in Q1 2026 (Experian). The increase was driven by:
- Mortgage balances — the largest component of household debt, reflecting persistently high home prices and elevated interest rates
- Auto loan balances — rising vehicle prices have pushed loan amounts higher even as transaction volumes moderate
- Home equity balances — homeowners drawing on equity built during the price surge, often to manage cash flow under inflationary pressure
Where Credit Card Debt Fits
Credit card balances showed a modest seasonal decline in Q1, falling $25 billion to $1.25 trillion — a pattern consistent with households paying down holiday spending in the first quarter (Experian). However, context is critical:
- The drop is seasonal, not structural — balances rose sharply through H2 2025 before this Q1 dip
- At $1.25 trillion, credit card balances remain near historic highs
- The credit card delinquency transition rate ticked down modestly from 8.7% to 8.6% annually — but at nearly 9%, this figure represents millions of households struggling to meet minimum payments
The Student Loan Default Surge: 2.6 Million New Defaults in One Quarter
The most alarming data point in the Q1 2026 household debt report involves federal student loans — a market where pandemic-era protections have expired and the consequences are now arriving with force.
According to the New York Fed, approximately 2.6 million additional federal student loan borrowers had their loans transferred to the Department of Education’s Default Resolution Group during Q1 2026 — following approximately 1 million defaults in late 2025 (Experian).
Who Are These Borrowers?
The profile of newly defaulted borrowers reveals a generation caught in a policy gap:
- Average age: nearly 39 years old — not recent graduates, but mid-career adults
- Many were current on their loans before the pandemic payment pause began in 2020 — the pause allowed them to divert loan payments to other needs, but also disrupted the financial habits and budget structures that supported regular repayment
- Average credit score drop: 91 points upon default — a devastating impact that affects their ability to rent housing, obtain car loans, or qualify for future credit (Experian)
In total, the cumulative wave of defaults since late 2025 represents one of the largest simultaneous hits to consumer credit profiles in modern US history.
The Consequences of Defaulting on Federal Student Loans
Defaulting on a federal student loan triggers a cascade of financial consequences that extend far beyond the loan itself:
- Wage garnishment — the federal government can garnish up to 15% of disposable income without a court order
- Tax refund seizure — the government can intercept federal and state tax refunds
- Federal benefit offsets — Social Security payments can be reduced
- Credit score destruction — the 91-point average drop makes housing, transportation, and future education financing significantly more expensive or inaccessible
- Exclusion from federal programs — defaulted borrowers may be ineligible for additional federal student aid or certain government employment
“Defaulting on a federal student loan has serious, long-lasting consequences,” Experian’s analysis notes. “While collections on defaulted loans are currently paused, that pause may not last.” (Experian)
The current pause on collections — a post-pandemic accommodation — provides temporary relief but does not resolve the underlying default status. When collections resume, millions of borrowers will face simultaneous enforcement actions.
The Inflation-Debt Spiral: How Rising Prices Feed the Default Wave
The connection between the current inflation environment and the surge in student loan defaults is not coincidental — it is structural.
At 4.2% CPI (CBS News), every dollar of after-tax income buys less than it did a year ago. For borrowers who were already stretching their budgets to service student debt, the inflationary squeeze — particularly in food (+3.2%), shelter (+3.3%), and especially energy (+28.4%) — created impossible math:
- Fixed loan payments + rising cost of living = insufficient income for both
- The resolution: stop paying the loan
This is not irresponsibility. It is a rational triage of competing financial obligations under conditions of economic stress. But it has catastrophic long-term consequences for the borrowers making this calculation.
What the Debt Data Means for the US Economy
The $18.8 trillion household debt figure matters beyond individual households — it has macroeconomic implications:
Consumer Spending Risk
Consumer spending drives approximately 70% of US GDP. When households are stretched by debt service obligations, spending on discretionary items contracts. The credit delinquency rate near 9% indicates a meaningful share of the population is already at or past the breaking point.
Financial System Stability
While federal student loans (held by the government) do not pose direct systemic banking risk, the broader pattern of consumer credit stress — elevated delinquencies across credit cards, auto loans, and mortgages — increases the probability of consumer-driven economic slowdown.
Fed Policy Complexity
High household debt loads make monetary tightening more dangerous. Every 25-basis-point rate hike increases the variable-rate borrowing costs for millions of households. The Fed must weigh inflation control against the risk of tipping already-stressed borrowers into default or deeper distress.
Practical Guidance: What Borrowers and Households Should Do Now
If You Have Federal Student Loans in or Near Default:
- Contact the Default Resolution Group or your loan servicer immediately — income-driven repayment plans can reduce monthly payments substantially
- Do not ignore notices — passive default leads to collections; active engagement preserves options
- Explore rehabilitation programs — one successful rehabilitation removes a default from your credit report
If You Carry High Credit Card Balances:
- Prioritize the highest-rate balances for accelerated paydown
- Consider balance transfer cards — competitive introductory rates are available even in the current rate environment
- Build an emergency fund to avoid cycling new charges back onto cleared balances
If You Are Managing Rising Mortgage or Auto Costs:
- Review your budget for recurring subscriptions and discretionary categories
- Explore refinancing opportunities — even in a flat rate environment, some borrowers can find marginal improvements
- Consider reaching out to lenders proactively if you anticipate difficulty — most have hardship programs not well-advertised
The Bigger Picture: What $18.8 Trillion in Debt Tells Us
The household debt picture in Q1 2026 is a portrait of an economy under simultaneous pressure from multiple directions: inflation eroding purchasing power, a supply-shock-driven energy price surge, expiring pandemic-era support programs, and a housing market still structurally unaffordable for many.
The $18.8 trillion figure is not in itself a crisis signal — debt can be sustainable at high levels if income and asset values grow proportionally. But the surge in student loan defaults, the near-record credit card balances, and the delinquency rates approaching 9% suggest that a meaningful portion of the household debt load is becoming unsustainable for the borrowers carrying it.
The new housing bill, if signed into law, offers some long-term structural relief. But for the 2.6 million borrowers who defaulted in Q1 2026 alone, that relief comes too late.
Frequently Asked Questions (FAQ)
Q: What is total US household debt in 2026?
Total US household debt reached $18.8 trillion in Q1 2026, according to the New York Federal Reserve Bank’s Quarterly Report on Household Debt and Credit.
Q: How many student loan borrowers defaulted in 2026?
Approximately 2.6 million additional federal student loan borrowers had their loans transferred to the Default Resolution Group in Q1 2026 alone, following approximately 1 million defaults in late 2025.
Q: What happens when you default on a federal student loan?
Consequences include wage garnishment, tax refund seizure, federal benefit offsets, a severe credit score drop (average 91 points), and exclusion from future federal aid programs.
Q: What is the US credit card delinquency rate in 2026?
The annual credit card delinquency transition rate was approximately 8.6% in Q1 2026 — down slightly from 8.7% but still near generationally high levels.
Q: How does inflation affect student loan defaults?
Rising costs of living — particularly energy (+28.4%), food (+3.2%), and shelter (+3.3%) — squeeze household budgets, making it increasingly difficult for borrowers to simultaneously service debt and meet essential expenses. Many borrowers facing this squeeze prioritize essential costs and default on student loans.
Discover more from The Economy
Subscribe to get the latest posts sent to your email.
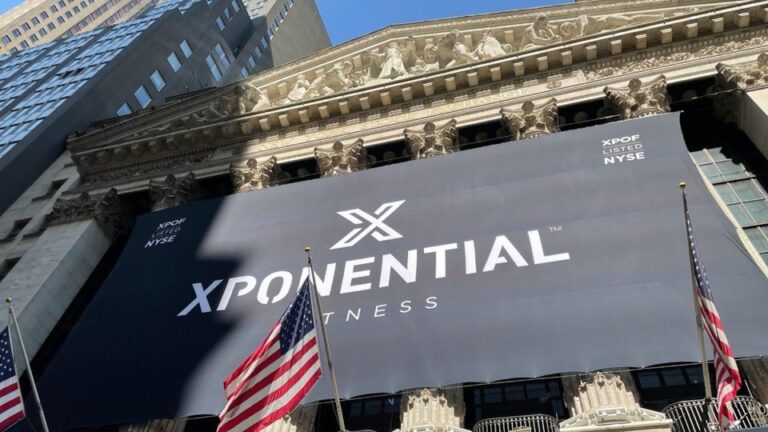
The pitch was intoxicatingly simple. Buy a boutique fitness studio, tap into a proven corporate playbook, and ride the post-pandemic wellness boom to financial independence. For the franchisees of Pure Barre and CycleBar, that promise has officially ruptured. Xponential Fitness, the aggressive conglomerate behind these ubiquitous neon-lit studios, was just ordered to pay $3.97 million for misleading the very people who bankrolled its rapid expansion. This is not merely a localized dispute between disgruntled business owners and a corporate parent. It is a systemic indictment of a business model that treats human ambition as expendable capital.
Boutique fitness is no longer just about endorphins and community; it is an industrialized asset class. Over the last decade, private equity firms and corporate consolidators transformed the neighborhood yoga or cycling studio into a hyper-financialised franchising machine. Yet the glossy facade of the global wellness economy, valued at roughly $5.6 trillion by industry analysts, hides a deeply asymmetrical power dynamic. At the center sits Xponential Fitness, a company that scaled ruthlessly by selling a “business in a box” concept to mid-career professionals, retirees, and corporate defectors.
The structural flaw in this ecosystem is one of misaligned incentives. The franchisor makes the bulk of its money on initial franchise fees, mandatory equipment purchases, and royalty percentages drawn from top-line revenue, whether the individual studio turns a profit or bleeds cash. This creates a dangerous temptation to sell the dream at volume, irrespective of the unit-level reality. As borrowing costs have climbed globally, the debt burdens shouldered by these small operators have become mathematically unsustainable, exposing the cracks in the corporate narrative.
The Core Development: Anatomy of a Judgment
The recent $3.97 million judgment is a watershed moment in the expanding Xponential Fitness franchise lawsuit saga. The core allegation arbitrated in this case is as old as commerce itself: selling a financial fiction. Legal arbiters found that the parent company systematically misled franchisees regarding the financial viability, build-out costs, and operating metrics required to open and sustain a boutique studio.
For the prospective buyer, the primary shield against corporate deception is supposed to be the Franchise Disclosure Document (FDD). In the case of CycleBar and Pure Barre, plaintiffs successfully argued that the initial investment figures presented in these legal disclosures were artificially suppressed. A prospective owner might be told a build-out costs $350,000, only to discover that mandatory corporate vendors, supply-chain markups, and required marketing spends push the actual capital expenditure well past $500,000 before the doors even open.
This financial penalty validates a narrative that has been building since June 2023, when a devastating report by short-seller Fuzzy Panda Research accused Xponential of hiding hundreds of failing studios and running a business model that inevitably destroyed franchisee capital. Shortly thereafter, the company’s founder and chief executive, Anthony Geisler, abruptly resigned amid mounting internal investigations. Reuters has reported extensively on the Federal Trade Commission’s mounting scrutiny of deceptive practices within the franchise sector, signaling that this $3.97 million ruling is likely the beginning of a much wider regulatory reckoning.
To understand the mechanics of the deception, one must look at the mandated supply chains. Franchisees are rarely allowed to source their own exercise bikes, ballet barres, or flooring. They must buy proprietary equipment directly from the franchisor or its designated affiliates. If a franchisor quietly inflates the cost of a stationary bike or a specialized sound system, it captures immediate margin while the franchisee takes on a heavier Small Business Administration (SBA) loan. When revenues fail to meet the lofty projections touted during the sales pitch, the local operator is left holding a crushing debt load while the corporate parent reports another quarter of franchise fee growth to Wall Street.
The Analytical Layer: The Illusion of Sweat Equity
Why do intelligent, well-capitalised professionals fall into this trap? The answer lies in the psychological architecture of the franchise pitch. Boutique fitness specifically preys on the modern desire for purpose-driven entrepreneurship. Buyers are not just purchasing a cash-flow vehicle; they are buying an identity. They want to be the mayor of their local wellness community. Corporate sales teams weaponize this emotion, presenting the franchise as a turnkey operation where success is guaranteed so long as the franchisee follows the manual.
Why is Xponential Fitness being sued? Franchisees allege the company engaged in deceptive sales tactics by dramatically understating the costs required to open a studio and overstating potential revenues. The lawsuit claims corporate leadership manipulated financial performance representations, leaving hundreds of local owners burdened with insurmountable debt and failing boutique fitness locations.
The primary legal battlefield in these disputes is Item 19 of the Franchise Disclosure Document. This section allows, but does not technically require, a franchisor to make Financial Performance Representations (FPRs). If a Pure Barre parent company penalty is going to fundamentally change the industry, it will be by forcing regulators to close the loopholes in Item 19. Historically, franchisors have manipulated these figures through omission. They might report the average gross revenue of studios open for more than two years, conveniently excluding the dozens of locations that went bankrupt in month 18. They present a survivor’s bias as a baseline expectation.
The unit economics of a boutique fitness studio are notoriously fragile. A CycleBar misleading franchise owners about capacity utilization is a fatal blow. These businesses have high fixed costs—commercial rent in premium retail plazas, expensive proprietary equipment leases, ASCAP music licensing fees, and corporate royalty payments. The variable costs, primarily instructor wages and local marketing, are also rising. To break even, a studio needs a highly specific number of recurring monthly memberships. If corporate projections overestimate local market demand by even 15 percent, the studio will mathematically never turn a profit.
The Financial Times has repeatedly highlighted how private equity’s reliance on franchise models often strips unit-level profitability to inflate corporate valuations. When a brand is owned by an institutional investor looking for an exit within five to seven years, the incentive is to rapidly expand the footprint. More signed franchise agreements equal higher projected revenue, which justifies a higher multiple during an IPO or sale. The actual, long-term survival of a Pure Barre studio in a suburban strip mall is entirely secondary to the immediate liquidity event of the corporate parent.
Implications & Second-Order Effects: The Coming Wave
The downstream consequences of this $3.97 million judgment extend far beyond the balance sheet of Xponential Fitness. This ruling provides a vital piece of case law for hundreds of other distressed franchisees currently bound by mandatory arbitration clauses. It pierces the corporate veil of deniability.
The most immediate secondary effect will be felt in the commercial real estate sector. Boutique fitness franchises have been a crucial tenant class for commercial landlords recovering from the retail apocalypse. If the financial models underpinning these studios are fundamentally broken, landlords are sitting on millions of square feet of precarious leases. When a franchisee defaults, the corporate parent rarely steps in to assume the lease. Instead, the local operator declares personal bankruptcy, the landlord is left with an empty, highly specialized space that is expensive to retrofit, and the commercial real estate market takes another silent hit.
Furthermore, this saga is poised to trigger severe tightening in small business lending. A vast majority of boutique fitness franchise risks are underwritten by SBA loans, which require the borrower to sign a personal guarantee. This means that when the business fails, the bank can seize the franchisee’s home, their retirement accounts, and their children’s college funds. The World Bank warns that high interest rates will continue to expose highly leveraged, low-margin business models. A franchise that looked viable with a 4 percent loan in 2019 is a financial death trap at 9 percent in today’s macroeconomic climate. Lenders, suddenly aware that franchisor revenue projections may be fictionalized, will inevitably demand higher collateral and impose stricter underwriting standards on the entire franchise sector.
What follows, however, is the regulatory response. The Federal Trade Commission, under Chair Lina Khan, has already signaled an aggressive pivot toward investigating the power imbalances inherent in franchise agreements. For decades, the FTC Franchise Rule has been treated as a disclosure requirement rather than a consumer protection enforcement mechanism. The agency essentially operated on the premise that as long as the franchisor put the risks in the FDD, the buyer was responsible. This ruling gives regulators the political capital to shift from passive disclosure oversight to active fraud enforcement. If the FTC begins demanding audited, unit-level profitability metrics before a franchisor can legally sell a new territory, the entire velocity of the $800 billion franchise industry will decelerate.
Competing Perspectives: The Architecture of Risk
Yet, to lay the entirety of the blame at the feet of corporate executives is to ignore the fundamental premise of capitalism. A dissenting perspective—one fiercely defended by corporate franchisors and trade groups—is the principle of caveat emptor. Let the buyer beware.
The International Franchise Association and corporate defense attorneys argue that a franchise agreement is a commercial contract between sophisticated adults, not a consumer protection issue. Prospective franchisees are explicitly instructed, in bold lettering on the first page of the FDD, to hire independent legal counsel and financial advisors before signing. The documents state clearly that business ownership carries an inherent risk of total capital loss and that previous corporate success does not guarantee future individual results.
From the franchisor’s vantage point, the failure of a specific CycleBar or Club Pilates location is rarely a result of corporate malice. Instead, they point to poor local execution. They argue that failed franchisees simply did not follow the mandated marketing playbook, hired subpar instructors, or failed to aggressively manage their local sales funnels. In this view, disgruntled franchisees are simply failed entrepreneurs seeking a scapegoat for their own operational incompetence.
The Economist frequently notes that regulatory overreach in the franchise sector risks stifling a model that has historically provided a reliable ladder to the middle class for millions of entrepreneurs. If regulators make it legally perilous for a franchisor to estimate potential earnings, the flow of capital into small business creation could dry up. The defense insists that while bad actors exist, punishing an entire corporate structure for the failure of localized units destroys the very mechanism that allows brands to scale efficiently across global markets.
That said, the “sophisticated buyer” defense begins to look dangerously thin when an arbitration panel uncovers evidence of systemic, intentional obfuscation. When a corporation knows that its mandated supply chain costs are destroying unit economics, yet continues to sell new territories using outdated or manipulated financial models, the line between aggressive salesmanship and actionable fraud evaporates.
The Bill Comes Due
The $3.97 million judgment against Xponential Fitness is not a fatal blow to a publicly traded conglomerate of its size. It is, instead, a dangerous precedent. It forces a glaring light onto the dark matter of the modern franchise economy: the undeniable reality that corporate growth is frequently subsidized by the localized ruin of individual operators.
The tension here is irreducible. A corporate entity has an obligation to its shareholders to maximize revenue, while a franchisee needs unit-level profitability to survive. For years, the industry pretended these two goals were perfectly aligned. This legal ruling officially shatters that pretense. The era of selling financial illusions under the guise of wellness is over.
Discover more from The Economy
Subscribe to get the latest posts sent to your email.
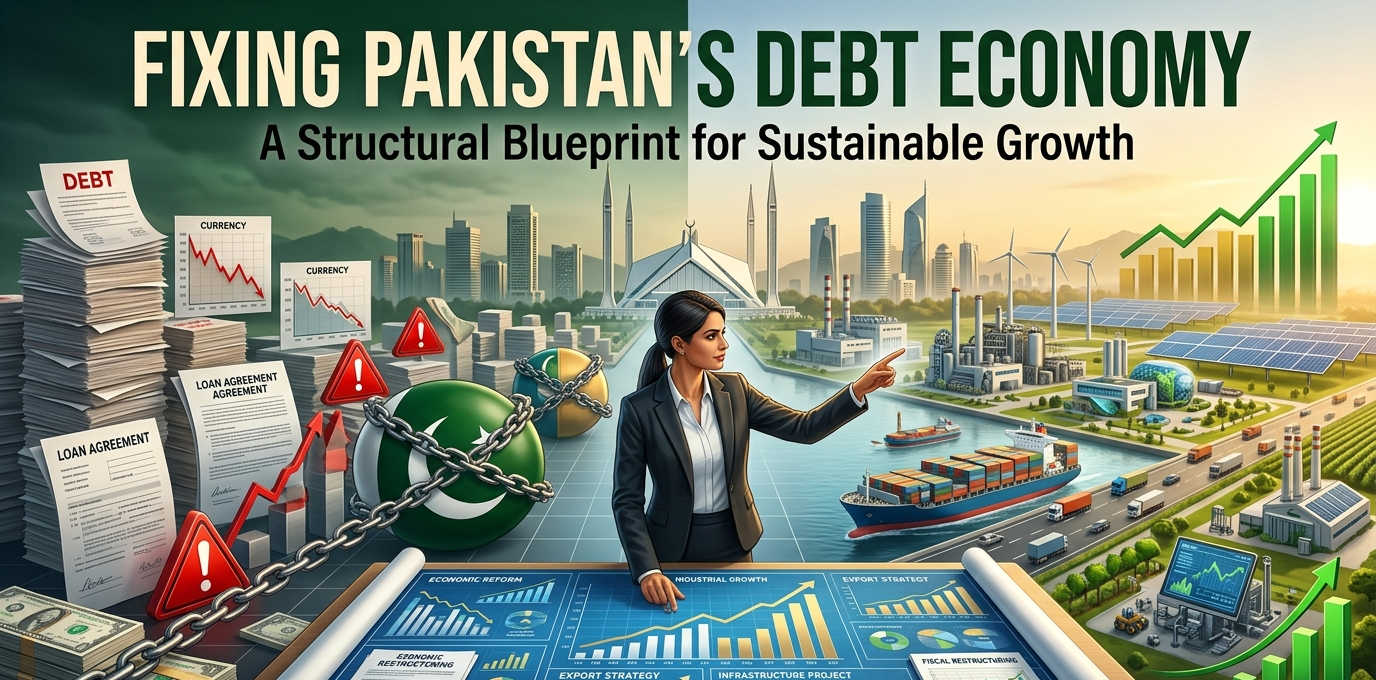
In the fluorescent-lit corridors of the Ministry of Finance in Islamabad, the arithmetic has long stopped making sense. Pakistan spends more than half its federal revenue simply paying interest on past borrowing. The sovereign debt burden now hovers near $280 billion, a millstone that chokes public spending and frightens foreign capital. Policymakers are trapped in a Sisyphean cycle: secure a desperate International Monetary Fund tranche, briefly stabilize foreign exchange reserves, avoid immediate default, and repeat.
Yet the underlying rot remains untouched. Figuring out how to fix Pakistan’s debt economy requires more than frantic diplomacy in Washington or rolling over bilateral loans from Beijing and Riyadh. It demands a violent break from decades of elite capture and fiscal cowardice.
The scale of the sovereign distress is historical. Throughout late 2023 and into 2024, inflation tore through the middle class at a staggering 30 percent, eroding purchasing power and stalling industrial output. According to the World Bank’s economic update, nearly 40 percent of the population now lives below the poverty line, pushing an additional 12.5 million people into economic despair over just three years.
This isn’t merely a liquidity crisis; it is a profound structural failure. The tax net captures only a fraction of the elite, leaving the agrarian and retail sectors largely untaxed while salaried citizens bear the brunt. Simultaneously, the state bleeds capital subsidizing inefficient state-owned enterprises. The International Monetary Fund notes that the country’s tax-to-GDP ratio stubbornly sits around 10 percent, drastically below the regional average necessary to fund a functioning state. Without a violent restructuring of domestic revenue streams and spending habits, external lifelines only delay the inevitable reckoning.
The Core Development: Pluggng the Fiscal Hemorrhage
So, where does the state begin dismantling the mechanisms that have institutionalized this insolvency? The immediate prescription centers on the energy sector’s paralyzing “circular debt.” This is the cascading shortfall of payments across the power supply chain, a figure that recently breached Rs 2.3 trillion ($8.2 billion). Generation companies can’t pay fuel suppliers because distribution companies fail to collect bills or prevent catastrophic line losses.
Fixing this requires politically toxic decisions. Tariffs must reflect the actual cost of generation, but simply hiking prices on a distressed populace is unsustainable. The state must privatize distribution networks. Selling these loss-making entities to private operators with strict regulatory oversight would instantly plug a massive fiscal bleed. Reuters reporting indicates that energy sector subsidies consume nearly a quarter of federal development spending. Cut the subsidy, and the state frees up capital for debt servicing and targeted cash transfers to the genuinely vulnerable.
Then comes the revenue side. The Federal Board of Revenue operates with antiquated technology and an institutional culture that rewards negotiation over enforcement. A complete digitization of the tax machinery is non-negotiable. By linking national identity cards, bank accounts, and property records, the state can map the undeclared wealth of the country’s real estate barons.
There is a human cost to this evasion. In Karachi, former finance minister Miftah Ismail frequently points out that the ruling elite orchestrates tax amnesties that legalize illicit wealth while the urban poor pay heavy indirect taxes on basic food staples. Reversing this means imposing heavy capital gains taxes on unproductive real estate plots and bringing agricultural income into the federal tax net—a move historically blocked by the feudal politicians who dominate the parliament. It will take an executive branch willing to risk its own survival to pass these measures.
The Asian Development Bank estimates that broadening this tax base could yield an additional three percent of GDP in revenue within two fiscal cycles. That margin alone is the difference between chronic begging and financial sovereignty. Still, structural reform is a marathon that Pakistan has historically abandoned after the first mile.
The Reality of IMF Bailout Pakistan Mandates
The global financial architecture views Islamabad with deep exhaustion. Since 1958, Pakistan has entered 23 separate arrangements with the IMF. Almost none were completed without waivers or outright suspensions.
What are the structural reforms needed in Pakistan? The core reforms require dismantling state-owned monopolies, ending untargeted subsidies, taxing agricultural and real estate wealth, and fully privatizing power distribution companies. These steps permanently reduce the fiscal deficit and end the reliance on external debt to fund government operations.
That simple arithmetic conceals a brutal political reality. The state is structurally designed to protect the very sectors it needs to tax. Consider the domestic debt profile. The government borrows heavily from local commercial banks at exorbitant policy rates—often exceeding 20 percent—to fund its deficits. This crowds out the private sector. When commercial banks can generate risk-free, double-digit returns simply by buying government paper, they’ve zero incentive to lend to small and medium enterprises. Industrial growth suffocates.
To break this, the State Bank of Pakistan must enforce a strict separation between fiscal mismanagement and monetary policy. The central bank’s hard-won autonomy is frequently under attack by politicians seeking cheap credit ahead of election cycles. Defending this autonomy is critical to taming inflation.
What follows, however, is the challenge of external debt restructuring. Bilateral debt, particularly the billions owed to Chinese state-affiliated banks for infrastructure projects, must be reprofiled. Extending the maturity of these loans reduces the immediate dollar-drain on the central bank’s reserves. The Financial Times notes that Chinese independent power producers are guaranteed capacity payments in dollars, a contractual trap that drains forex reserves even when the power isn’t used. Renegotiating these contracts isn’t just an economic necessity; it is a matter of sovereign survival. Only by securing breathing room on the external front can the state implement the painful domestic reforms without triggering a total currency collapse.
Downstream Consequences and Sovereign Repositioning
The downstream consequences of this economic overhaul will reshape the country’s social contract. If the government actually executes this fiscal tightening, the immediate future looks bleak for the urban middle class. A reduction in subsidies and an aggressive widening of the tax net will crush disposable income in the short term. Consumer spending will contract. Retail, automotive, and fast-moving consumer goods sectors will report steep earnings drops.
Yet, this pain is the price of admission to a functioning economy. As the fiscal deficit shrinks, inflation will organically cool. A stable currency, no longer propped up by borrowed dollars or administrative controls, will allow the central bank to gradually lower interest rates. This is the inflection point where the private sector can breathe again.
A stabilized macroeconomic baseline unlocks export potential. Pakistan’s IT sector has demonstrated resilience despite the chaotic regulatory environment. Freelancers and software houses export nearly $3 billion annually, but billions more remain parked in offshore accounts due to a lack of trust in the State Bank’s repatriation policies. Restoring confidence could double these inflows within 24 months.
Regionally, a financially stable Pakistan alters the geopolitical calculus in South Asia. A country not perpetually on the brink of default is a more reliable partner for foreign direct investment, particularly from Gulf Cooperation Council nations. Saudi Arabia and the UAE have shifted their foreign policy. They no longer offer blank cheques; they demand equity stakes in profitable assets. As the Economist Intelligence Unit reports, Gulf sovereign wealth funds are eyeing Pakistani mining, agriculture, and logistics sectors, but these investments hinge entirely on the enforcement of a stable macroeconomic framework.
This transition from geo-strategic rent-seeking to genuine economic partnership is the ultimate prize. If Islamabad can prove it isn’t a bottomless pit for multilateral loans, it can attract the kind of patient, long-term capital that builds manufacturing bases and funds high-tech infrastructure. But capital is cowardly. It flees at the first sign of policy reversal. The state must prove its commitment through successive budget cycles, not just during the panicked weeks before an IMF board meeting.
The Case Against Austerity
There is a credible, deeply researched counterargument that aggressive fiscal consolidation is the wrong medicine for a patient already in cardiac arrest. Proponents of heterodox economics argue that austerity merely shrinks the GDP, making the debt-to-GDP ratio mathematically worse.
In this view, the insistence on primary surpluses and massive subsidy cuts disproportionately harms the industrial base. By making energy too expensive and credit too costly, the state kills the very manufacturing sector needed to generate export dollars. Economist Atif Mian frequently highlights the dangers of austerity without growth. If the state cuts development expenditure to zero to pay bondholders, the infrastructure crumbles, and future productivity is crippled.
A briefing by the Center for Economic and Policy Research argues that rigid multilateral conditionalities historically lead to stagflation in developing nations. They contend the focus should be on debt forgiveness and aggressive industrial policy rather than mere accounting balances. You cannot tax a shrinking economy into prosperity.
This perspective holds intellectual weight. Punishing the working class for the fiscal sins of the elite is a recipe for social unrest. Still, the heterodox approach requires a level of state capacity and incorruptible bureaucracy that Pakistan currently lacks. Industrial policy only works when the state can pick winners based on merit, not political patronage. Until the governance deficit is bridged, the harsh discipline of the global market remains the only effective constraint on elite excess. Opting out of the global financial system to pursue localized economic experiments is a luxury the country simply can’t afford.
The Bill Comes Due
The autopsy of Pakistan’s financial decay reveals a state that has consistently prioritized short-term political survival over long-term national viability. The solutions aren’t shrouded in mystery; they are merely buried under decades of vested interests. Tax the untaxed. Privatize the bleeding state monopolies. Restructure the external debt. Empower the central bank.
Execution is a matter of political will, a commodity far scarcer in Islamabad than foreign exchange reserves. The elite must realize that the current trajectory ends in a sovereign default that will vaporize their own wealth just as surely as it starves the poor. The window for managed reform is closing rapidly, replaced by the looming threat of chaotic, forced restructuring.
A nation cannot borrow its way out of a debt crisis, nor can it negotiate with mathematics.
Discover more from The Economy
Subscribe to get the latest posts sent to your email.

SpaceX IPO 2026: $2 Trillion Valuation, Retail Frenzy, and the Risks

Oracle AI Debt Crisis 2026: $130 Billion Gamble Triggers Worst Stock Crash Since Dot-Com Bust

Male Labor Force Participation Rate 2026: Why Men Are Leaving & Economic Impact

Trump Tariffs 2026: Economic Impact, Household Costs & Trade War Outlook

China Economy 2026: Export Boom Masks Property Crisis & Investment Slump

US Inflation 4% May 2026: Is the Worst Over? Fed, Oil Prices

AI Memory Chip Shortage 2026: Nvidia, Apple & What Comes Next

US $39 Trillion National Debt 2026: Bond Market Warning Signs Explained

Ray Dalio US Suez Moment 2026: Dollar Decline, $39 Trillion Debt & Empire’s End

Kevin Warsh Fed Rate Hike 2026: What His Hawkish Pivot Means for Markets

Gold Price 2026: Will Gold Hit $6,000? JPMorgan Forecast, Drivers & Investment Guide

US Recession 2026: Four Key Threats, Warning Signs & How to Protect Your Portfolio

AI Energy Demand 2026: Data Centres, Power Grids & the $725B Infrastructure Boom

AI Semiconductor Selloff 2026: Micron Crash, Nasdaq Pullback & What Comes Next

KPMG Australia CEO Resigns After Whistleblower Claims Exposed Investigation Failures

PwC China Partner Payouts Cut Amid Evergrande Audit Fraud

Broadcom Market Value Loss: Revenue Forecast Disappoints

Investors Pile Into Bullish Dollar Bets as ‘US Exceptionalism’ Trade Returns

Here’s How Much It’ll Cost You to Be Part of SpaceX’s Record-Breaking $75 Billion IPO

Nasdaq Tumbles 4% as Chip and Memory Stocks Sink: A $1.2 Trillion Wipeout

How to Fix Pakistan’s Debt Economy: A Structural Blueprint

Smash Capital Leads $200M Funding for Allen Control Systems

Democrats Draw a Red Line Around Military AI — And the Pentagon Is Already Pushing Back

New Investment Super-Cycle: AI, Green Energy & Re-Shoring

Xponential Fitness Franchise Lawsuit: The $3.97M Judgment

Middle East Conflict Oil Prices: The $4 Surge Explained

Grinding the Already Ground: Pakistan’s Inflation Crisis

The End of the Chatbot: Why OpenAI is Tearing Up Its Most Successful Product
-

 Markets & Finance6 months ago
Top 15 Stocks for Investment in 2026 in PSX: Your Complete Guide to Pakistan’s Best Investment Opportunities
-

 Analysis4 months ago
Top 10 Stocks for Investment in PSX for Quick Returns in 2026
-

 Analysis5 months ago
Brazil’s Rare Earth Race: US, EU, and China Compete for Critical Minerals as Tensions Rise
-

 Analysis4 months ago
Johor’s Investment Boom: The Hidden Costs Behind Malaysia’s Most Ambitious Economic Surge
-

 Banks5 months ago
Best Investments in Pakistan 2026: Top 10 Low-Price Shares and Long-Term Picks for the PSX
-

 Investment6 months ago
Top 10 Mutual Fund Managers in Pakistan for Investment in 2026: A Comprehensive Guide for Optimal Returns
-

 Global Economy6 months ago
15 Most Lucrative Sectors for Investment in Pakistan: A 2025 Data-Driven Analysis
-

 Global Economy6 months ago
Pakistan’s Export Goldmine: 10 Game-Changing Markets Where Pakistani Businesses Are Winning Big in 2025