
Food
Extended Producer Responsibility Changes and the UK Hospitality Sector

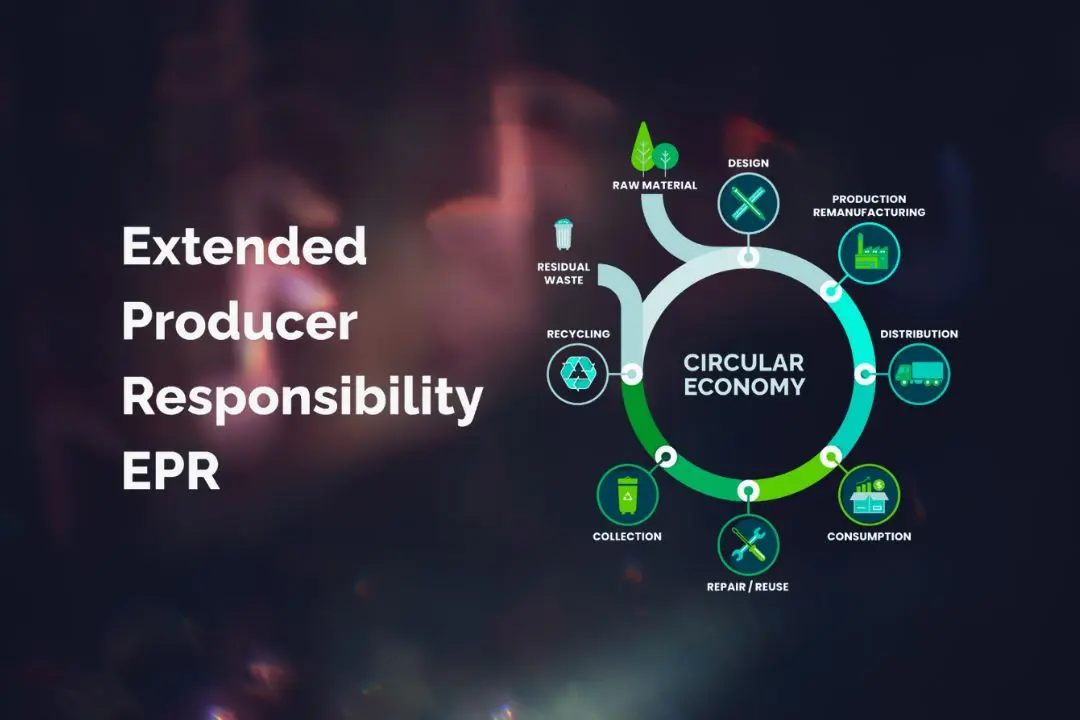
The UK government’s decision to exempt glass drinks containers supplied directly to pubs, restaurants, and other licensed venues from most Extended Producer Responsibility (EPR) fees from April 2027 directly addresses cost pressures on the hospitality sector. Official illustrations show potential savings of up to 6 pence per beer bottle and 10 pence per wine bottle, equating to as much as £870 a year for a typical pub. GOV.UK
Broader reforms will also modulate future fees so that easy-to-recycle materials such as glass and paper attract lower charges, while harder-to-recycle plastics face relatively higher costs. The changes respond to sustained industry and media pressure over double charging.
Table of Contents
- What EPR Changes Affect Hospitality?
- How Large Is the Financial Impact on Pubs?
- Why Was the Original EPR Scheme Problematic for Pubs?
- What Broader Fee Modulation Reforms Are Planned?
- How Have Industry Groups and Media Responded?
- When Will Pubs Actually See the Savings?
- Key Takeaways
- Frequently Asked Questions
What EPR Changes Affect Hospitality?
From April 2027, glass drinks containers supplied directly by producers to licensed hospitality venues (pubs, restaurants, and similar premises) will no longer be liable for the majority of Extended Producer Responsibility packaging fees. The exemption is intended to eliminate the situation in which businesses paid both commercial waste-collection charges and EPR fees on the same glass. GOV.UK
Environment Secretary Dame Angela Eagle stated that the government had listened to concerns from the hospitality sector and the British glass industry and was acting to reduce fees on the most recyclable packaging while tackling double charging.
How Large Is the Financial Impact on Pubs?
Government examples indicate savings of up to 6 pence per beer bottle and 10 pence per wine bottle. For a pub selling 10,000 beer bottles and 3,700 wine bottles annually, the combined relief could reach £870 per year. These figures are illustrative upper-end amounts; actual savings will depend on volumes and the degree to which producers and wholesalers pass the reduced fees through the supply chain. The Grocer
Defra has also indicated that wider modulation could reduce fees for the most recyclable packaging by up to 40 percent.
Why Was the Original EPR Scheme Problematic for Pubs?
Hospitality venues already contract and pay for the collection and recycling of their commercial glass waste. The introduction of EPR fees created a second charge on the same material without delivering an additional service to the venue. This double charging raised operating costs for pubs at a time when the sector was already managing elevated energy, wage, and supply costs, and it disadvantaged UK glass producers relative to some imported alternatives. The Times
What Broader Fee Modulation Reforms Are Planned?
Alongside the hospitality exemption, the government will consult on restructuring packaging fees so that easy-to-recycle materials (including most glass and paper) attract lower charges while hard-to-recycle formats, particularly certain plastics, face higher fees. Defra estimates this approach could lower fees for highly recyclable packaging by 30–40 percent. A separate call for evidence on reusable packaging systems is also planned for 2027. GOV.UK
How Have Industry Groups and Media Responded?
The British Beer and Pub Association welcomed the removal of double charging on glass. Glass-industry representatives similarly supported measures that reduce the cost burden on a highly recyclable domestic product. Campaigns by outlets including The Telegraph and The Mirror had highlighted the impact on pubs and glassmakers in the months preceding the announcement. Some publican groups have sought explicit confirmation that tenanted and leased pubs will benefit on the same terms as managed estates. The Mirror
When Will Pubs Actually See the Savings?
The exemption applies to EPR fees calculated from April 2027. Invoices and supply contracts in place before that date are unaffected. Any reduction in the price of bottled beer or wine at the bar will occur only if producers and distributors pass the lower fees downstream; the government announcement itself does not mandate retail price cuts.
Illustrative Annual Saving for a Typical Pub
| Product | Assumed Annual Volume | Maximum Unit Saving | Maximum Annual Saving |
|---|---|---|---|
| Beer bottles | 10,000 | 6 pence | £600 |
| Wine bottles | 3,700 | 10 pence | £370 |
| Combined | — | — | Up to £870 |
Key Takeaways
- Glass drinks containers supplied directly to licensed hospitality venues will be largely exempt from EPR fees from April 2027.
- Official examples show potential savings of up to £870 per year for a mid-volume pub.
- The change directly addresses the double-charging criticism that had been levelled at the original scheme.
- Wider fee modulation is expected to further favour glass and paper over many plastic formats.
- The measures support both the hospitality sector and UK glass manufacturers.
- Consumer price effects depend on how much the supply chain passes through costs.
Frequently Asked Questions
When does the hospitality glass exemption take effect?
April 2027.
Does the exemption cover every type of glass packaging?
It applies to glass drinks containers supplied directly by producers to licensed pubs, restaurants, and other hospitality venues.
Will the price of a pint or a bottle of wine fall immediately?
Not automatically. Any retail price reduction depends on whether suppliers pass the fee savings through.
Is this change linked to recent newspaper campaigns?
Yes. Both The Telegraph and The Mirror had run prominent coverage of the cost impact on pubs and the glass industry.
Will plastic packaging become more expensive under the wider reforms?
Fee modulation is designed to increase charges on harder-to-recycle materials relative to glass and paper.
Are tenanted and leased pubs included?
The announcement covers licensed hospitality venues; industry bodies are seeking clear confirmation that tenanted estates receive equivalent benefit.
Conclusion
The EPR adjustments announced in November 2026 constitute a targeted and practical correction for the UK hospitality sector. By removing most packaging fees on glass supplied directly to pubs and restaurants from April 2027, and signalling stronger future rewards for recyclability, the government has responded to a clearly identified cost pressure. For business, hospitality, and consumer audiences, the changes should deliver measurable relief to licensed venues while reinforcing the principle that packaging charges ought to reflect real-world recycling outcomes. The extent to which those savings reach the customer will be determined by commercial decisions further down the supply chain in 2027 and beyond.
Discover more from The Economy
Subscribe to get the latest posts sent to your email.



In brief: Food-importing economies with substantial dollar liabilities can face a double squeeze: foreign-currency debt service rises in local-currency terms when their currency weakens, while imported grain and fuel also become costlier. Fiscal choices can become harder just when food support is most needed. This guide draws on World Bank October 2026 commodity outlook and identifies where an individual case needs additional checks.
Published commodity indexes describe wholesale market movements; exchange rates, transport and the contents of a national food basket determine how households feel those movements.
Information relevant to how dollar debt affects food import costs can be misread when a national guideline, an industry average and a reader’s particular situation are presented as though they are identical. The starting point is the dated evidence. The FAO Food Price Index, November 2026 release provides wider context, while the specific details below explain the limits of a simple answer.
Debt repayments and trade invoices compete for scarce foreign exchange. Where reserve buffers are thin, financing costs may rise, and importers may struggle to secure letters of credit. This is a macro-financial channel, not proof that all food importers are denied foreign currency.
This creates a useful distinction between a headline measure and the outcome that matters. The former can be quoted publicly; the latter may depend on timing, eligibility, contract terms, geography or equipment. A careful analysis names each moving part instead of pretending the same rule produces an identical result for everyone.
A government that must pay $1 billion of interest will need more domestic currency after a depreciation if its payment obligation is fixed in dollars. Separately, mills importing wheat will convert their own dollar invoices at the weaker rate. Those two exposures affect different budgets but can reinforce pressure on households.
The example isolates a particular assumption rather than claiming to reproduce every real-world case. Change the date, price, document category or other relevant input and the conclusion may change. Readers should use the calculation or scenario as a transparent method for asking better questions, not as a substitute for primary records.
What to check in practice
Separate public external debt from private importer borrowing, and check reserves, maturity schedules and invoice currencies. A headline debt-to-GDP number does not reveal near-term dollar cash needs. Pair your analysis with institutional data and local import licensing rules.
| Evidence | Where to look | What it establishes |
|---|---|---|
| Governing principle | World Bank October 2026 commodity outlook | The baseline rule or measured relationship |
| Broader context | FAO Food Price Index, November 2026 release | The date and wider background |
| Your individual position | Domestic prices, contracts and country-level official statistics | Whether the general explanation applies in practice |
A source can be authoritative and still be too broad to settle an individual case. When multiple documents or measurements disagree, check whether they refer to different periods, populations, definitions or activities before deciding that one must be wrong.
Where a simple answer becomes misleading
An economy can borrow internationally while sustaining affordable food if revenue, reserves and policy frameworks are strong. Avoid presenting every currency fall as a debt crisis, or treating a forecast currency rate as an observed transaction rate.
These qualifications are not minor technicalities. They are often the difference between a useful guide and a confident headline that sends the reader in the wrong direction. The safest recommendation is to describe the relevant condition precisely and then give readers a way to verify it themselves.
What the available evidence does and does not establish
World Bank commodity analysis explains the trade shock; the country’s sovereign filings and balance-of-payments releases are needed to quantify the debt component. The final judgement must be specific to each economy.
The FAO Food Price Index methodology helps corroborate the wider subject, but it cannot authenticate a reader’s private documents, bills, contractual obligations or travel plan. Where the article includes an illustrative calculation, the assumptions are labelled. Where it concerns a live rule or future schedule, the controlling institution should be consulted again immediately before use.
For an independent news report on the October 2026 commodity outlook, see Reuters: World Bank October 2026 commodity outlook. This news account adds context; it is not a substitute for the directly applicable institutional source.
A short verification checklist
- Start with the specific evidence: Separate public external debt from private importer borrowing, and check reserves, maturity schedules and invoice currencies.
- Challenge the default assumption: An economy can borrow internationally while sustaining affordable food if revenue, reserves and policy frameworks are strong.
- Check the scope of the published material: World Bank commodity analysis explains the trade shock; the country’s sovereign filings and balance-of-payments releases are needed to quantify the debt component.
- Confirm the current version: Revisit the World Bank October 2026 commodity outlook and the original dated guidance before making an irreversible decision.
Frequently asked questions
What is the key principle?
Food-importing economies with substantial dollar liabilities can face a double squeeze: foreign-currency debt service rises in local-currency terms when their currency weakens, while imported grain and fuel also become costlier. The relevant primary reference is World Bank October 2026 commodity outlook.
What would change the answer?
An economy can borrow internationally while sustaining affordable food if revenue, reserves and policy frameworks are strong. Avoid presenting every currency fall as a debt crisis, or treating a forecast currency rate as an observed transaction rate.
What should I verify before relying on this?
Separate public external debt from private importer borrowing, and check reserves, maturity schedules and invoice currencies. A headline debt-to-GDP number does not reveal near-term dollar cash needs. Pair your analysis with institutional data and local import licensing rules.
The bottom line
Food-importing economies with substantial dollar liabilities can face a double squeeze: foreign-currency debt service rises in local-currency terms when their currency weakens, while imported grain and fuel also become costlier. World Bank commodity analysis explains the trade shock; the country’s sovereign filings and balance-of-payments releases are needed to quantify the debt component.
Discover more from The Economy
Subscribe to get the latest posts sent to your email.
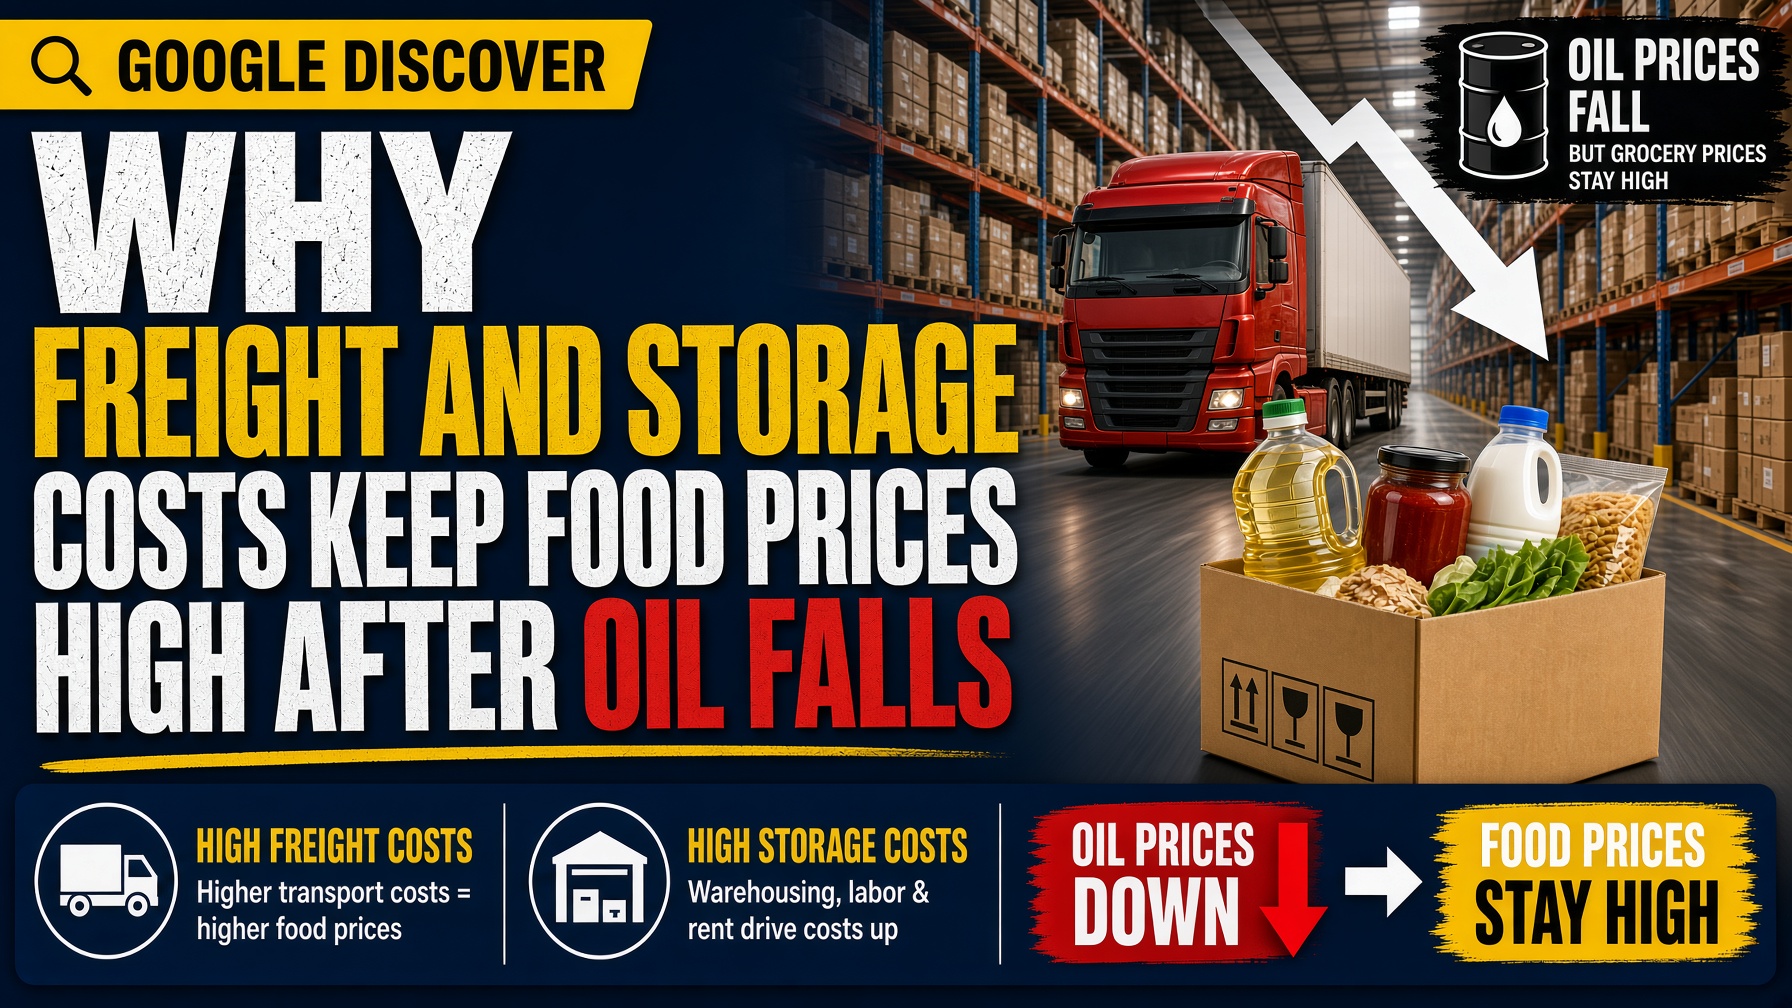
In brief: A retreat in crude prices does not instantly reset the cost of transporting and storing food. Freight contracts, insurance, refrigeration electricity and labour can remain elevated; rerouted shipments may create a lasting surcharge even after the original fuel shock fades. This guide draws on World Bank October 2026 commodity outlook and identifies where an individual case needs additional checks.
Published commodity indexes describe wholesale market movements; exchange rates, transport and the contents of a national food basket determine how households feel those movements.
Information relevant to why freight costs keep grocery prices high can be misread when a national guideline, an industry average and a reader’s particular situation are presented as though they are identical. The starting point is the dated evidence. The FAO Food Price Index, November 2026 release provides wider context, while the specific details below explain the limits of a simple answer.
How it works
Food distribution has a sequence: farms or ports, storage, wholesalers, processors, trucks and shops. Different players renegotiate prices at different times. A refrigerated container relies on power and specialised capacity in addition to marine fuel, while inland delivery may be affected by tolls, road disruptions and fuel taxes.
This creates a useful distinction between a headline measure and the outcome that matters. The former can be quoted publicly; the latter may depend on timing, eligibility, contract terms, geography or equipment. A careful analysis names each moving part instead of pretending the same rule produces an identical result for everyone.
A distributor buys three months of freight capacity at a fixed rate just before shipping costs fall. The company’s contractual bill remains unchanged until renewal. Meanwhile, another importer using spot freight might benefit quickly. Both sell in the same city, producing different timing in store prices.
The example isolates a particular assumption rather than claiming to reproduce every real-world case. Change the date, price, document category or other relevant input and the conclusion may change. Readers should use the calculation or scenario as a transparent method for asking better questions, not as a substitute for primary records.
What to check in practice
Ask whether the observed cost is a spot shipping quote, a signed contract or an insured landed-cost figure. Record warehousing losses and cold-chain requirements. Explain why perishable goods and shelf-stable grains respond differently to a logistics disruption.
| Evidence | Where to look | What it establishes |
|---|---|---|
| Governing principle | World Bank October 2026 commodity outlook | The baseline rule or measured relationship |
| Broader context | FAO Food Price Index, November 2026 release | The date and wider background |
| Your individual position | Domestic prices, contracts and country-level official statistics | Whether the general explanation applies in practice |
A source can be authoritative and still be too broad to settle an individual case. When multiple documents or measurements disagree, check whether they refer to different periods, populations, definitions or activities before deciding that one must be wrong.
Where a simple answer becomes misleading
It would be wrong to attribute every expensive grocery basket to shipping. Retail market structure and local harvest supply matter too, and a fall in freight costs does not guarantee companies will pass the entire saving to shoppers.
These qualifications are not minor technicalities. They are often the difference between a useful guide and a confident headline that sends the reader in the wrong direction. The safest recommendation is to describe the relevant condition precisely and then give readers a way to verify it themselves.
What the available evidence does and does not establish
Commodity forecasts and FAO food price data are useful context, but a properly sourced freight investigation also needs route-specific rates and importer invoices. Until those figures are available, discuss the mechanism rather than claim exact pass-through.
The FAO Food Price Index methodology helps corroborate the wider subject, but it cannot authenticate a reader’s private documents, bills, contractual obligations or travel plan. Where the article includes an illustrative calculation, the assumptions are labelled. Where it concerns a live rule or future schedule, the controlling institution should be consulted again immediately before use.
For an independent news report on the October 2026 commodity outlook, see Reuters: World Bank October 2026 commodity outlook. This news account adds context; it is not a substitute for the directly applicable institutional source.
A short verification checklist
- Start with the specific evidence: Ask whether the observed cost is a spot shipping quote, a signed contract or an insured landed-cost figure.
- Challenge the default assumption: It would be wrong to attribute every expensive grocery basket to shipping.
- Check the scope of the published material: Commodity forecasts and FAO food price data are useful context, but a properly sourced freight investigation also needs route-specific rates and importer invoices.
- Confirm the current version: Revisit the World Bank October 2026 commodity outlook and the original dated guidance before making an irreversible decision.
Frequently asked questions
What is the key principle?
A retreat in crude prices does not instantly reset the cost of transporting and storing food. The relevant primary reference is World Bank October 2026 commodity outlook.
What would change the answer?
It would be wrong to attribute every expensive grocery basket to shipping. Retail market structure and local harvest supply matter too, and a fall in freight costs does not guarantee companies will pass the entire saving to shoppers.
What should I verify before relying on this?
Ask whether the observed cost is a spot shipping quote, a signed contract or an insured landed-cost figure. Record warehousing losses and cold-chain requirements. Explain why perishable goods and shelf-stable grains respond differently to a logistics disruption.
A retreat in crude prices does not instantly reset the cost of transporting and storing food. Commodity forecasts and FAO food price data are useful context, but a properly sourced freight investigation also needs route-specific rates and importer invoices.
Discover more from The Economy
Subscribe to get the latest posts sent to your email.
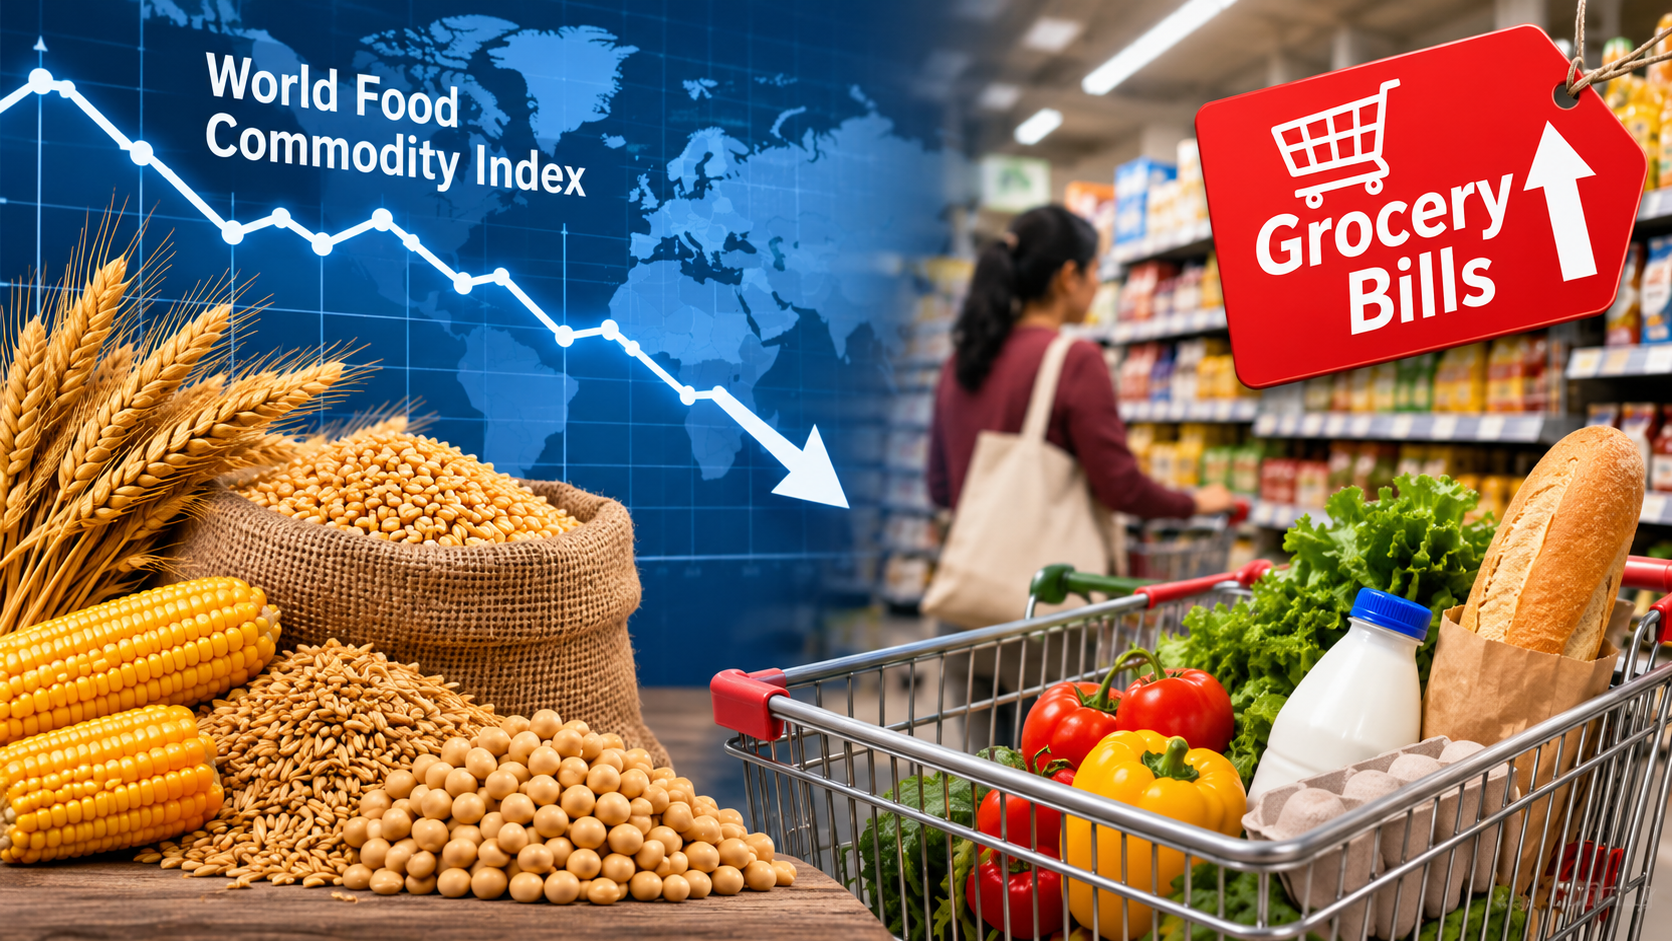
The FAO Food Price Index tracks international commodity quotations, not the total cost of the weekly supermarket basket. Shoppers can continue paying more because of earlier price increases, exchange-rate moves, local transport costs and slow changes in retail contracts. This guide draws on World Bank October 2026 commodity outlook and identifies where an individual case needs additional checks.
Published commodity indexes describe wholesale market movements; exchange rates, transport and the contents of a national food basket determine how households feel those movements.
Information relevant to world food commodity index versus supermarket prices can be misread when a national guideline, an industry average and a reader’s particular situation are presented as though they are identical. The starting point is the dated evidence. The FAO Food Price Index, November 2026 release provides wider context, while the specific details below explain the limits of a simple answer.
A global index is an average across selected traded commodity groups. A retail food index measures actual consumer purchases including local production, processing, packaging and distribution. Their baskets, currencies, weights and dates differ, so direct month-to-month comparisons can be misleading.
This creates a useful distinction between a headline measure and the outcome that matters. The former can be quoted publicly; the latter may depend on timing, eligibility, contract terms, geography or equipment. A careful analysis names each moving part instead of pretending the same rule produces an identical result for everyone.
If world wheat quotations decline by 5%, a packaged bakery item will not necessarily become 5% cheaper: flour is only one input, and the shop may still be using higher-cost inventory. A decline in a price level also differs from a slower rate of increase.
The example isolates a particular assumption rather than claiming to reproduce every real-world case. Change the date, price, document category or other relevant input and the conclusion may change. Readers should use the calculation or scenario as a transparent method for asking better questions, not as a substitute for primary records.
Compare the FAO measure with the country’s food CPI and wholesale prices on a shared timeline. Add exchange rates and seasonal harvest information. Label which figures refer to levels, percentage changes and annual inflation, so readers do not confuse a declining index with falling store prices.
| Evidence | Where to look | What it establishes |
|---|---|---|
| Governing principle | World Bank October 2026 commodity outlook | The baseline rule or measured relationship |
| Broader context | FAO Food Price Index, November 2026 release | The date and wider background |
| Your individual position | Domestic prices, contracts and country-level official statistics | Whether the general explanation applies in practice |
A source can be authoritative and still be too broad to settle an individual case. When multiple documents or measurements disagree, check whether they refer to different periods, populations, definitions or activities before deciding that one must be wrong.
Where a simple answer becomes misleading
Beware the claim that a lower FAO reading proves governments or retailers are hiding an immediate saving. In reality, product composition, taxes, production costs and inventory turnover can explain some of the difference; any accusation needs separate evidence.
These qualifications are not minor technicalities. They are often the difference between a useful guide and a confident headline that sends the reader in the wrong direction. The safest recommendation is to describe the relevant condition precisely and then give readers a way to verify it themselves.
What the available evidence does and does not establish
The FAO’s 6 November 2026 release reports a 1.2% monthly fall in its international food index, but that is not the same as a 1.2% retail price cut everywhere. A useful article must display the different measurements side by side.
The FAO Food Price Index methodology helps corroborate the wider subject, but it cannot authenticate a reader’s private documents, bills, contractual obligations or travel plan. Where the article includes an illustrative calculation, the assumptions are labelled. Where it concerns a live rule or future schedule, the controlling institution should be consulted again immediately before use.
For an independent news report on the October 2026 commodity outlook, see Reuters: World Bank October 2026 commodity outlook. This news account adds context; it is not a substitute for the directly applicable institutional source.
A short verification checklist
- Start with the specific evidence: Compare the FAO measure with the country’s food CPI and wholesale prices on a shared timeline.
- Challenge the default assumption: Beware the claim that a lower FAO reading proves governments or retailers are hiding an immediate saving.
- Check the scope of the published material: The FAO’s 6 November 2026 release reports a 1.2% monthly fall in its international food index, but that is not the same as a 1.2% retail price cut everywhere.
- Confirm the current version: Revisit the World Bank October 2026 commodity outlook and the original dated guidance before making an irreversible decision.
Frequently asked questions
What is the key principle?
The FAO Food Price Index tracks international commodity quotations, not the total cost of the weekly supermarket basket. The relevant primary reference is World Bank October 2026 commodity outlook.
What would change the answer?
Beware the claim that a lower FAO reading proves governments or retailers are hiding an immediate saving. In reality, product composition, taxes, production costs and inventory turnover can explain some of the difference; any accusation needs separate evidence.
What should I verify before relying on this?
Compare the FAO measure with the country’s food CPI and wholesale prices on a shared timeline. Add exchange rates and seasonal harvest information. Label which figures refer to levels, percentage changes and annual inflation, so readers do not confuse a declining index with falling store prices.
The FAO Food Price Index tracks international commodity quotations, not the total cost of the weekly supermarket basket. The FAO’s 6 November 2026 release reports a 1.2% monthly fall in its international food index, but that is not the same as a 1.2% retail price cut everywhere.
Discover more from The Economy
Subscribe to get the latest posts sent to your email.

Nvidia Stops Reporting Singapore Revenue After It Hit 22% of Sales: What Investors Need to Know

Global Trade and Tariffs 2026:WTO Barometer Still Shows Growth

Extended Producer Responsibility Changes and the UK Hospitality Sector

GDP and Economic Growth in the US: How It’s Measured, Current Trends

Economic Globalization: How Global Trade Shapes the US Economy, Jobs, and Consumers

Best Life Insurance Companies in the United States 2026: Our Top 5 Picks

Pakistan Auto Policy 2026-31 Explained: EV Tax Cuts, $6 Billion Export Target

When Dollar Debt and Food Imports Collide: The Currency Squeeze

Why Freight and Storage Costs Keep Food Prices High After Oil Falls

Personal Injury Lawyer Near Me in NYC: How to Find the Right Attorney After an Accident

Why Falling World Food Prices Do Not Always Lower Grocery Bills

Oil Shocks and Core Inflation: Why the Two Move Differently

Singapore Cannot Fight Financial Fraud by Making Victims Bear the Risk Alone

Singapore Banking’s Real Test: Beyond Profits, Who Will Safeguard Financial Trust?

Dow Jones Today: Dow Slips 237 Points After the Worst Day Since April 2025

US–Iran Conflict in October 2026: Hormuz, Oil Prices and Diplomacy

Pakistan IMF Programme 2026: Why Bailouts Keep Returning

SSI November 2026 Payment: Why Benefits Arrive October 30

US–China AI Export Controls in 2026: Chips, Testing Rules and Corporate Risk

2027 Federal Tax Brackets: New IRS Rates and Standard Deductions Explained

Singapore Stock Market Outlook 2027: The STI’s Bank-and-Yield Test

World Bank Debt Report 2026: The $9.4 Trillion Burden Behind the Recovery

Stock Market Crash 2026? What the November Rout Actually Tells Us

IMF Global Outlook 2027: The Recovery Is Real, but the Divide Is Growing

KSE-100 Index 2026: Is Pakistan’s Stock-Market Recovery Sustainable?

Germany–France ‘Made in Europe’ Deal Could Reshape China’s EV Ambitions

Power Grid Emergency Across 13 States? What the October 2026 PJM Order Actually Says

Global Markets Today: The AI Sell-Off Has Become a Test of Liquidity
-

 Markets & Finance10 months ago
Top 15 Stocks for Investment in 2026 in PSX: Your Complete Guide to Pakistan’s Best Investment Opportunities
-

 Analysis9 months ago
Johor’s Investment Boom: The Hidden Costs Behind Malaysia’s Most Ambitious Economic Surge
-

 Analysis9 months ago
Top 10 Stocks for Investment in PSX for Quick Returns in 2026
-

 Banks10 months ago
Best Investments in Pakistan 2026: Top 10 Low-Price Shares and Long-Term Picks for the PSX
-

 Analysis9 months ago
Brazil’s Rare Earth Race: US, EU, and China Compete for Critical Minerals as Tensions Rise
-

 Investment10 months ago
Top 10 Mutual Fund Managers in Pakistan for Investment in 2026: A Comprehensive Guide for Optimal Returns
-

 Global Economy11 months ago
15 Most Lucrative Sectors for Investment in Pakistan: A 2025 Data-Driven Analysis
-

 Global Economy11 months ago
Pakistan’s Export Goldmine: 10 Game-Changing Markets Where Pakistani Businesses Are Winning Big in 2025