
UK Economy
UK Stagflation 2026: Why the Bank of England May Hike Rates, Not Cut Them

The United Kingdom is heading into a second consecutive year of what economists at RSM UK are calling “stagflation-lite,” a combination of sluggish growth and rising inflation driven by an energy shock that traces directly back to the closure of the Strait of Hormuz. Bank of England Governor Andrew Bailey has said market pricing for two rate cuts this year looked reasonable before the Iran war lifted inflation risks, a shift in tone that now has traders debating whether the next move is a cut, a hold, or an outright hike, according to the Credit Protection Association’s business briefing.
Growth That Keeps Disappointing
The headline numbers tell a story of an economy losing momentum even before the latest shock fully lands. UK GDP grew just 0.1% at the end of 2025, revised down from an initial 0.2% estimate, and while first-quarter 2026 growth came in stronger at 0.6%, GDP then fell 0.1% in April, according to the Office for National Statistics data cited by CPA. Real household disposable income fell 0.8% in the first quarter as rising prices and higher taxes squeezed consumers, and business confidence data from the Institute of Directors showed its sentiment index falling to minus 61 in June from minus 53 in May, the lowest revenue expectations reading of the year.
RSM UK’s economic outlook frames the underlying trajectory starkly: GDP growth of just 1.0% this year, down from 1.4% in 2025, with inflation trending back toward 4%, “another dose of ‘stagflation-lite,'” the firm wrote in its assessment, per RSM UK. The firm’s base case sees inflation averaging 3.1% in 2026 and peaking around 3.5%, though it warns the risks are larger than usual given how heavily the outlook depends on developments in the Middle East.
The Energy Shock’s Direct Line to Household Bills
The mechanics of the inflation threat are unusually direct this time. A 13% rise in the energy price cap in July, combined with higher motor fuel costs and pass-through effects into food and supply chains, is expected to push inflation back toward 3.5% by year end, RSM UK’s analysis found. Oil prices, which had briefly dipped, rose to an average of over $100 a barrel within 30 days of the Iran conflict’s outbreak, though RSM UK notes the closure of the Strait of Hormuz represents the largest oil supply shock in history, and energy markets have so far reacted with relative calm, with oil now around $79 a barrel, well below the post-Ukraine invasion peaks.
That calm may not last. High global oil stocks have provided a buffer, but these are being run down at a record rate and could reach critical levels by September if the June peace deal between the US and Iran proves fragile, according to RSM UK’s forecast. KPMG UK’s separate economic outlook adds that the disruption to oil and gas supplies has already put upward pressure on energy prices, with headline inflation expected to rise from the third quarter onward as the spike gradually feeds through, per KPMG UK.
A Central Bank Caught Between Two Mandates
The Bank of England’s Monetary Policy Committee held its base rate at 3.75% through the first half of 2026, pausing a cutting cycle that had brought borrowing costs down from a 16-year high, according to NewsNow’s aggregated coverage of the situation. The next MPC decision falls on July 30, and while a base rate rise isn’t off the table, most analysts expect the committee to use the meeting to assess how durable the US-Iran peace deal proves before committing to any directional shift, according to mortgage-market analysis from Tembo Money.
The labor market complicates the calculus further. Unemployment has risen to around 5.1% to 5.2% as slower growth and higher employer National Insurance contributions weigh on hiring, even as pay growth cools from recent highs, easing the case for further rate cuts while simultaneously pressuring real household incomes, per NewsNow’s summary. KPMG UK’s modeling suggests that if the Middle East disruption proves short-lived and both oil and gas prices decline before summer’s end, inflation could still fall from a September peak toward the Bank’s 2% target by the second quarter of 2027, but that scenario now looks less certain than it did in the spring.
Politics Compounds the Uncertainty
Economic uncertainty is being amplified by domestic political developments. RSM UK’s outlook specifically flags the prospect of a change in Prime Minister as adding headwinds through higher borrowing costs and gilt yield pressure, noting that gilt yields are likely to remain elevated regardless of what the Bank of England does with the policy rate, given the UK’s particular sensitivity to inflation surprises and its unresolved political landscape. Hospitality businesses have separately renewed calls for a VAT cut, with almost a quarter of venues reportedly operating at a loss even before the latest energy price increases take effect, according to CPA’s reporting.
RSM UK’s own assessment of the year ahead captures the mood succinctly: the economy has grown at an average of just 1.2% through two turbulent years, and while early signs suggest that resilience will hold, the firm’s base case remains slower growth paired with rising inflation, not recession, but with a bigger-than-usual health warning attached to that call.
Discover more from The Economy
Subscribe to get the latest posts sent to your email.


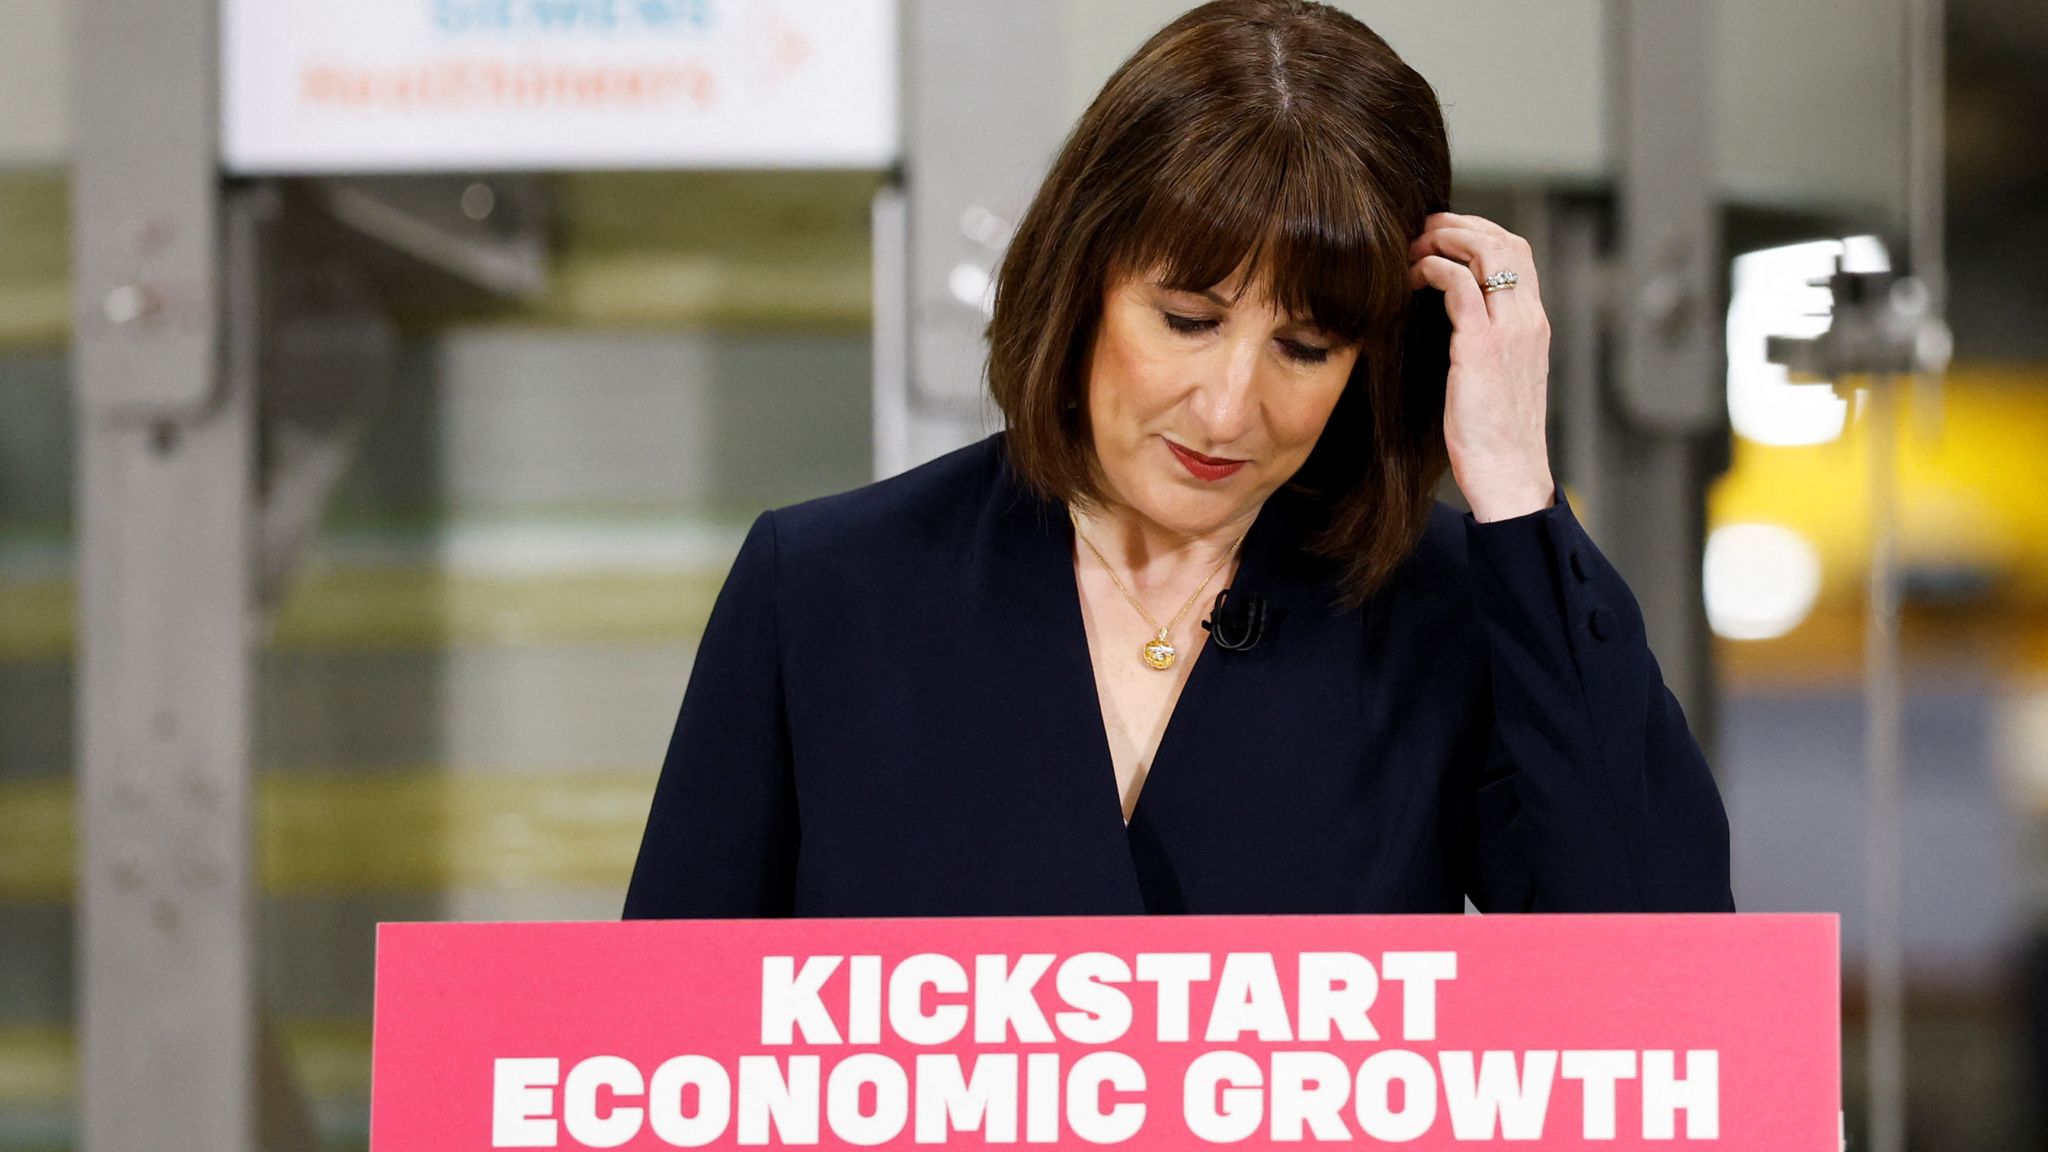
The British pound and UK markets are under pressure as reports suggest incoming Prime Minister Andy Burnham plans to demote Chancellor Rachel Reeves, while the Fed’s hawkish pivot tightens global financial conditions. Here is what Britain’s compounding crises mean for investors.
A Kingdom in Political and Economic Uncertainty
Britain entered June 25, 2026, facing a confluence of pressures that have become characteristic of the country’s post-Brexit decade: political instability at the top, persistent inflation, and a global monetary environment that is tightening at precisely the wrong moment for the UK’s already-strained public finances.
The BBC and the Financial Times reported that Andy Burnham — the sole contender to replace Keir Starmer as Prime Minister — would demote Rachel Reeves from Chancellor of the Exchequer to a more junior role should he become prime minister. The prospect of yet another change at the UK’s Treasury — the country’s fourth Chancellor in eight years — sent ripples through sterling and gilt markets.
The response was immediate and predictably fractious. Former Goldman Sachs Asset Management Chairman Jim O’Neill, a member of the House of Lords and informal advisor to Burnham, pushed back publicly on CNBC, suggesting the reports may not be “entirely accurate” and that there “shouldn’t be so much focus on who the person is.” The ambiguity itself was damaging — markets dislike uncertainty about who controls fiscal policy in the world’s sixth-largest economy.
The Bank of England’s Difficult Balancing Act
Against this political backdrop, the Bank of England faces one of its most difficult policy environments in decades. The Bank of England kept its base rate steady at 3.75% at its most recent Monetary Policy Committee meeting, acknowledging that it was “hard to predict” what will happen to prices as a result of the Iran war. Annual inflation in the UK was unchanged at 2.8% in May versus the previous month.
UK inflation at 2.8% is above the 2% target but below the 4.2% running in the United States, giving the MPC somewhat more flexibility than its American counterpart. However, the energy shock from the Hormuz crisis has driven transport inflation sharply higher, and the global backdrop — with the US Fed now signaling potential rate hikes — limits how far the Bank of England can diverge from American monetary policy without putting downward pressure on sterling.
A weaker pound raises import prices and adds to domestic inflation — the classic import inflation trap that has bedeviled UK monetary policy for much of the post-2016 period.
Fiscal Credibility: Reeves’ Legacy and Burnham’s Challenge
Rachel Reeves, love her or loathe her, represented continuity for markets. Her replacement — or even the uncertainty over her replacement — introduces a fiscal risk premium at a time when the UK’s debt burden is already elevated, public services are under strain, and the government’s fiscal rules are being tested by slow growth and high borrowing costs.
Whoever runs the Treasury in 2026 faces the same brutal arithmetic: limited room to spend, political pressure to invest in public services, and borrowing costs elevated by global monetary tightening. The question for markets is whether the incoming leadership has the credibility and the will to maintain fiscal discipline under that pressure.
Jim O’Neill’s intervention — telling markets not to fixate on the individual — suggests that those close to Burnham are aware of the optics and are attempting damage control. But in finance, perception often creates its own reality. UK gilt yields and sterling will be closely watched in the days ahead.
What Investors Should Watch
Sterling: Any confirmed report that Reeves is being demoted is likely to trigger a sterling selloff as markets reprice fiscal risk. Watch the GBP/USD rate closely.
UK Gilts: 10-year gilt yields remain the key indicator of market confidence in UK fiscal policy. A rise above 4.5% would signal genuine concern about fiscal credibility.
UK Equities: The FTSE 100’s heavy commodity exposure means it is actually partially shielded from domestic political risk — energy stocks have benefited from higher oil prices during the Iran crisis. The FTSE 250, more domestically focused, is more vulnerable to UK-specific political risk.
Bank of England Path: If the Fed hikes in 2026, the Bank of England will face pressure to follow, even if domestic conditions would otherwise argue for a hold. The global rate environment has become the binding constraint on UK monetary policy.
FAQ
Q: Who is Andy Burnham? Andy Burnham is the Mayor of Greater Manchester and, as of June 2026, the sole contender to replace Keir Starmer as Labour leader and UK Prime Minister. Known for his populist, Northern England-focused political brand, he has not yet fully articulated his economic programme.
Q: What has Rachel Reeves done as Chancellor? Reeves has focused on fiscal stability and attempted to restore market confidence in UK public finances following a period of turbulence. Her approach has been broadly orthodox — maintaining fiscal rules while trying to create space for public investment.
Q: What is the Bank of England’s current interest rate? As of June 2026, the Bank of England’s base rate stands at 3.75%, following a period of cautious easing. The next move is uncertain, with the MPC balancing persistent above-target inflation against the economic drag from the Iran war’s energy shock.
Discover more from The Economy
Subscribe to get the latest posts sent to your email.

The financial architecture linking London and Tokyo just received its most significant structural reinforcement in a generation. With the formalization of the £18 billion UK Japan investment agreement, a massive influx of East Asian capital is officially bound for British soil, targeting critical sectors from offshore wind farms to next-generation semiconductor facilities. This capital deployment isn’t a sudden twist of diplomatic fortune. It represents the culmination of multi-year bilateral negotiations designed to insulate both island nations from shifting geopolitical alliances and volatile global energy supply lines. For the British economy, long starved of transformative capital expenditure, the scale of this commitment marks a decisive shift in how whitehall secures cross-border corporate commitments.
The macroeconomic backdrop framing this arrangement is one of mutual necessity. Britain is racing against its own ambitious net-zero deadlines while grappling with a tight domestic fiscal environment that limits direct public subsidies. Japan, conversely, possesses massive institutional liquidity and corporate balance sheets eager to find yield outside an ultra-low-interest domestic arena. By matching Japanese private liquidity with British green assets, the two nations are pioneering a model of co-dependent economic security.
Recent data from the Office for National Statistics shows that foreign direct investment UK inflows have faced structural headwinds over the past five years. This capital injection acts as an economic shock absorber. This agreement solidifies a trend where sovereign economic survival relies less on sweeping multilateral treaties and more on highly targeted, sector-specific investment pipelines between trusted democratic allies.
The operational reality of the UK Japan investment agreement centers on massive infrastructure commitments led by some of Japan’s largest trading conglomerates, or sogo shosha. Chief among these is the Marubeni Corporation, which has committed approximately £10 billion over the next decade to develop offshore wind and green hydrogen projects in Scotland and Wales. Simultaneously, Sumitomo Corporation intends to deploy £4 billion into the UK’s electrical grid infrastructure, targeting subsea cabling projects that are vital for connecting remote maritime energy generation to urban industrial centers.
+-----------------------------------------------------------------+
|               £18 Billion Total Capital Allocation              |
+-----------------------------------------------------------------+
| [===================] Marubeni Corp: £10bn (Wind & Hydrogen)    |
| [========] Sumitomo Corp: £4bn (Grid Infrastructure)            |
| [====] Mitsubishi Estate & Others: £4bn (Tech & Real Estate)    |
+-----------------------------------------------------------------+
These numbers represent a significant scale of capital commitment. According to an official press release from the UK Department for Business and Trade, this coordinated deployment will directly support thousands of supply chain jobs from the Humber estuary down to the tech clusters of Bristol. On June 11, 2026, corporate executives from Tokyo finalized the project timelines during a closed-door summit at Lancaster House, ensuring that initial capital drawdowns begin before the end of the current fiscal quarter.
What makes this development distinct from previous corporate expansions is its deep integration into domestic industrial planning. The funds won’t merely acquire existing portfolios; they are explicitly earmarked for greenfield engineering developments. This includes funding for the specialized manufacturing vessels required by the offshore wind supply chain, a bottleneck that has routinely slowed down British maritime energy expansion. By anchoring these investments in physical supply chains, the agreement creates a structural relationship that cannot easily be undone by future political transitions or shifting market cycles.
What is the UK Japan investment deal?
The UK-Japan investment deal is a formal economic pact securing £18 billion in private Japanese capital for the UK economy. It prioritizes clean energy infrastructure spending, offshore wind supply chains, and semiconductor technology, strengthening bilateral trade while reducing supply chain reliance on autocratic states.
Moving beyond the immediate numbers reveals how clean energy infrastructure spending reshapes bilateral alliances in an era dominated by economic de-risking. Historically, Anglo-Japanese trade relations focused heavily on the automotive sector, defined by Nissan’s massive manufacturing footprint in Sunderland or Toyota’s operations in Derbyshire. Yet, the transition to electric vehicles and the fragmentation of global microchip logistics have forced a pivot toward structural energy security and technological independence.
       [ Tokyo Liquid Capital ] -----------> [ London Energy Assets ]
                  |                                     |
                  v                                     v
       Insulation from East Asian             Diversified Power Grid &
         Geopolitical Volatility               Supply Chain Resilience
The corporate strategy driving Marubeni and Sumitomo reflects a desire to lock in long-term regulatory yields. The UK’s Contracts for Difference (CfD) framework provides a predictable revenue model that appeals to institutional investors seeking alternatives to volatile equity markets.
Still, the strategic benefit for Tokyo is as much geopolitical as it is financial. By positioning themselves at the center of the UK’s energy transition, Japanese firms secure a foundational role in Western European critical infrastructure. This reality was highlighted in an analytical briefing by Chatham House, which noted that mid-sized democratic economies are increasingly forming exclusive technological and energy corridors to insulate themselves from supply shocks originating in East Asia.
The emphasis on microelectronics within this pact further illustrates this trend. A portion of the £18 billion is directed toward joint R&D ventures between British chip designers and Japanese materials manufacturers. As global technology supply chains splinter along ideological lines, this bilateral channel ensures both nations retain access to proprietary lithography techniques and specialized chemical inputs, independent of broader global market disruptions.
The downstream consequences of this investment will be felt most acutely across the UK’s fractured energy transport system. For years, the slow pace of grid connections has hindered the commercial viability of renewable projects, leaving finished wind arrays waiting up to a decade to feed power into the national network. The £4 billion injection from Sumitomo targeting subsea cabling and high-voltage direct current (HVDC) systems changes this dynamic entirely, accelerating the decarbonisation of the National Grid.
Current Bottleneck:
[ Wind Generation ] ---> [ 10-Year Grid Connection Delay ] ---> [ Consumers ]

With Sumitomo Capital Deployment:
[ Wind Generation ] ---> [ Fast-Tracked Subsea HVDC Cables ] ---> [ Consumers ]
This development will fundamentally alter the competitive profile of the domestic energy sector. As foreign direct investment UK flows concentrate in specialized infrastructure, domestic developers will find themselves forced to scale up or risk being sidelined by well-capitalized international consortiums. Data from the International Energy Agency suggests that countries adopting this type of concentrated external infrastructure financing see a 30% acceleration in actual project delivery times, though it often results in long-term infrastructure profits leaving the host nation.
What follows, however, is a complex labor challenge. The engineering skill sets required to deploy deep-water offshore platforms and advanced HVDC converters are in short supply globally. The influx of capital will trigger immediate wage inflation within the British engineering sector as firms compete for a finite pool of technical talent.
Educational institutions in northern England and Scotland will face immediate pressure to produce specialized technicians. The success of this £18 billion deployment ultimately hinges on whether the domestic workforce can scale alongside the incoming capital, turning financial commitments into operational infrastructure before the end of the decade.
Critics of the agreement argue that celebrating an influx of foreign capital masks a deeper structural vulnerability within the British state. Relying so heavily on external corporate actors to build and own core national infrastructure can be viewed as a failure of domestic capital mobilization. Figures published by the London School of Economics indicate that the UK continues to lag behind its G7 peers in domestic corporate investment, leaving it perpetually dependent on foreign balance sheets to achieve basic state objectives like net-zero carbon generation.
There is also the real risk of execution friction driven by Britain’s restrictive planning laws. While Tokyo has promised the capital, the UK’s planning system has historically acted as a graveyard for large-scale infrastructure ambitions. Local opposition and lengthy judicial review processes can delay offshore grid connections for years.
If Marubeni’s capital becomes trapped in bureaucratic inertia, the reputational damage could chill future post-Brexit foreign direct investment UK trends. This would turn a celebrated diplomatic victory into a cautionary tale of institutional paralysis.
The £18 billion agreement between the United Kingdom and Japan represents more than a routine commercial arrangement. It is a calculated exercise in strategic economic alignment between two nations attempting to secure their futures in an unstable global environment. By linking British natural resources with Japanese financial assets, the deal offers a viable path toward infrastructure modernization and supply chain security.
The true test, however, will not be found in the signing of agreements at Lancaster House, but in the ground-breaking ceremonies and engineering deployments across Britain’s industrial landscape.
Discover more from The Economy
Subscribe to get the latest posts sent to your email.
The $100 Trillion Question: Who Will Own the Next Era of Global Economic Power?
The numbers are no longer a forecast—they are a verdict. According to the IMF’s World Economic Outlook (April 2025), emerging and developing economies now account for approximately 59% of global GDP measured in purchasing-power-parity terms, a tectonic shift from 44% in 2000. Yet the spoils of this growth remain grotesquely uneven. A handful of nations are sprinting toward genuine economic superpower status, while dozens of others remain mired in the structural traps—commodity dependence, institutional fragility, capital flight, and the middle-income ceiling—that have historically foreclosed their ambitions.
The question facing every finance minister, central banker, and development economist today is brutally direct: which blueprint do you choose? History has proven there is no universal panacea. The Washington Consensus—that rigid cocktail of privatization, deregulation, and fiscal austerity—generated growth in some contexts and catastrophe in others. The state-led developmental model of East Asia created economic miracles but also sovereign debt crises. Green industrialization looks compelling on paper until grid reliability becomes a crisis.
What follows is a rigorous, data-driven examination of the ten most powerful economic development models available to policymakers today. Each is assessed through the lens of real-world implementation, empirical outcomes, geopolitical viability, and long-run sustainability. The conclusion, reinforced by the evidence, is unambiguous: the nations that will ascend to the apex of the global economy in the 21st century will not be those that followed a single doctrine—they will be those that mastered the art of intelligent hybridization.
| 📊 Key Insight: Nations that reached upper-middle income status fastest between 2000–2024 averaged 3.2 more institutional reforms per decade than their peers, per World Bank Governance Indicators data. |
| MODEL 01 OF 10 · CORE FRAMEWORK: INDUSTRIAL POLICY & EXPORT-LED GROWTH |
1. The East Asian Export-Industrialization Engine: Manufacturing Supremacy Through Deliberate State Choreography
Core Thesis
No development model has generated wealth faster, at greater scale, or more reproducibly than export-led industrialization. The fundamental logic is elegant: rather than producing exclusively for a small domestic market constrained by low incomes, a nation leverages its comparative advantages—abundant labour, strategic location, undervalued currency—to integrate into global value chains and capture foreign demand. The state does not merely step aside; it actively choreographs industrial champions, negotiates market access, directs credit, and manages the exchange rate with surgical precision. The emerging market economic strategy here is not laissez-faire—it is disciplined mercantilism in a globalized wrapper.
Real-World Exemplar: South Korea & Vietnam
South Korea’s trajectory from a per-capita GDP of roughly $1,200 in 1965 to over $33,000 today is one of the most studied developmental arcs in modern economics. The World Bank’s Korea Development Overview documents how successive Five-Year Plans coordinated between the state and the chaebol conglomerates—Samsung, Hyundai, LG—compressed industrial transitions that took Europe and America a century into three decades. Vietnam has since replicated this playbook in miniature: World Bank Vietnam data shows exports grew from 46% of GDP in 2000 to over 93% in 2023, propelling manufacturing-led growth averaging 6.4% annually.
The Evidence
| Dimension | Detail | Key Metric |
| Model | Export-Led Industrialization | East Asian Development State |
| Case Country | Vietnam (2000–2023) | South Korea (1965–1995) |
| GDP Growth CAGR | ~6.4% annually | ~8.1% annually |
| Poverty Reduction | 72% → 4.8% headcount | 80%+ → sub-5% headcount |
| Export / GDP Ratio | 93% (2023) | Grew from 3% to 40% |
| Key Enabler | FDI + SEZs + Education | State-directed credit + POSCO |
| Source | World Bank Open Data | IMF Working Papers |
| MODEL 02 OF 10 · CORE FRAMEWORK: LEAPFROG ECONOMICS & DIGITAL-FIRST DEVELOPMENT |
2. Leapfrog Economics: How Digital Infrastructure Lets Developing Nations Skip Entire Industrial Eras
Core Thesis
Leapfrog economics posits that developing nations are not condemned to recapitulate every stage of industrial evolution that wealthy nations traversed. A country need not build copper telephone networks if it can deploy LTE and 5G directly. It need not construct coal-fired baseline power if solar microgrids can deliver electricity to rural households at lower levelized cost. The strategic implication is transformative: rather than playing catch-up, a nation can arrive at the technological frontier first, unburdened by legacy infrastructure or incumbent lobbying. This is arguably the most exciting—and underutilized—sustainable growth model for developing nations in the current decade.
Real-World Exemplar: Rwanda & Kenya
Rwanda’s Vision 2050 explicitly deploys leapfrog theory as national strategy. The IMF Rwanda Article IV Consultation (2024) notes that ICT now contributes approximately 3.5% of GDP and growing, while mobile money penetration exceeds 40% of adults—bypassing the need for traditional bank branch networks. Kenya’s M-Pesa story is perhaps the paradigmatic leapfrog case: over 65% of Kenya’s GDP flows through the platform annually, according to GSMA Intelligence data, creating financial inclusion at a velocity no conventional banking expansion could have achieved.
| Dimension | Detail | Key Metric |
| Dimension | Detail | Key Metric |
| Model | Leapfrog / Digital-First | Mobile-led financial inclusion |
| Case Country | Kenya / Rwanda | 2010–2024 |
| GDP Impact (Digital ICT) | +3.5% of GDP (Rwanda) | McKinsey: +$300B SSA potential |
| Mobile Money Penetration | 65%+ GDP via M-Pesa (Kenya) | GSMA 2024 |
| Cost vs. Traditional Banks | 60–80% cheaper delivery | CGAP / World Bank 2023 |
| Source | IMF, McKinsey Global Institute | GSMA Intelligence |
| MODEL 03 OF 10 · CORE FRAMEWORK: NATURAL RESOURCE SOVEREIGN WEALTH CONVERSION |
3. The Resource Curse Antidote: Sovereign Wealth Fund Architecture and the Norwegian / Gulf Pivot
Core Thesis
For resource-rich developing nations, the greatest economic threat is not scarcity but abundance. The ‘resource curse’—the paradox whereby commodity wealth correlates with slower growth, weaker institutions, and greater inequality—is empirically documented across dozens of cases, from Nigeria to Venezuela. The corrective model is institutional: create a sovereign wealth fund that sequesters commodity revenues, insulates the domestic economy from Dutch Disease currency appreciation, and invests proceeds in diversified global assets that generate perpetual returns after the resource is exhausted. The BRICS economic trajectory increasingly incorporates this framework as member states seek to convert finite natural capital into enduring financial capital.
Real-World Exemplar: Norway & Botswana
Norway’s Government Pension Fund Global—managed by Norges Bank Investment Management—surpassed $1.7 trillion in assets under management in 2024, equivalent to approximately $325,000 per Norwegian citizen. The Norges Bank Investment Management Annual Report 2024 shows that the fund’s equity portfolio alone generated a 16.1% return in 2023. Botswana offers the developing-nation proof-of-concept: the Pula Fund, established in 1994, channeled diamond revenues into diversified reserves, enabling counter-cyclical fiscal policy and maintaining investment-grade credit ratings across commodity cycles—a rare achievement in Sub-Saharan Africa, per IMF Botswana Article IV 2024.
| Dimension | Detail | Key Metric |
| Dimension | Detail | Key Metric |
| Fund | Norway GPFG | Botswana Pula Fund |
| AUM (2024) | $1.7 trillion | ~$5.5 billion |
| Per-Capita Value | ~$325,000 / citizen | ~$2,200 / citizen |
| 2023 Return | 16.1% | Diversified portfolio return |
| Credit Rating Preserved? | AAA | Investment Grade |
| Source | NBIM Annual Report 2024 | IMF, Bank of Botswana |
| MODEL 04 OF 10 · CORE FRAMEWORK: SERVICES-LED GROWTH & KNOWLEDGE ECONOMY |
4. The Services Leapfrog: From Agricultural Subsistence to a Knowledge Economy Without a Manufacturing Middle
Core Thesis
India’s development trajectory has confounded classical economists who assumed manufacturing must precede services. India essentially skipped the textile-and-steel phase that defined British and American industrialization, catapulting directly into high-value software, business process outsourcing, and—most recently—global capability centres and AI engineering hubs. Services-led growth is now a credible emerging market economic strategy precisely because digital services are tradeable at scale, require relatively modest physical capital investment, and can generate high-wage employment disproportionately concentrated among educated urban populations.
Real-World Exemplar: India & the Philippines
India’s technology and services exports surpassed $290 billion in fiscal year 2023-24, according to NASSCOM Strategic Review 2024. The IMF’s India Article IV Consultation 2024 projects India as the world’s third-largest economy by 2027, propelled heavily by services sector productivity growth averaging 8.2% annually over the preceding decade. The Philippines, meanwhile, demonstrates that BPO-led services growth can generate 1.3 million high-skill jobs and $38 billion in annual remittances-equivalent service receipts.
| Dimension | Detail | Key Metric |
| Dimension | Detail | Key Metric |
| Model | Services & Knowledge Economy | India / Philippines 2000–2024 |
| Tech/Services Exports | $290B+ (India FY24) | NASSCOM 2024 |
| Services GDP Share | ~55% of India’s GDP | World Bank 2024 |
| Wage Premium | IT jobs: 4–8× median wage | ILO Labour Statistics |
| Projected GDP Rank | #3 globally by 2027 | IMF WEO April 2025 |
| Source | IMF, NASSCOM, Goldman Sachs | Global Investment Research 2024 |
| MODEL 05 OF 10 · CORE FRAMEWORK: GREEN INDUSTRIALIZATION & CLIMATE ECONOMY |
5. Green Industrialization: Turning the Climate Crisis Into the Greatest Development Opportunity of the 21st Century
Core Thesis
For nations that have not yet built their energy infrastructure, the climate crisis is not merely a threat—it is a once-in-a-century development opportunity. The economics of renewable energy have undergone a structural transformation since 2015 that is nothing short of revolutionary: the levelized cost of solar PV has declined approximately 90% over the past decade, according to the International Renewable Energy Agency (IRENA). Nations that build their industrial base on cheap, abundant renewable energy will enjoy structural competitive advantages in energy-intensive manufacturing for generations. Moreover, the emerging global carbon border adjustment mechanism—particularly the EU’s CBAM—effectively penalizes high-carbon production, creating a first-mover advantage for nations that industrialize green from the outset.
Real-World Exemplar: Morocco & Chile
Morocco’s Noor Ouarzazate complex—at 580MW one of the world’s largest concentrated solar power installations—is the cornerstone of an industrial strategy that targets 52% renewable electricity by 2030, per IRENA’s Africa Renewable Energy Outlook 2023. Morocco now exports clean electricity to Europe via sub-sea cable and is positioning itself as a green hydrogen exporter—a market the IEA Global Hydrogen Review 2024 values at potentially $200 billion annually by 2030. Chile, with the Atacama Desert’s irradiation levels producing solar electricity at under $20/MWh, has become a natural laboratory for green copper smelting—critical for the EV supply chain.
| Dimension | Detail | Key Metric |
| Dimension | Detail | Key Metric |
| Model | Green Industrialization | Morocco / Chile 2015–2030 |
| Solar Cost Decline | ~90% since 2015 | IRENA 2024 |
| Morocco Renewable Target | 52% by 2030 | Ministry of Energy Morocco |
| Green H₂ Market Value | $200B/yr by 2030 (potential) | IEA Hydrogen Review 2024 |
| Chile Solar LCOE | <$20/MWh (Atacama) | BNEF Clean Energy Index |
| EU CBAM Impact | 15–35% tariff on high-carbon goods | European Commission 2024 |
| Source | IRENA, IEA, BNEF | European Commission |
| MODEL 06 OF 10 · CORE FRAMEWORK: SPECIAL ECONOMIC ZONES & INSTITUTIONAL EXPERIMENTATION |
6. Special Economic Zones as Laboratories of Capitalism: China’s SEZ Blueprint for the Developing World
Core Thesis
One of the most powerful tools in the developmental state’s arsenal is the Special Economic Zone—a geographically bounded area where a nation effectively runs a different, more market-friendly regulatory regime than the broader domestic economy. SEZs allow governments to attract FDI, build export capacity, and test institutional reforms without requiring political consensus for nationwide liberalization. The evidence base is extensive. The World Bank’s 2024 report on SEZs globally documented over 5,400 active zones across 147 countries, generating combined exports exceeding $3.5 trillion annually.
Real-World Exemplar: China’s Shenzhen & Rwanda’s Kigali SEZ
Shenzhen’s transformation from a fishing village of 30,000 people in 1979 to a metropolitan economy of 13 million generating GDP equivalent to a mid-sized European nation within a single generation is the most dramatic example of deliberate institutional engineering in modern history. The Brookings Institution’s analysis of China’s SEZ model attributes Shenzhen’s success to the unique combination of preferential tax regimes, streamlined customs, and—critically—de facto property rights protections that did not exist in the rest of China at the time. Rwanda’s Kigali SEZ, while embryonic by comparison, has attracted 30+ international firms since 2011 and is deliberately modelled on Singapore’s Jurong Industrial Estate.
| Dimension | Detail | Key Metric |
| Dimension | Detail | Key Metric |
| Model | Special Economic Zones (SEZs) | China / Rwanda |
| Global SEZ Count | 5,400+ active zones | World Bank 2024 |
| Global SEZ Exports | $3.5 trillion annually | World Bank SEZ Report 2024 |
| Shenzhen GDP Growth | From $0.3B (1980) to $490B+ (2023) | CEIC / China NBS |
| Kigali SEZ Investment | 30+ multinationals attracted | Rwanda Development Board |
| Source | World Bank, Brookings | CEIC, Rwanda Dev. Board |
| MODEL 07 OF 10 · CORE FRAMEWORK: HUMAN CAPITAL & TALENT-LED GROWTH STRATEGY |
7. The Singapore Theorem: Why Human Capital Investment Is the Highest-Return Asset Class in Development Economics
Core Thesis
Lee Kuan Yew famously observed that Singapore’s only natural resource is its people. The meticulous, systematic cultivation of human capital—through elite technical education, continuous workforce retraining, immigration of specialized talent, and ruthless meritocracy in public sector staffing—transformed a malarial swamp into the world’s fourth-largest financial centre by assets under management. The Singapore theorem posits that in the knowledge economy, human capital is not just one factor of production among many—it is the meta-factor that determines how productively all other factors are deployed. For developing nations, this model is simultaneously the most difficult (requiring generational investment and institutional patience) and the most durable.
Real-World Exemplar: Singapore & Estonia
Singapore’s investment in education consistently ranks among the highest globally as a share of government spending. The result: Singapore’s students rank #1 globally in mathematics and science on OECD PISA 2022 assessments, a pipeline that feeds directly into a workforce commanding the highest median wages in Asia. Estonia—a nation of 1.3 million—built a digital governance infrastructure (e-Estonia) so sophisticated that 99% of government services are accessible online, reducing bureaucratic friction costs by an estimated 2% of GDP annually, per McKinsey Global Institute’s Digital Estonia case study.
| Dimension | Detail | Key Metric |
| Dimension | Detail | Key Metric |
| Model | Human Capital Investment | Singapore / Estonia |
| PISA Math Rank | Singapore: #1 globally | OECD PISA 2022 |
| e-Estonia Savings | ~2% of GDP/year | McKinsey Digital Govt. Review |
| Singapore Median Wage | Highest in Asia | MOM Singapore Statistics 2024 |
| Education ROI | +8–13% wages per year schooling | World Bank HCI 2024 |
| Source | OECD, McKinsey, World Bank | Ministry of Manpower SG |
| MODEL 08 OF 10 · CORE FRAMEWORK: REGIONAL INTEGRATION & BLOC-LEVEL ECONOMICS |
8. The Bloc Multiplier: How Regional Economic Integration Transforms Small-Market Disadvantage Into Collective Scale
Core Thesis
A nation of 20 million people with a $15 billion GDP is, in isolation, a rounding error in global trade negotiations. A bloc of 15 such nations, integrated under a common external tariff and harmonized regulatory framework, becomes a $225 billion market—large enough to attract serious FDI, negotiate meaningful trade agreements, and support regional value chains that would be economically unviable for any member in isolation. The BRICS economic trajectory increasingly demonstrates this logic at the largest scale: the bloc now represents over 35% of global GDP on PPP terms, per IMF data, creating collective bargaining power in international financial architecture that no single member could wield alone.
Real-World Exemplar: ASEAN & the African Continental Free Trade Area
ASEAN’s evolution from a loose political forum into the world’s fifth-largest economy as a bloc—with combined GDP exceeding $3.6 trillion—illustrates the compounding benefits of integration. The ASEAN Secretariat Statistical Yearbook 2024 shows intra-ASEAN trade reaching $756 billion in 2023. The African Continental Free Trade Area (AfCFTA), fully operational since 2021, carries even more transformative potential: the World Bank AfCFTA Impact Assessment 2023 projects the agreement could lift 30 million Africans out of extreme poverty and boost intra-African trade by 81% by 2035—if implemented with fidelity.
| Dimension | Detail | Key Metric |
| Dimension | Detail | Key Metric |
| Model | Regional Integration / Bloc Economics | ASEAN / AfCFTA |
| ASEAN GDP (2023) | $3.6 trillion (combined) | ASEAN Secretariat 2024 |
| Intra-ASEAN Trade | $756 billion (2023) | ASEAN Stat Yearbook 2024 |
| AfCFTA Poverty Lift | 30 million by 2035 (projected) | World Bank 2023 |
| AfCFTA Trade Boost | +81% intra-African trade potential | World Bank AfCFTA Report |
| Source | ASEAN Secretariat, World Bank | IMF BRICS Monitor 2024 |
| MODEL 09 OF 10 · CORE FRAMEWORK: INSTITUTIONAL QUALITY & ANTI-CORRUPTION ARCHITECTURE |
9. The Invisible Infrastructure: How Institutional Quality and Anti-Corruption Reform Unlock Every Other Development Model
Core Thesis
Every other model on this list is rendered partially or wholly ineffective in the absence of one foundational precondition: institutions that are reliable, transparent, and resistant to elite capture. This is the uncomfortable truth that the Washington Consensus got right in diagnosis, if catastrophically wrong in prescription. The World Bank’s Worldwide Governance Indicators demonstrate a near-linear correlation between rule of law scores, control of corruption metrics, and long-run per-capita income growth. Nations that implement credible anti-corruption architecture—independent judiciaries, digitized procurement, beneficial ownership registries, whistleblower protections—attract more FDI per capita, service their debt at lower spreads, and compound their human capital investments more efficiently.
Real-World Exemplar: Georgia & Uruguay
Georgia’s radical anti-corruption reforms between 2004–2012—which included abolishing and reconstituting the entire traffic police force overnight, digitalizing the national property registry, and publishing every state contract online—generated a 30-point improvement in Transparency International’s Corruption Perceptions Index within eight years. The World Bank Doing Business evolution for Georgia saw the nation climb from 112th to 7th globally in ease of doing business in the same period. FDI as a share of GDP tripled. Uruguay’s independent anti-corruption framework and judicial independence scores—the highest in Latin America per World Justice Project Rule of Law Index 2024—have consistently attracted investment-grade credit ratings despite being a small, commodity-linked economy.
| Dimension | Detail | Key Metric |
| Dimension | Detail | Key Metric |
| Model | Institutional Reform / Anti-Corruption | Georgia / Uruguay |
| Georgia CPI Change | +30 points (2004–2012) | Transparency International |
| Georgia Doing Business Rank | 112th → 7th globally | World Bank Doing Business |
| FDI Impact | Tripled as % of GDP post-reform | UNCTAD World Investment Report |
| Uruguay Rule of Law | #1 in Latin America | World Justice Project 2024 |
| Source | Transparency International, WJP | World Bank WGI 2024 |
| MODEL 10 OF 10 · CORE FRAMEWORK: SOUTH-SOUTH COOPERATION & ALTERNATIVE CAPITAL ARCHITECTURE |
10. South-South Cooperation and the New Financial Architecture: Escaping the Dollar Trap and Western Conditionality
Core Thesis
The emerging consensus among development economists is that the post-Bretton Woods financial architecture—dominated by the IMF, World Bank, and Western capital markets—imposes conditionalities and carries structural biases that have, at minimum, complicated and at worst actively obstructed the development ambitions of nations in the Global South. The rapid expansion of South-South cooperation frameworks—China’s Belt and Road Initiative, the New Development Bank, the Asian Infrastructure Investment Bank, and bilateral currency swap arrangements—represents a genuine structural shift in the menu of available financing options for developing nations. The BRICS economic trajectory now includes serious discussion of a BRICS reserve currency, and the NDB’s paid-in capital base has reached $10 billion, per its 2024 Annual Report.
Real-World Exemplar: Ethiopia & Indonesia
Ethiopia’s industrial park strategy—financed substantially through Chinese development finance and the NDB—created 100,000+ manufacturing jobs in six years and generated $2.1 billion in export revenues from apparel and light manufacturing, per UNCTAD World Investment Report 2024. Indonesia has strategically leveraged South-South arrangements to negotiate better terms on nickel processing requirements, insisting that raw nickel ore—critical for EV batteries—be processed domestically rather than exported raw, a policy the IMF’s Indonesia Article IV 2024 estimates could add $30–40 billion annually to GDP once downstream battery manufacturing scales.
| Dimension | Detail | Key Metric |
| Dimension | Detail | Key Metric |
| Model | South-South Cooperation | Ethiopia / Indonesia |
| NDB Capital Base | $10 billion paid-in capital (2024) | NDB Annual Report 2024 |
| NDB Project Approvals | $33B+ since inception | New Development Bank |
| Ethiopia Manufacturing Jobs | 100,000+ in 6 years | UNCTAD WIR 2024 |
| Indonesia Nickel Downstream | +$30–40B GDP potential | IMF Indonesia Art. IV 2024 |
| Source | UNCTAD, IMF, NDB | New Development Bank 2024 |
Conclusion: The Hybrid Imperative — Why the Winner Will Be the Nation That Masters Intelligent Economic Pluralism
The nations that will ascend to genuine economic superpower status over the next three decades will not be those that selected one model from this list and executed it faithfully. History is unambiguous on this point. South Korea combined export-led industrialization (Model 1) with aggressive human capital investment (Model 7) and targeted SEZ experimentation (Model 6). China fused all of these with South-South financing architecture (Model 10) and leapfrog digital infrastructure (Model 2). Singapore is essentially Models 6 and 7 in a city-state laboratory. The most sophisticated development economists at the IMF, the Brookings Institution, and Harvard’s Growth Lab all converge on the same conclusion: sequencing and contextual calibration matter as much as model selection.
What distinguishes tomorrow’s economic giants is not which blueprint they borrowed, but whether they possessed the institutional quality (Model 9) to implement it, the regional scale (Model 8) to amplify it, and the sovereign flexibility—freed from commodity dependence (Model 3) and Western conditionality (Model 10)—to adapt it without foreign veto. The nations on the cusp of this achievement today—India, Vietnam, Indonesia, Ethiopia, Morocco, Kenya—share a common denominator: they have all, consciously or pragmatically, begun assembling hybrid frameworks drawing from multiple models simultaneously.
The Harvard Growth Lab’s Atlas of Economic Complexity 2024 ranks economic complexity—the diversity and sophistication of a nation’s productive capabilities—as the single strongest predictor of future income growth. Economic complexity is itself the quantitative fingerprint of successful hybridization. The highest-complexity developing economies are precisely those that have refused to accept any single model’s constraints and instead built diversified productive ecosystems capable of competing across multiple global value chains simultaneously.
| 📊 Final Verdict: There is no single road to economic supremacy. But there is a consistent pattern among nations that travel it fastest: they think in systems, invest in people, protect institutions, and borrow selectively from every model that fits their unique endowments. The most dangerous development strategy is ideological purity. |
Frequently Asked Questions (FAQ Schema)
| What is the fastest-growing economic model for developing countries in 2025? Based on current IMF, World Bank, and McKinsey data, the services-led knowledge economy model (exemplified by India) and leapfrog digital development (exemplified by Kenya and Rwanda) are generating the fastest convergence toward high-income status in 2025. However, the highest sustained growth rates are recorded by nations combining export industrialization with deliberate human capital investment—Vietnam and Bangladesh are the most proximate examples in the current cycle. |
| Can developing nations realistically become the world’s biggest economy? Yes—and according to the IMF’s April 2025 World Economic Outlook, this is already occurring on a PPP-adjusted basis. India is projected to become the world’s third-largest nominal GDP economy by 2027. On a purchasing-power-parity basis, China already surpassed the United States in 2016. The structural fundamentals—demographic dividends, urbanization, technology diffusion, and institutional reform momentum—favour several developing nations ascending to the top tier of global economic power within 25 years. |
| What is leapfrog economics and how does it work for developing nations? Leapfrog economics is the theory that developing nations can bypass intermediate stages of technological and infrastructure development by adopting the latest generation of technology directly—skipping, for example, copper telephone networks in favour of immediate 5G deployment, or coal power grids in favour of solar microgrids. Kenya’s M-Pesa mobile money platform—which extended financial services to 40+ million people without a traditional bank branch network—is the paradigmatic global example. The economic benefit is both cost efficiency (newer technology is often cheaper than legacy systems) and speed of deployment. |
| What role does the BRICS economic trajectory play in developing nation growth? BRICS and its expanded BRICS+ grouping (now including Egypt, Ethiopia, UAE, Iran, and Saudi Arabia) plays an increasingly critical role in three distinct ways: first, as an alternative source of development finance through the New Development Bank ($33B+ in approvals) that carries lower conditionality than IMF/World Bank programmes; second, as a collective bargaining forum that amplifies developing-nation voices in IMF quota negotiations and WTO dispute resolution; and third, as an emerging architecture for de-dollarized trade settlement, which—if implemented at scale—would reduce developing nations’ vulnerability to U.S. Federal Reserve policy decisions and dollar-denominated debt crises. |
References & Data Sources
IMF World Economic Outlook, April 2025
- World Bank Open Data Portal
- World Bank AfCFTA Impact Assessment 2023
- IRENA Renewable Energy Outlook Africa 2023
- IEA Global Hydrogen Review 2024
- NASSCOM Strategic Review 2024
- McKinsey Global Institute Digital Reports
- Brookings Institution SEZ Analysis
- GSMA Mobile Economy Report 2024
- Harvard Growth Lab Atlas of Economic Complexity 2024
- OECD PISA 2022 Results
- World Justice Project Rule of Law Index 2024
- New Development Bank Annual Report 2024
- UNCTAD World Investment Report 2024
- Transparency International Corruption Perceptions Index
- ASEAN Secretariat Statistical Yearbook 2024
- Norges Bank Investment Management Annual Report 2024
- Goldman Sachs Global Investment Research – India Outlook 2024
Discover more from The Economy
Subscribe to get the latest posts sent to your email.

Russia Raised VAT to 22% to Pay for the War. It Still Isn’t Enough

Six Straight Quarters of Falling Prices: Inside China’s Deflation Trap

Canada Missed Its CUSMA Deadline. Now Its Economy Is “On Pause”

UK Stagflation 2026: Why the Bank of England May Hike Rates, Not Cut Them

Chipmakers Just Lost 6.7% in Two Days: Inside the Great AI Trade Rotation

AI Bubble Risk 2026: BIS Warns Private Credit Could Trigger Financial Crisis

US Jobs Report July 2026: Why Weak Payrolls Sent the Dow to a Record High

The Top 10 Economic Research Institutes in the World

Singapore GDP Grew 6% in Q1 2026 — Why Forecasts Stay Cautious

IMF Cuts Pakistan Growth Forecast, Raises Inflation to 8.4%

Malaysia GDP Growth Slows as Strait of Hormuz Crisis Drags On

Indonesia’s 150-Million-Barrel Russian Oil Deal Explained

Russia’s Sanctioned Oil Giants Regain 57% Export Share via Shadow Fleet

UBS Report: Billionaire Wealth Up 25% on AI Boom as Median Wealth Falls

PwC China Partner Payouts Cut Amid Evergrande Audit Fraud

Investors Pile Into Bullish Dollar Bets as ‘US Exceptionalism’ Trade Returns

Broadcom Market Value Loss: Revenue Forecast Disappoints

Nasdaq Tumbles 4% as Chip and Memory Stocks Sink: A $1.2 Trillion Wipeout

How to Fix Pakistan’s Debt Economy: A Structural Blueprint

Japan’s Nikkei Scales Record Peak as AI Shares Track US Chip Rally

Grinding the Already Ground: Pakistan’s Inflation Crisis

Democrats Draw a Red Line Around Military AI — And the Pentagon Is Already Pushing Back

JPMorgan Cuts Anthropic AI Access in Hong Kong

Smash Capital Leads $200M Funding for Allen Control Systems

New Investment Super-Cycle: AI, Green Energy & Re-Shoring

Middle East Conflict Oil Prices: The $4 Surge Explained

Xponential Fitness Franchise Lawsuit: The $3.97M Judgment

The End of the Chatbot: Why OpenAI is Tearing Up Its Most Successful Product
-

 Markets & Finance6 months ago
Top 15 Stocks for Investment in 2026 in PSX: Your Complete Guide to Pakistan’s Best Investment Opportunities
-

 Analysis4 months ago
Top 10 Stocks for Investment in PSX for Quick Returns in 2026
-

 Analysis5 months ago
Brazil’s Rare Earth Race: US, EU, and China Compete for Critical Minerals as Tensions Rise
-

 Analysis4 months ago
Johor’s Investment Boom: The Hidden Costs Behind Malaysia’s Most Ambitious Economic Surge
-

 Banks6 months ago
Best Investments in Pakistan 2026: Top 10 Low-Price Shares and Long-Term Picks for the PSX
-

 Investment6 months ago
Top 10 Mutual Fund Managers in Pakistan for Investment in 2026: A Comprehensive Guide for Optimal Returns
-

 Global Economy6 months ago
15 Most Lucrative Sectors for Investment in Pakistan: A 2025 Data-Driven Analysis
-

 Global Economy6 months ago
Pakistan’s Export Goldmine: 10 Game-Changing Markets Where Pakistani Businesses Are Winning Big in 2025