
Analysis
S&P 500 Slips Back to 7,408 as Oil Storms Past $109, Bond Yields Clock 19-Year Highs

A perfect storm of surging crude, a resurgent 30-year Treasury yield not seen since 2007, and a Trump–Xi summit that yielded little on Iran collided Friday to drag every major index lower — and raise a more uncomfortable question: is the market’s AI-fueled euphoria colliding with an old-fashioned energy shock?
Key Market Moves — May 15, 2026
| Index / Asset | Close | Change |
|---|---|---|
| S&P 500 | 7,408.50 | ▼ 1.24% (–93 pts) |
| Nasdaq Composite | 26,225.14 | ▼ 1.54% |
| Dow Jones Industrial Average | 49,526 | ▼ 1.07% (–537 pts) |
| Russell 2000 | — | ▼ 2.40% |
| WTI Crude Futures (June) | $105.42/bbl | ▲ 4.20% |
| Brent Crude (July) | $109.26/bbl | ▲ 3.35% |
| 10-Year Treasury Yield | 4.595% | ▲ +14.5 bps |
| 30-Year Treasury Yield | 5.127% | ▲ +10 bps |
| Gold (spot) | $4,583.02/oz | ▼ 1.43% |
| Silver (spot) | $79.07/oz | ▼ 5.10% |
| S&P 500 Energy Sector | — | ▲ 1.60% |
| S&P 500 Materials Sector | — | ▼ 2.00%+ |
| Intel (INTC) | — | ▼ 6.00%+ |
| AMD | — | ▼ 5.70% |
| Micron Technology | — | ▼ 6.60% |
| Nvidia (NVDA) | — | ▼ 4.40% |
There is an old Wall Street maxim that markets can ignore the world’s troubles for a very long time — right up until they can’t. On Friday, May 15, 2026, that long-running tolerance expired in spectacular fashion. The S&P 500 shed 1.24%, closing at 7,408.50. The Dow Jones Industrial Average lost 537 points to settle at 49,526. The Nasdaq Composite fell 1.54% to 26,225. And the Russell 2000 — that barometer of domestic-facing, rate-sensitive smaller companies — tumbled 2.4%, on course for its worst single-session performance since last November.
So why is the stock market down today? The short answer is that three overlapping forces — a roaring oil market, a bond market in open revolt, and a diplomatic summit that ended with little more than polite communiqués — converged simultaneously, and the equity market, trading near all-time highs on AI-driven optimism, had no satisfactory answer for any of them.
The Petroleum Problem: When $109 Brent Is No Longer a Number People Can Ignore
Let’s start with oil, because oil is where this story really begins. The International Energy Agency has characterized the 2026 Iran conflict as producing the largest supply disruption in the history of the global oil market — a classification that, once you absorb it fully, makes the equity market’s previous composure seem faintly extraordinary.
By Friday’s close, WTI crude had surged 4.2% to settle at $105.42 per barrel. Brent — the international benchmark that shapes most global refinery decisions — rose 3.35% to $109.26. That’s well above the $70 level at which both benchmarks traded before the Iran conflict began. The Strait of Hormuz, the narrow chokepoint through which roughly 20% of the world’s seaborne crude passes, remains closed to tankers, and the arithmetic of constrained supply meeting resilient global demand is merciless. The nationwide average price of unleaded gasoline has now risen to $4.50 per gallon — up 51% since the war started, a squeeze on household discretionary budgets that no Federal Reserve monetary policy committee meeting can easily resolve.
The market’s concern is not merely the current price of oil — it is the trajectory it implies. Dan Niles, founder of Niles Investment Management, put it bluntly on CNBC Friday afternoon: ten of the last twelve recessions were preceded by an oil price spike. “This is starting to get uncomfortable,” he said, a sentence that qualifies as something close to understatement when Brent is kissing $110 and the Strait of Hormuz remains a war zone.
For investors trying to understand the stock market decline reasons today, the oil-inflation-Fed feedback loop is arguably the most important chain of causality to trace. Higher energy costs feed directly into headline inflation, which constrains the Federal Reserve’s room to maneuver. The Fed, already operating under its new chair Kevin Warsh, has seen markets swing from expecting rate cuts in 2026 to pricing in the possibility of rate hikes — a dizzying reversal that would have seemed improbable even a few months ago.
The Bond Market’s Message: 5.13% and Rising
If oil is the accelerant, the bond market is where the fire truly shows itself. And right now, the bond market is sending a message that should concern every equity investor regardless of their sector exposure.
The yield on the 30-year U.S. Treasury bond surged to 5.127% on Friday — its highest level since 2007, the year before the financial crisis reshaped the world’s conception of what “safe” means. On Wednesday, the Treasury Department had already sold 30-year bonds above 5% for the first time in nearly two decades, a milestone that passed with less fanfare than it deserved. The 10-year Treasury note — the benchmark that underpins mortgage rates, corporate borrowing costs, and the discount rate used to value every growth stock in America — rose to 4.595%, its highest since February 2025.
“Bond yields definitely feel like they are getting a bit unhinged.”
— Subadra Rajappa, Head of U.S. Research, Société Générale, Bloomberg TV, May 15, 2026
The mechanism by which rising yields wound through Friday’s equity market was not subtle. Higher Treasury yields make the “risk-free” return from government bonds more competitive against equities, depressing the relative attractiveness of stocks — especially high-growth, long-duration names where the bulk of cash flows are priced as distant future earnings. They also raise borrowing costs across the real economy. For smaller companies in the Russell 2000, many of whom rely on floating-rate debt and carry significantly more leverage relative to earnings than their S&P 500 peers, the effect is felt faster and more acutely. The Russell’s 2.4% drop — double the S&P 500’s decline — tells that story with blunt arithmetic.
The selloff in bonds was emphatically not a U.S.-only phenomenon, which should give pause to any analyst tempted to frame this as a domestic story. In the U.K., the yield on the 30-year gilt surged to its highest level since 1998, driven partly by political uncertainty surrounding Prime Minister Keir Starmer. Japan, which is heavily exposed to Middle East energy supplies, saw its 10-year government bond yield hit its highest level since 1999. The global bond market, in other words, is repricing risk simultaneously — and that kind of synchronized move tends to carry more weight than any single economy’s fiscal quirks.
As Krishna Guha, vice chairman of Evercore ISI, wrote to clients on Friday: “The combination of a renewed gradual march higher in oil prices on stalled U.S.–Iran negotiations and strong U.S. investment data is putting upward pressure on bond yields, in the U.S. and globally — creating a new headwind for equities.” That is a careful analyst’s way of saying the market faces simultaneous pressure from multiple directions, with no obvious release valve in sight.
The Beijing Summit: Much Ceremony, Little Substance
Into this already brittle environment arrived the conclusion of President Trump’s summit with Chinese President Xi Jinping in Beijing — and markets, which had hoped for meaningful progress on Iran or at least a durable framework on trade, received something considerably thinner. The two leaders agreed, according to a White House readout, that the Strait of Hormuz “must remain open.” They did not agree on how to make that happen.
The concrete deliverables were slim. Trump announced that China had agreed to purchase American oil — “they’re going to go to Texas, to Louisiana, to Alaska,” he told Fox News — and Boeing reported some orders. But for investors who had been quietly hopeful that the world’s two largest economies might engineer a diplomatic resolution that could ease the energy shock, the summit’s outcome was deflating. “Markets didn’t hear enough from Beijing to turn more optimistic on the Gulf,” ING analysts wrote in a note to clients. The few headlines that emerged were, as one strategist put it, “underwhelming.”
The geopolitical architecture here matters enormously for understanding the stock market today and, more importantly, the weeks ahead. Trump’s own public posture hardened after the summit: he told Fox News he was “not going to be much more patient” with Iran and urged Tehran to “make a deal.” That kind of language tends to extend — rather than shorten — the timeline for a diplomatic resolution, keeping a floor under oil prices and a ceiling over equity multiples.
Technology Stocks: When Gravity Finally Asserts Itself
The sector most visibly wounded on Friday was technology, which makes a certain narrative sense: the group had run harder and faster than almost anything else in the first half of 2026, powered by AI-related spending enthusiasm and robust earnings from the hyperscalers. That kind of momentum is intoxicating right up until it meets rising discount rates and inflation fears — at which point the reckoning tends to be swift.
Intel retreated more than 6%. Advanced Micro Devices fell 5.7%. Micron Technology — whose memory chip business is deeply tied to AI infrastructure spending — shed 6.6%. Nvidia, the company that has come to represent the AI investment thesis in a single ticker, dropped 4.4%. Even Cerebras Systems, which had made a spectacular Nasdaq debut the prior session — surging 68% in its first day of trading — gave back 10% of those gains almost immediately as the broader tape deteriorated.
Why the Tech Selloff Is Both Rational and Worth Watching Carefully
The selloff in semiconductors and AI hardware names is not, on its own, cause for structural alarm — Morningstar’s technology analysts have noted that roughly 78% of S&P 500 companies reporting this earnings season beat consensus estimates, with semiconductor margins particularly robust. Profit-taking after a sharp rally is a normal, healthy function of a functioning market.
What is worth watching is whether Friday’s pullback marks the beginning of a sustained rotation out of AI-related growth names and into more defensive, cash-generative sectors — or whether it is simply a momentary reset before the next leg higher. The energy sector’s 1.6% gain Friday (the only S&P 500 sector to close positive) offers one clue about where capital may rotate next. Materials and utilities, despite also being in the red, are sectors that traditionally offer some shelter in inflationary environments over longer time horizons.
Stagflation: The Word No One Wants to Say Out Loud
Here is the word that serious analysts are beginning to say quietly, in private, while still using careful circumlocutions in their published notes: stagflation. The IEA’s characterization of the Iran conflict’s energy market impact as the “largest supply disruption in the history of the global oil market” is not rhetorical flourish — it is the kind of structural shock that historically produces precisely the combination of stagnant growth and persistent inflation that central banks are least equipped to handle.
The Fed’s dilemma is vertiginous. Traders now see the Fed not only forgoing rate cuts but potentially hiking rates in 2026, according to CME Group data — a dramatic reversal of the consensus that had prevailed even three months ago. But hiking rates into an energy-driven inflationary shock does not address the supply side of the problem. It simply makes the growth side worse.
The IMF’s most recent World Economic Outlook already flagged that sustained oil price increases of the magnitude now observed would knock meaningful basis points off global GDP growth projections. The parallels to the 1970s — which the Wikipedia analysis of the 2026 Iran war explicitly invokes — are uncomfortable. Then, as now, a Middle Eastern supply shock collided with a central bank that lacked clean options. The policy response of that era — aggressive rate hikes that ultimately broke the back of inflation but also triggered recession — is not a template anyone is eager to repeat.
“When you see oil price spikes, they don’t really matter if they come back down again. The question is whether this one does.”
— Dan Niles, Founder, Niles Investment Management, CNBC Power Lunch, May 15, 2026
What the Sector Map Tells Us
Ten of the eleven S&P 500 sectors closed in the red on Friday. That breadth of decline — a rare, near-unanimous vote of no confidence from equities — is itself meaningful data. When the selloff is confined to one or two sectors, it is often a rotation story. When ten out of eleven sectors fall simultaneously, it is a macro story.
The worst performers were materials (down more than 2%) and utilities (also down more than 2%), followed by industrials at –1.9%. This pattern deserves unpacking. Materials names are exposed to both slowing global demand fears and rising energy-input costs — a double squeeze. Utilities, which carry significant debt loads and are typically valued as bond proxies, suffer directly when Treasury yields spike. Industrials are getting hit by fears of economic deceleration. Energy’s 1.6% gain is the exception that confirms the rule: in a world where oil is the instrument of crisis, oil producers benefit even as the broader market bleeds.
Retail stocks also came under pressure heading into a consequential week of sector earnings, as investors grow increasingly cautious about consumer spending. Gas at $4.50 per gallon has a habit of showing up in discretionary spending data with a lag of four to six weeks — meaning the consumption data that equity analysts will be scrutinising through late May and June may prove considerably less rosy than the current consensus.
One Bright Spot: Manufacturing Data Offers Complexity
Not everything on Friday pointed downward. The Empire State Manufacturing Index — the Federal Reserve Bank of New York’s monthly gauge of factory activity in the region — leapt to 19.6 for May, well above the 7.0 estimate and the highest reading since April 2022. A separate report showed U.S. industrial production improving more than economists had expected in April.
This is the paradox that makes the current environment genuinely complicated for investors: the underlying economy is not in recession. It is, in many respects, surprisingly resilient. Corporate earnings have beaten estimates at a rate above the historical average. The labor market remains reasonably tight. But that same resilience gives the Federal Reserve less political cover to cut rates — which in turn keeps long-end Treasury yields elevated — which in turn depresses equity multiples — which explains some portion of why the stock market is down today even as the economy’s vital signs look acceptable.
Good economic news, in other words, is becoming complicated news. It is the sort of environment that rewards investors who can hold two contradictory thoughts simultaneously: the economy is doing better than feared, and that may make things harder for markets before it makes them easier.
What This Means for Investors
Navigating the Confluence of Oil, Yields, and Geopolitical Uncertainty
Friday’s broad selloff is not a reason to panic — but it is a legitimate reason to think hard about portfolio construction in an environment where the rules are shifting. Here is what the current landscape argues for, and against:
Energy exposure: The sector’s 1.6% gain Friday is no accident. If the Strait of Hormuz remains constrained and the Iran conflict persists without a diplomatic resolution, integrated majors and upstream producers remain structurally advantaged. Bloomberg’s energy desk has been flagging this rotation for weeks.
Duration risk in bond portfolios: A 30-year yield at 5.13% is uncomfortable news for anyone holding long-duration fixed income. The yield curve is signalling that the market has fundamentally repriced rate expectations — and if inflation data continues to run hot into summer, the repricing may not be finished.
Tech concentration risk: For investors whose portfolios have become heavily concentrated in AI hardware and semiconductor names through passive index exposure, Friday’s action is a reminder that even the most compelling structural themes require a valuation discipline. The AI investment thesis is intact; it’s the multiple at which investors own it that is being debated.
Small-cap caution: The Russell 2000’s 2.4% decline — double the S&P 500 — reflects the leverage reality of smaller companies in a rising-rate environment. Selectivity matters more than it did when rates were near zero.
Cash and short-duration instruments: With T-bills and short-duration Treasuries offering yields not seen in two decades, holding some cash equivalent is no longer the penalty it once was. Optionality has value in uncertain environments.
Watch the Strait: More than any earnings report, Fed meeting, or economic data point in the near term, developments around the Strait of Hormuz and U.S.–Iran diplomacy will likely be the single most important variable for stocks over the next four to eight weeks.
The world’s financial markets are, at their core, complex discounting mechanisms — machines that try to price the future in real time. Right now, that machinery is processing a genuinely difficult set of inputs: an energy shock with no clear endpoint, a bond market breaking through 19-year yield levels, a diplomatic void where progress was hoped for, and an AI-driven equity rally that priced in relatively benign outcomes. The recalibration was probably inevitable. What matters now is what comes next.
Discover more from The Economy
Subscribe to get the latest posts sent to your email.


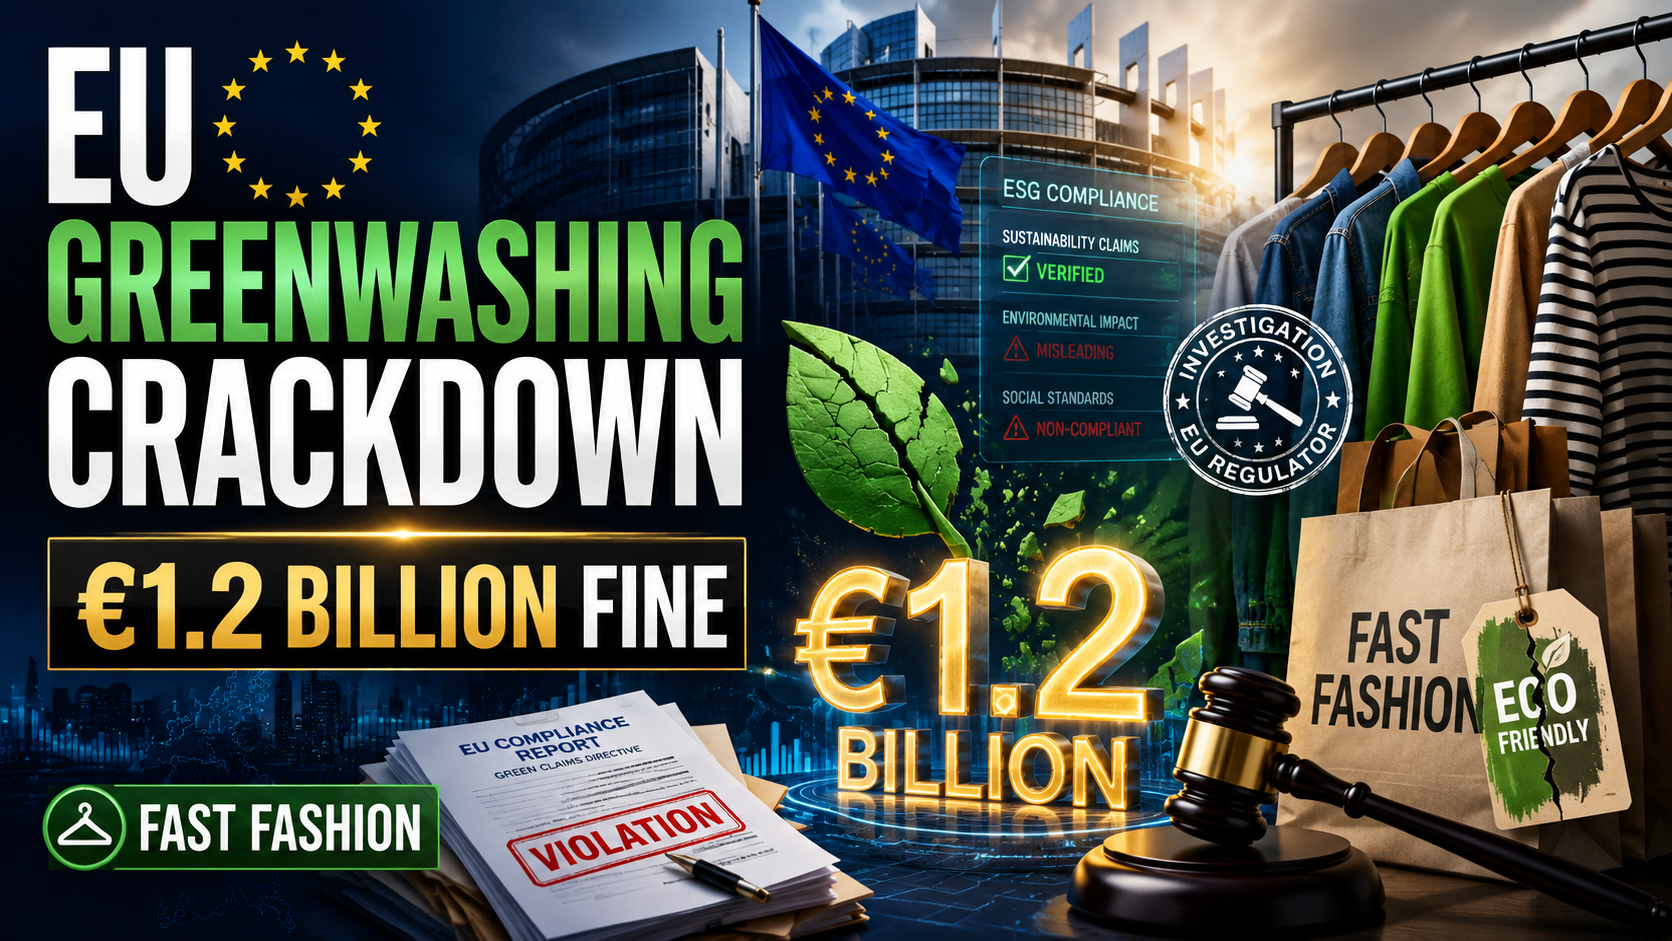
The Definitive Guide to the New Green Claims Rules and What They Mean for Business
The European Commission dropped a bombshell on the fast‑fashion industry in late June 2026, fining five major retailers a combined €1.2 billion for systematically misleading consumers about the environmental credentials of their products (European Commission Press Corner, June 2026). The coordinated action, brought by the EU Consumer Protection Cooperation Network, marks the largest EU greenwashing enforcement action in history and signals a new era of aggressive regulation. The companies—whose names have been redacted pending legal review—were found to have used vague terms like “eco‑friendly,” “sustainable choice,” and “green” without substantiating their claims with verifiable lifecycle assessments. One retailer’s “recycled polyester” jackets, which still relied on virgin fossil‑fuel‑based material for 70% of their content, were singled out as “grossly misleading.”
The Legal Framework: Empowering Consumers Directive and Green Claims Directive
This crackdown operationalizes two landmark pieces of legislation. The Empowering Consumers Directive, adopted in March 2024 and transposed into member state law by mid‑2026, amends the Unfair Commercial Practices Directive to explicitly ban generic environmental claims that cannot be proven. The Green Claims Directive, which entered into force in January 2026, requires any explicit environmental claim—such as “carbon‑neutral” or “biodegradable”—to be substantiated by an independent, third‑party‑verified assessment using a product environmental footprint (PEF) methodology. The directive also prohibits claims that a product has a neutral or positive environmental impact based solely on offsetting carbon credits; actual emissions reductions must be demonstrated first.
The June 2026 fines are a direct consequence of this legal framework. The EU’s consumer protection network, working with national authorities, conducted a “sweep” of over 5,000 product webpages and found that 42% contained “vague, false, or deceptive” green claims. The fast‑fashion sector, with its high turnover of styles and marketing built on constant newness, was the worst offender. The €1.2 billion penalty—calculated as 4% of the companies’ annual EU‑wide turnover—is the maximum allowed under the new regime and is intended as a deterrent.
Corporate Sustainability Claims Crackdown: What Must Change
The crackdown is forcing a fundamental rethink of marketing and product development. Companies can no longer rely on a glossy “sustainability” microsite alongside a core business of high‑volume, low‑price disposable fashion. The corporate sustainability claims crackdown requires:
- Lifecycle Transparency: Claims must be supported by a full lifecycle assessment (LCA) that covers raw material extraction, manufacturing, transport, use, and end‑of‑life. The EU is building a centralized registry of verified LCAs, accessible to consumers via a QR code on product labels.
- Digital Product Passports: By 2027, all textile products sold in the EU must carry a digital product passport that details the product’s composition, recycled content, water usage, and carbon footprint. This passport must be updatable and linked to a tamper‑proof blockchain ledger (European Commission, Digital Product Passport Regulation).
- No Offsetting‑Based Neutrality: Statements like “climate‑neutral” or “CO₂‑neutral” are banned unless the company has already achieved deep in‑house emission cuts. Offsetting can only address the final, residual emissions.
- Substantive Change, Not Marketing Spin: Fast‑fashion firms must decouple revenue from resource use. The EU’s Textile Strategy, a parallel policy, mandates that by 2030, textiles placed on the EU market must be durable, repairable, and recyclable. Brands are now investing in recycling infrastructure, bio‑based materials, and rental/resale models.
The Global Precedent
The EU’s action is setting a global precedent. The UK’s Competition and Markets Authority (CMA) has launched a parallel investigation into three fashion retailers, and the US Federal Trade Commission is finalizing its update to the “Green Guides,” which will require similar substantiation for claims made in the American market (FTC, Green Guides Update Notice, June 2026). Australia, Canada, and South Korea have also signaled they will adopt the EU’s PEF methodology. For multinational brands, the EU standard is becoming the de facto global benchmark because supply chains are integrated; it is inefficient to produce one “green” line for Europe and a “conventional” line for the rest of the world.
Business Response and Strategic Advantage
The immediate reaction among fast‑fashion CEOs has been a scramble to hire compliance officers, retrain marketing teams, and audit supply chains. Some are pre‑emptively dropping all environmental claims from their advertising and replacing them with numeric data. “We’re moving from adjectives to numbers,” the chief sustainability officer of a major European retailer told the Financial Times. “Instead of saying ‘eco‑friendly jeans,’ we say ‘These jeans contain 42% recycled cotton and used 20% less water than our baseline in 2022.’ It’s less sexy but more honest.”
Forward‑thinking companies see the regulation as a competitive moat. Those that have already invested in traceability, such as using blockchain to track organic cotton from farm to garment, can verify their claims and will gain consumer trust. The EU Ecolabel is being revamped to incorporate the new criteria, and early adopters are experiencing a “green trust premium” in brand valuation. New entrants are building business models entirely around compliance: repair‑and‑resale platforms, rental subscription services, and circular‑design software are attracting venture capital.
The Bottom Line
The €1.2 billion fine is a watershed moment. It signals that greenwashing is no longer a public‑relations risk; it is a material financial, legal, and reputational liability. Companies that have treated sustainability as a marketing veneer are being exposed, and the cost of non‑compliance—fines, exclusion from public procurement, and damage to brand equity—is now existential. The EU greenwashing enforcement wave is just beginning, and its ripple effects will reshape consumer goods markets for a decade. The takeaway for business leaders is clear: substantiate, digitize, and transform your product design, or face the consequences.
Discover more from The Economy
Subscribe to get the latest posts sent to your email.
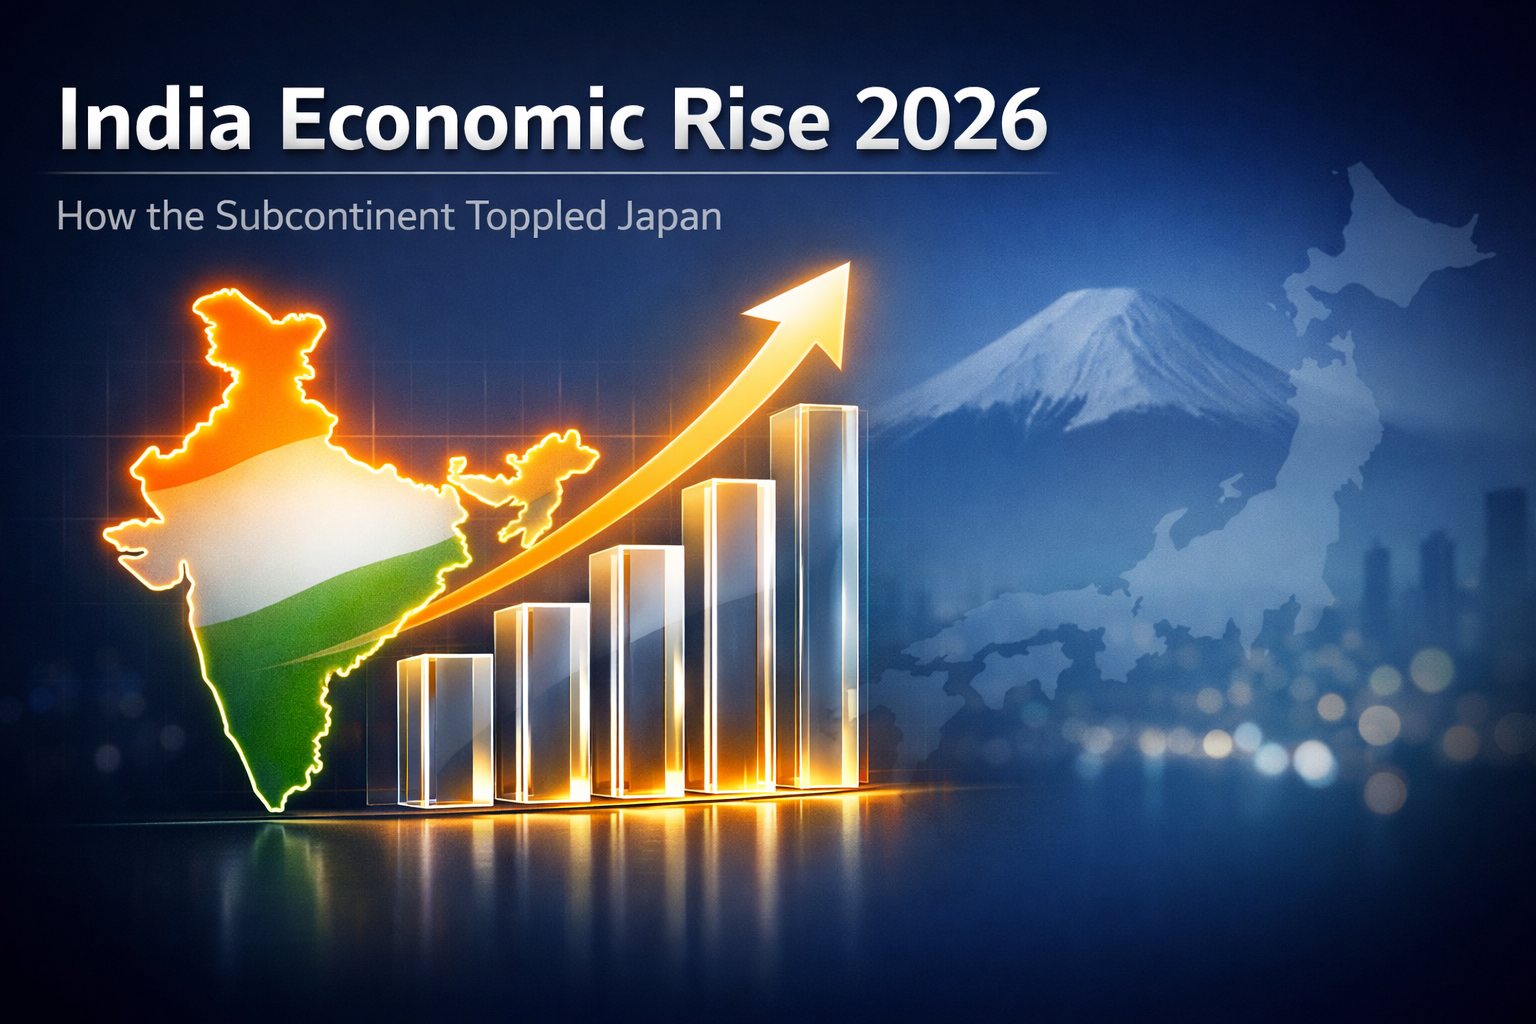
Demographics, Digital Infrastructure, and a Manufacturing Explosion Propel India’s Ascent
India has officially overtaken Japan to become the world’s third‑largest economy in nominal GDP terms, the International Monetary Fund confirmed in its April 2026 World Economic Outlook database. With a GDP of $5.2 trillion, India now trails only the United States ($32 trillion) and China ($21 trillion) (IMF WEO Database, April 2026). The milestone cements the India economic rise 2026 narrative that has captivated global investors, strategists, and policymakers. The ascent is not a statistical fluke; it is the result of a confluence of structural forces: a demographic dividend, a digital‑public‑infrastructure revolution, and a manufacturing boom that is redrawing global supply chains.
The Demographic Dividend: A 25‑Year Tailwind
India’s population, at 1.48 billion, is now the world’s largest, and its median age is just 28. While China and Japan grapple with aging, shrinking workforces, India is adding 12 million young people to the labor market every year. The United Nations projects that India will account for 22% of the world’s working‑age population between 2025 and 2050. This demographic bulge, if effectively harnessed, can produce a virtuous cycle of rising savings, investment, and consumption.
The challenge is employment. The labor force participation rate has improved to 55% from a low of 40% in 2021, but is still below the 60%+ levels needed to absorb the influx. The government’s response is a combination of mass skilling (the Skill India Digital platform has trained 250 million people), entrepreneurship support (the MUDRA loan scheme has disbursed over $150 billion to micro‑enterprises), and large‑scale infrastructure projects. The National Infrastructure Pipeline, which aims to invest $2 trillion by 2030, is creating jobs in construction, logistics, and urban services.
Digital Public Infrastructure: The Game‑Changer
India’s most powerful economic weapon is its digital public infrastructure. The Unified Payments Interface (UPI) processed 18 billion transactions worth $3.5 trillion in May 2026 alone, a volume that dwarfs all other real‑time payment systems globally ([NPCI Monthly Statistics, June 2026](https://www.npci.org.in/statistics/monthly-metrics)). UPI has formalized a vast informal economy, allowing street vendors to accept digital payments, small businesses to access credit based on transaction history, and the government to deliver subsidies directly to beneficiaries’ bank accounts, plugging $45 billion in annual leakage.
The Open Network for Digital Commerce (ONDC) is democratising e‑commerce by unbundling the platform‑centric model of Amazon and Flipkart, enabling small retailers to list their products on a unified network. The Account Aggregator framework is pioneering consent‑based data sharing, reducing the cost of credit assessment and enabling a boom in small‑business lending. Aadhaar, the biometric ID, covers 1.4 billion people and is the backbone for KYC and service delivery. This stack, collectively, is adding an estimated 1.5 percentage points to annual GDP growth by cutting transaction costs and increasing economic participation (IMF Working Paper, “India’s Digital Revolution”, 2026).
The Manufacturing Boom and PLI Scheme
India’s manufacturing sector, long an underperformer, has undergone a renaissance. The Production‑Linked Incentive (PLI) scheme, launched in 2020 and expanded to 14 sectors, offers fiscal incentives to firms that achieve specified investment and sales thresholds. By June 2026, PLI‑sanctioned investments had reached $65 billion, creating 2.8 million direct jobs (DPIIT Annual Report 2025‑26). The biggest success stories are in electronics and automobiles. Apple now produces over 20% of its global iPhone output in India, up from 5% in 2022, and its supplier ecosystem—Foxconn, Wistron, Pegatron—has expanded aggressively. Samsung’s smartphone factory in Noida is its largest globally. Tesla’s Gigafactory in Sanand, Gujarat, started production in early 2026, initially targeting domestic and Southeast Asian markets.
Semiconductor fabrication, a strategic priority, has received a $15 billion government commitment. Micron’s ATMP facility in Sanand and the Tata Group’s fab in Dholera are under construction, with the first “Made in India” chips expected in 2027. The global manufacturing boom in India is being driven by the “China + 1” strategy, but also by the sheer size of the Indian consumer market, which is projected to become the world’s third‑largest by 2027.
The Nominal GDP League Table and What It Means
Surpassing Japan in nominal GDP is symbolically powerful but must be understood in context. India’s per‑capita GDP is still only $3,600, about one‑tenth of Japan’s and less than one‑third of China’s. The country remains a lower‑middle‑income nation, with 220 million people living below the national poverty line. However, the pace of income growth is accelerating: real per‑capita GDP has grown at an average of 6.5% annually over the past four years, a trajectory that, if maintained, could lift per‑capita income to $10,000 by 2035, transforming India into an upper‑middle‑income country.
For global investors, India is the “consensus long” of the decade. Equity markets, represented by the Nifty 50, have delivered a 15% compound annual growth rate in dollars over the last five years, driven by earnings growth, not multiple expansion. Foreign portfolio inflows have been robust, but foreign direct investment is the real engine, reaching $85 billion in FY2025‑26. Sectors attracting the most FDI include renewable energy, digital services, data centers, and healthcare. The bond market’s inclusion in the J.P. Morgan and Bloomberg emerging‑market indices has reduced borrowing costs and expanded the investor base.
Risks remain: political polarization, the complex federal structure that can delay land acquisition and labor reforms, and the external vulnerability of oil imports (India imports 85% of its crude). Yet the structural narrative is overwhelmingly positive. India’s rise is not just about catching up; it is about creating a distinct, digitally‑native growth model that combines scale, frugality, and innovation. As Japan’s Nikkei noted in an editorial, “India’s ascent is a reminder that economic dynamism has shifted from the old industrial powers to the demographic giants of the South” (Nikkei Asia, June 2026).
Discover more from The Economy
Subscribe to get the latest posts sent to your email.
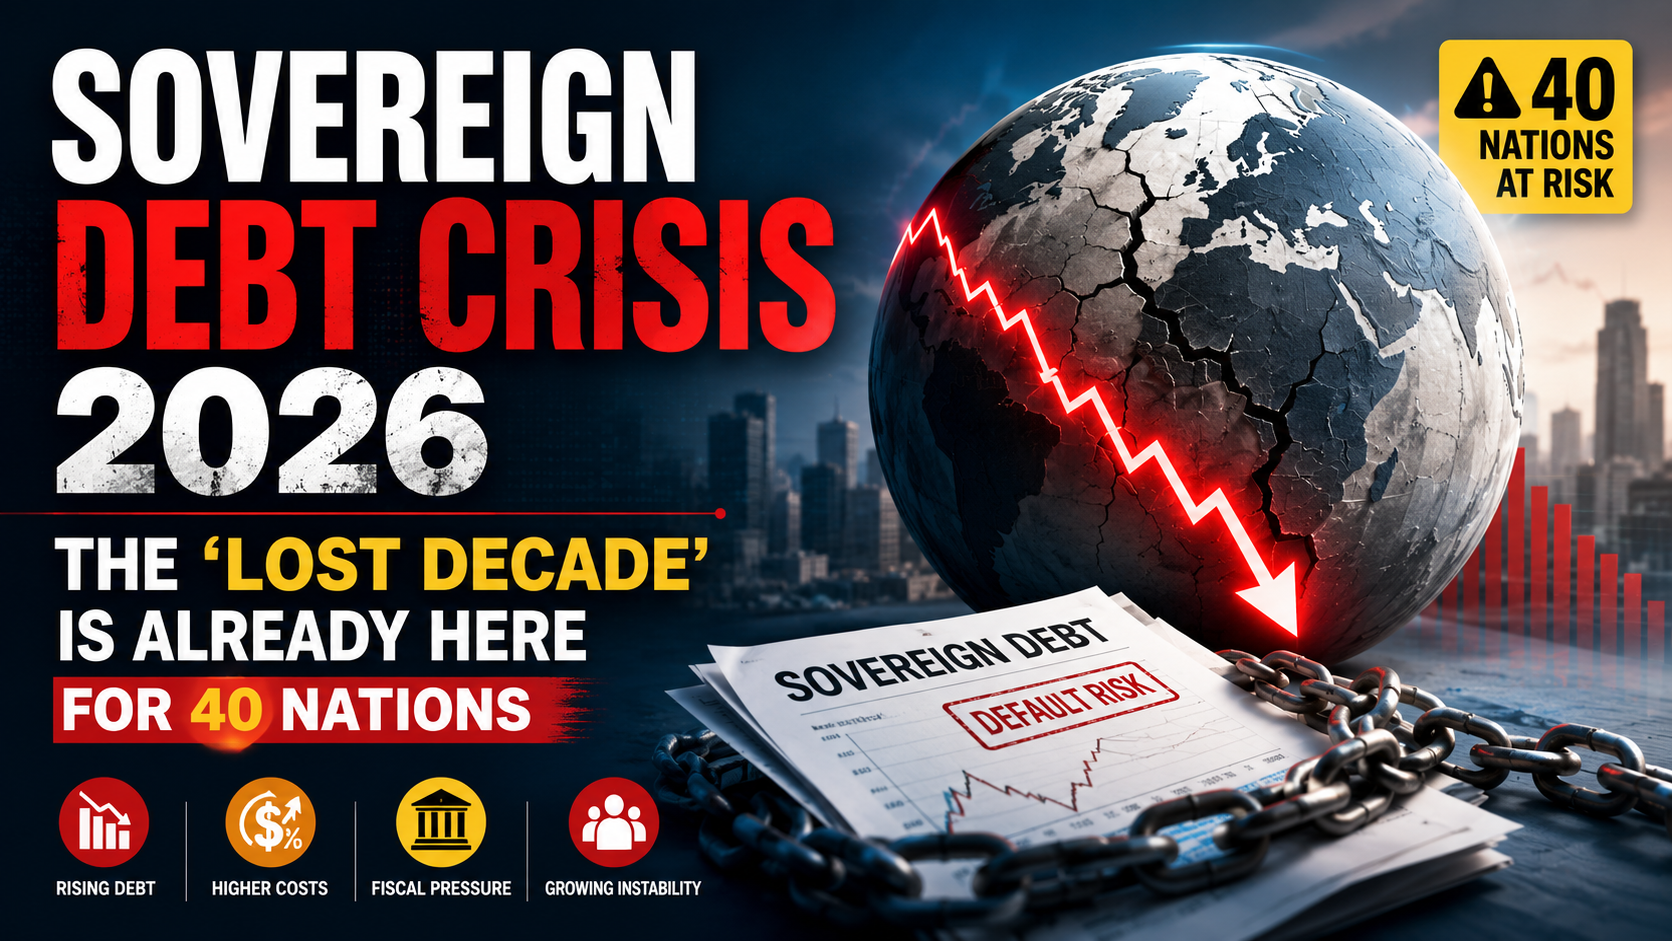
World Bank Issues Its Starkest Warning Yet for Developing Economies
Half of the world’s low‑income countries are poorer today than they were before the COVID‑19 pandemic, the World Bank’s Global Economic Prospects report for June 2026 declares. The report paints a grim picture of a sovereign debt crisis 2026 that is pushing 40 developing nations into a lost decade of economic stagnation, rising poverty, and dwindling human capital (World Bank, Global Economic Prospects, June 2026). “A tepid global recovery, tight monetary conditions, and escalating climate impacts have created a perfect storm for the world’s most vulnerable economies,” the Bank’s chief economist wrote in the foreword. The consequences are not just economic; they are unraveling decades of development gains.
The Vicious Cycle of Debt Distress
The mechanics of the crisis are well‑rehearsed but no less devastating. Developing countries borrowed heavily during the pandemic to sustain livelihoods and later to cope with food and energy price spikes after the Ukraine war and the 2024–25 El Niño. Much of that borrowing was on commercial terms—Eurobonds and syndicated loans with high interest rates and short maturities. When the Federal Reserve and other advanced‑economy central banks raised rates to fight inflation, the dollar strengthened, and global risk appetite shrank. Countries faced a triple whammy: higher debt servicing costs, weaker currencies that inflated the local‑currency value of dollar‑denominated debt, and reduced access to new financing.
The World Bank reports that the median external debt‑to‑GNI ratio for low‑income countries has climbed to 65%, up from 42% in 2019. Debt service is absorbing an average of 22% of government revenue, crowding out spending on education, health, and infrastructure. Zambia, which defaulted in 2020 and only concluded a protracted restructuring in 2024, is again in distress as copper prices have declined and new loans carry steep premiums. Ghana’s 2024 restructuring has not restored market access; its international bonds still trade at deeply distressed levels. Ethiopia, in the midst of a civil conflict recovery, is attempting to restructure $30 billion of external debt under the G20 Common Framework, but negotiations with private creditors and China, its largest bilateral lender, are gridlocked over the comparability of treatment principle (IMF Press Briefing, June 2026).
The “Lost Decade” for Human Capital
The fiscal squeeze is translating into a human tragedy. The UN Development Programme estimates that 1 in 3 children in debt‑distressed low‑income countries are out of school, up from 1 in 5 in 2019. Public health spending per capita has fallen by 12% in real terms since 2019 in sub‑Saharan Africa, leaving health systems unprepared for recurrent climate‑related disease outbreaks. The World Bank warns that the “learning poverty” rate—the share of 10‑year‑olds unable to read a simple text—has surged to 85% in the worst‑affected countries. This erosion of human capital will permanently lower the growth potential of a generation.
Climate change is amplifying the debt trap. When a cyclone hits Mozambique or a drought withers crops in the Sahel, the reconstruction costs force governments to take on more emergency debt, often at punitive rates, while climate‑proofing infrastructure is deferred due to lack of grant finance. The World Bank calculates that the 40 most climate‑vulnerable, debt‑distressed nations face an average annual climate‑related loss of 3.2% of GDP, exceeding their total inward foreign direct investment (World Bank, “Climate and Debt Nexus” report, June 2026). The promised $100 billion‑a‑year climate finance goal (now $2.4 trillion ask) remains unmet, and only 25% of that arrives as grants rather than loans, further adding to debt stocks.
Multilateral Reform: Too Little, Too Late?
The international community’s response remains inadequate. The G20 Common Framework, designed to coordinate debt relief among Paris Club, non‑Paris Club, and private creditors, has been slow and beset by legal disputes. Only a handful of countries have reached agreements, and the process lacks enforcement power. The IMF has proposed a “Bridgetown 2.0” initiative, championed by Barbados Prime Minister Mia Mottley, which would create a systemic debt‑for‑nature swap facility, a new issuance of Special Drawing Rights channeled to developing countries, and a permanent sovereign debt restructuring mechanism (UN General Assembly, “Bridgetown 2.0 Briefing”, May 2026). The proposal has broad support among developing nations but faces resistance from some creditor countries worried about moral hazard and the precedent of automatic debt write‑downs.
The World Bank itself is undergoing a capital adequacy review to stretch its balance sheet, potentially freeing up an additional $100 billion in lending capacity over a decade. But even this is insufficient relative to the trillions in investment needed. Private creditors, including large asset managers like BlackRock and Amundi, have signaled willingness to participate in “new money” deals if the IMF and World Bank provide credit enhancements and if countries adopt transparent fiscal rules. The “Zambia model” of a two‑stage restructuring—a relatively quick sovereign debt treatment, followed by a longer‑term reprofiling with GDP‑linked bonds—has become a template, but its replication has proven difficult.
Investor Implications
For global investors, the developing‑country debt crisis presents a high‑risk, high‑reward landscape. Distressed sovereign bonds of frontier markets offer yields of 15–25%, and vulture funds are circling. However, litigation risks, as seen in the Argentine saga, are high. The more constructive play is in “new money” bonds that come with World Bank partial guarantees, which are being developed for green infrastructure projects. Development finance institutions are also creating securitization structures that pool diversified climate‑resilient assets, offering investors a blended return with credit enhancement. The key is to be selective: countries with credible IMF programs, diversified export bases (like Senegal and Rwanda), and manageable bilateral debt are better placed to navigate the crisis.
The World Bank’s stark message is that the lost decade is not a forecast; it is a lived reality. Without a dramatic acceleration in debt relief, concessional finance, and private‑sector innovation, the Sustainable Development Goals will be missed by a generation, and the human and geopolitical costs will reverberate far beyond the borders of the affected nations.
Discover more from The Economy
Subscribe to get the latest posts sent to your email.

Bitcoin $150k Milestone Achieved as US Sovereign Crypto Pivot Looms

S&P 500 7000 Target: Wall Street’s Bullish Case for Year‑End 2026

EU Greenwashing Enforcement Hits New Peak with €1.2 Billion Fast‑Fashion Fine

India Economic Rise 2026: How the Subcontinent Toppled Japan

Sovereign Debt Crisis 2026: The ‘Lost Decade’ Is Already Here for 40 Nations

Crude Oil Price Rally June 2026: OPEC+ Extends Cuts, Targets $100

China Housing Market Turnaround: White‑List Model Stabilises Prices

US Sovereign Debt Risk 2026: CBO Projects $50 Trillion, Fitch Warns

BRICS De‑Dollarization Strategy Takes Shape with $15 Billion Local‑Currency Push

Digital Euro Cross‑Border Pilot Goes Live: What It Means for Banks

AI Impact on Wages 2026: Productivity Soars, Paychecks Stagnate

Global Economic Outlook June 2026: Trade Fragmentation Bites

SpaceX IPO 2026: Inside the $2 Trillion Valuation That Remade Wall Street

Kevin Warsh’s Regime Change: The Federal Reserve in the Age of War, Inflation, and Political Pressure

PwC China Partner Payouts Cut Amid Evergrande Audit Fraud

Broadcom Market Value Loss: Revenue Forecast Disappoints

Investors Pile Into Bullish Dollar Bets as ‘US Exceptionalism’ Trade Returns

Here’s How Much It’ll Cost You to Be Part of SpaceX’s Record-Breaking $75 Billion IPO

Nasdaq Tumbles 4% as Chip and Memory Stocks Sink: A $1.2 Trillion Wipeout

How to Fix Pakistan’s Debt Economy: A Structural Blueprint

Japan’s Nikkei Scales Record Peak as AI Shares Track US Chip Rally

Smash Capital Leads $200M Funding for Allen Control Systems

Grinding the Already Ground: Pakistan’s Inflation Crisis

Democrats Draw a Red Line Around Military AI — And the Pentagon Is Already Pushing Back

New Investment Super-Cycle: AI, Green Energy & Re-Shoring

JPMorgan Cuts Anthropic AI Access in Hong Kong

Xponential Fitness Franchise Lawsuit: The $3.97M Judgment

Middle East Conflict Oil Prices: The $4 Surge Explained
-

 Markets & Finance6 months ago
Top 15 Stocks for Investment in 2026 in PSX: Your Complete Guide to Pakistan’s Best Investment Opportunities
-

 Analysis4 months ago
Top 10 Stocks for Investment in PSX for Quick Returns in 2026
-

 Analysis5 months ago
Brazil’s Rare Earth Race: US, EU, and China Compete for Critical Minerals as Tensions Rise
-

 Analysis4 months ago
Johor’s Investment Boom: The Hidden Costs Behind Malaysia’s Most Ambitious Economic Surge
-

 Banks5 months ago
Best Investments in Pakistan 2026: Top 10 Low-Price Shares and Long-Term Picks for the PSX
-

 Investment6 months ago
Top 10 Mutual Fund Managers in Pakistan for Investment in 2026: A Comprehensive Guide for Optimal Returns
-

 Global Economy6 months ago
15 Most Lucrative Sectors for Investment in Pakistan: A 2025 Data-Driven Analysis
-

 Global Economy6 months ago
Pakistan’s Export Goldmine: 10 Game-Changing Markets Where Pakistani Businesses Are Winning Big in 2025