
Analysis
Robert Kiyosaki’s $1.2B Debt Explained: Real Estate Leverage & 2026 Predictions

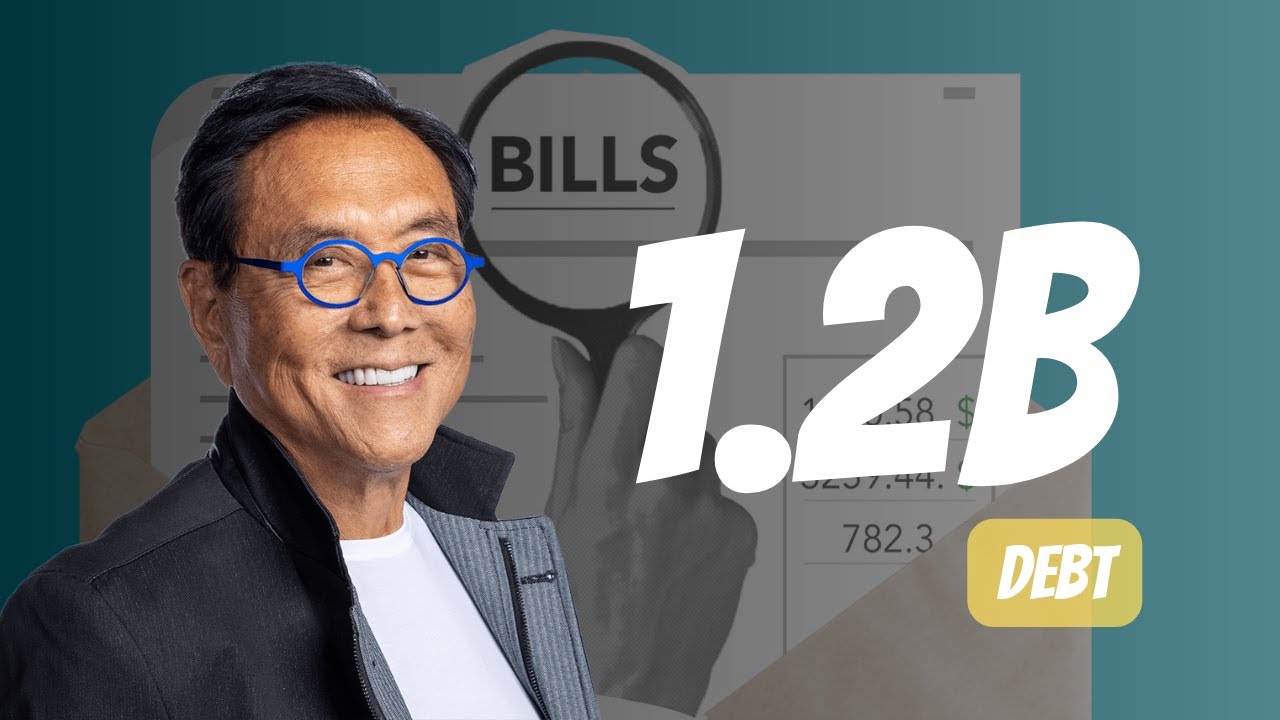
A disclosure putting Robert Kiyosaki’s real-estate-linked debt at $1.2 billion has renewed scrutiny of the “Rich Dad Poor Dad” author’s leveraged investing philosophy, but the figure needs context: it represents financing tied to roughly 1,500 apartment units, not personal liability, with Kiyosaki’s own equity stake estimated by Vanity Fair at just $30–60 million. The debt story lands alongside Kiyosaki’s continued bullish public calls on silver (targeting $200/oz from a recent level near $85) and Bitcoin, both framed as hedges against what he calls an unsustainable US debt and currency picture.
Kiyosaki’s Balance Sheet vs. Asset Predictions
| Metric | Figure | Context |
|---|---|---|
| Reported total real-estate-linked debt | $1.2 billion | Financing roughly 1,500 apartment units (non-recourse, asset-backed structure) |
| Kiyosaki’s personal equity stake (est.) | $30–60 million | Per Vanity Fair, as relayed by his former wife/business partner Kim Kiyosaki |
| Silver spot price (recent) | ~$85/oz | As of Kiyosaki’s public commentary, mid-2026 |
| Kiyosaki’s long-term silver target | $200/oz | Public statements, 2026 |
| Bitcoin price at time of debt disclosure | ~$77,476 | Early September 2026 |
| Bitcoin 2026 year-to-date low point (July) | -33% YTD | Before August recovery |
| Bitcoin YTD performance after August rebound | -10.91% YTD | Trimmed from -33% low |
| US spot Bitcoin ETF inflows (August 2026) | $3.5 billion | Strongest monthly inflow since July 2025 |
| Kiyosaki’s cited US national debt figure | ~$39 trillion | Public commentary basis for currency-devaluation thesis |
| Kiyosaki’s 2024 Bitcoin prediction ($350,000 by Aug. 25, 2024) | Did not materialize | Disclosed as a prediction, not a guarantee, per his own framing |
Sources: Hokanews and COINOTAG (Sept. 1–2, 2026), CoinCentral and Pluang (May 2026), Yahoo Finance (Nov. 2025, cited for prior-year price-target context).
Deep Dive: Separating the Debt Headline From the Investment Thesis
What the $1.2 Billion Debt Figure Actually Represents
The headline number is attention-grabbing, but the underlying structure matters more than the total. According to reporting that traces back to comments from Kim Kiyosaki — Robert’s former wife and long-time business partner — the $1.2 billion in liabilities sits against a portfolio of approximately 1,500 apartment units, and represents financing secured by those income-generating properties rather than unsecured personal debt. Vanity Fair separately estimated Kiyosaki’s own equity share of the underlying real estate at a considerably smaller $30 million to $60 million.
This distinction is central to understanding Kiyosaki’s own stated investment philosophy, which has for decades drawn a sharp line between what he calls “productive” debt — borrowing secured by cash-flowing assets that can service the loan through rental income — and consumer debt used to finance depreciating purchases. Whether or not one agrees with the framework, the reporting is consistent that the $1.2 billion is not money Kiyosaki personally owes in full, and the properties themselves generate rental income that is structured to service the debt.
The Risk the Structure Doesn’t Eliminate
Asset-backed, non-recourse-style borrowing can preserve liquidity and let an investor retain ownership of underlying properties without needing to sell assets to raise cash — a genuine advantage of the approach in a rising or stable property market. But the structure does not eliminate risk: heavy leverage of this kind exposes the investor to higher financing costs when rates rise and to potential impairment if property performance (occupancy, rents, or valuations) softens. A $1.2 billion debt load against a $30–60 million personal equity stake implies substantial leverage — a structure that amplifies both potential returns and potential losses if the underlying 1,500-unit portfolio’s performance were to deteriorate.
The Silver Thesis: A Decades-Old Position, Not a New Trade
Kiyosaki has repeatedly emphasized that his silver position dates back to 1965, when he began accumulating the metal at age 18, at a time when it traded for pennies per ounce. With spot silver recently trading near $85 an ounce, he has set a long-term target of $200, framing the metal as both a monetary hedge against currency devaluation and a bet on industrial demand. He is not alone in flagging silver as undervalued: multiple market commentators have pointed to depleted CME warehouse inventories and rising industrial consumption (driven substantially by solar panel and electronics manufacturing) as structural supports for higher prices, independent of Kiyosaki’s own commentary.
The Bitcoin Thesis, and a Track Record Worth Weighing Honestly
Kiyosaki has for years ranked among Bitcoin’s most vocal price bulls, and it’s worth being direct about his track record on specific price calls: a June 2024 prediction that Bitcoin would reach $350,000 by August 25 of that year did not materialize, a point he has acknowledged while maintaining that the level would eventually be reached — a framing that treats missed timelines as a delay rather than an invalidation of the underlying thesis. Bitcoin’s own 2026 trading history adds relevant context for anyone weighing his current calls: the asset fell roughly 33% year-to-date by July under tight monetary conditions before a V-shaped August recovery trimmed that loss to roughly 11%, a rebound that coincided with $3.5 billion in US spot Bitcoin ETF inflows for the month — the strongest since July 2025.
The Macro Thesis Tying It Together
Kiyosaki’s public framing consistently returns to the same structural argument: roughly $39 trillion in US national debt, combined with what he describes as ongoing dollar devaluation dating back to 1974 (a reference to the post-Bretton Woods fiat currency era), creates conditions he believes will culminate in a broader economic reckoning. He has also flagged fragility in baby boomer retirement portfolios — heavily concentrated in traditional stocks and bonds — as a systemic vulnerability if his broader crash thesis were to play out. It’s worth noting plainly that this crash-timing call is not new; Kiyosaki has made similar warnings across multiple years, and mainstream forecasters, per available reporting, largely continue to project moderate rather than crisis-level economic conditions, even while acknowledging genuine risks around sovereign debt levels and geopolitical tensions.
Reading Leverage as a Philosophy, Not Just a Number
Perhaps the more durable, transferable lesson from the Kiyosaki debt story — independent of whether his specific silver or Bitcoin price targets prove accurate — is the framework itself: asset-backed leverage against cash-flowing real estate is a genuinely different risk profile than unsecured personal debt, but “different” does not mean “risk-free.” Investors evaluating any leveraged real estate strategy, their own or a public figure’s, should look past the headline debt total to the underlying loan-to-value ratios, income coverage, and personal-versus-asset-level liability structure before drawing conclusions about how exposed the equity holder actually is.
Actionable Takeaways for Investors
- Separate headline debt figures from personal liability exposure in any leveraged real estate story. A $1.2 billion portfolio-level debt figure against a $30–60 million personal equity stake tells you about leverage ratio, not about what the individual investor stands to lose in an absolute-dollar sense.
- Track CME silver inventory levels as an independent check on the undervaluation thesis. This is a verifiable, non-Kiyosaki-specific data point that multiple analysts have cited separately from his commentary.
- Weigh any specific price target against the forecaster’s own disclosed track record. Kiyosaki’s 2024 Bitcoin call that did not materialize by its stated deadline is public, documented context worth factoring into how much weight to place on his current $200 silver target or ongoing Bitcoin bullishness.
- Distinguish asset-backed leverage from consumer debt when evaluating your own portfolio’s risk. The productive-versus-consumer debt framework Kiyosaki popularizes is a genuinely useful mental model, applicable well beyond his specific real estate holdings.
- Monitor Bitcoin ETF flow data as a more immediate sentiment gauge than any single commentator’s price target. The $3.5 billion August 2026 inflow figure is a concrete, trackable data point that offers a more current read on institutional positioning than any individual’s long-term price call.
Frequently Asked Questions
How much debt does Robert Kiyosaki actually have?
Reporting places Kiyosaki’s total real-estate-linked debt at approximately $1.2 billion, financing roughly 1,500 apartment units, but this is asset-backed portfolio debt rather than personal liability — his own equity stake in the underlying properties is estimated at $30 million to $60 million by Vanity Fair.
What is Robert Kiyosaki’s silver price prediction for 2026?
Kiyosaki has set a long-term target of $200 per ounce for silver, up from a recent trading level near $85, framing the metal as both a currency-devaluation hedge and an industrial-demand play, consistent with a position he says he began building in 1965.
Did Robert Kiyosaki’s past Bitcoin price predictions come true?
Not always — a June 2024 prediction that Bitcoin would reach $350,000 by August 25, 2024 did not materialize, a target he has acknowledged missed its timeline while maintaining he believes the price level will eventually be reached.
Why does Robert Kiyosaki think a global economic crash is coming?
Kiyosaki attributes his crash prediction to roughly $39 trillion in US national debt combined with dollar devaluation he traces to 1974, along with what he views as fragile baby boomer retirement portfolios overexposed to traditional financial assets — though mainstream economic forecasters generally project moderate rather than crisis-level growth.
Discover more from The Economy
Subscribe to get the latest posts sent to your email.



Key Takeaways
- Rolex’s secondary market rose approximately 7.9% year-over-year as of 2026 (per WatchCharts data) — trailing Patek Philippe (+16.2%) and Tudor (+11.4%) but still outperforming Audemars Piguet (+3.4%).
- Rolex raised U.S. retail prices 4–9% in January 2026 (steel models ~5.6%, gold models ~8.7%), narrowing the historical gap between retail and pre-owned pricing.
- Not every model appreciates: steel sports references (Submariner, GMT-Master II, Daytona) have held value far better than two-tone or widely available dress references like the standard Datejust.
- The Lady-Datejust posted the sharpest 2026 gain among tracked collections — up 22.73%, from roughly $9,269 to $11,376 — driven by demand for smaller, “everyday luxury” watches.
- Gold’s rise past $2,400/oz has directly lifted the investment case for Rolex’s precious-metal references (Day-Date, Sky-Dweller, Yacht-Master).
The Model-by-Model Picture
| Category | 2026 Trend |
|---|---|
| Lady-Datejust | +22.73% (strongest performer among tracked collections) |
| Steel sports models (Submariner, GMT-Master II) | Held value well; corrected from 2022 peak but stabilized above retail |
| Daytona | Corrected from highs above $50,000 to the mid-$30,000s; still among the most sought-after references |
| Two-tone/widely available Datejust | Flat to negative — “holds value” is an overstatement for this category |
| Gold references (Day-Date, Sky-Dweller) | Lifted by gold’s rise above $2,400/oz |
Why the “Rolex Always Appreciates” Myth Is Fading
The pandemic-era boom pushed some references — the Daytona above all — to speculative highs disconnected from historical norms. Since the March 2022 peak, steel sports models have compressed meaningfully, and dealers who bought inventory near the top have in some cases faced 20–40% markdowns on liquidation. The lesson for 2026 buyers: Rolex as a category is not a monolith. Value retention depends heavily on specific reference, condition, and whether the piece comes with box and papers (“full set”).
What’s Actually Driving 2026 Strength
- Retail price increases raise the floor. When a new Submariner retails at $10,050 (up from $9,500), a pre-owned example at $11,000–$12,000 suddenly represents a smaller premium — narrowing the gap without secondary prices actually moving.
- Supply discipline remains Rolex’s core lever. The brand has never confirmed production numbers, and secondary-market premiums remain entirely a function of Rolex’s own manufacturing decisions — a risk factor as much as a support.
- Certified Pre-Owned rollout. Rolex’s now fully rolled-out CPO program has changed how buyers transact in the used market, adding a layer of brand-verified legitimacy that supports pricing.
The Case for Rolex as a Portfolio Diversifier
Financial advisors increasingly frame luxury watches not as a replacement for equities or bonds, but as a tangible, historically low-correlation diversifier — one that carries its own risks (illiquidity, condition-dependent pricing, no yield) but has demonstrated multi-decade resilience for specific references.
Is Rolex a good investment in 2026?
It depends heavily on the specific reference. Steel sports models like the Submariner and Daytona have held or grown in value; two-tone and widely available dress models generally have not. Overall, Rolex’s secondary market rose about 7.9% year-over-year in 2026, trailing Patek Philippe but ahead of Audemars Piguet.
Discover more from The Economy
Subscribe to get the latest posts sent to your email.

Navigating Mortgage and Loan Refinancing in a High-Yield Environment
Global public debt crossing critical thresholds has kept central bank policies volatile, resulting in fluctuating US Treasury yields throughout 2026. For homeowners and commercial property holders burdened by previous high-interest borrowing cycles, finding optimal refinance windows has become a high-stakes financial puzzle. Stalled disinflation and stubborn employment numbers mean rate cuts are incremental, requiring borrowers to act with precision.
Timing your mortgage or commercial loan refinance in this environment requires a deep understanding of yield curve movements and lender risk appetites.
Decoding 2026 Refinance Dynamics
The 10-Year Treasury Yield Benchmark
Mortgage rates continue to track closely with the 10-year US Treasury yield. When macroeconomic anxiety spikes debt issuance, yields rise, tightening consumer borrowing capacity. Savvy borrowers monitor weekly Treasury auctions to lock in rates during brief dip windows.
Hybrid ARMs and Alternative Structures
With fixed rates remaining elevated, 7/1 and 10/1 adjustable-rate mortgages (ARMs) have surged in popularity. These products offer lower initial monthly payments, giving borrowers breathing room until central bank easing cycles fully materialize.
| Loan Product | Current Rate Range | Best For | Key Risk Factor |
| 30-Year Fixed Mortgage | 6.2% – 6.8% | Long-term predictability | Higher initial monthly outlay |
| 7/1 Hybrid ARM | 5.5% – 5.9% | Short-term ownership / flipping | Rate reset risk after year 7 |
| Commercial Refinance | 7.0% – 8.2% | Corporate asset restructuring | Strict DSCR lender covenants |
Actionable Steps for Successful Refinancing
To maximize your chances of securing favorable refinance terms in a volatile market, follow a disciplined preparation strategy.
Boost Your Credit Score Immediately: Lenders in 2026 are applying stringent credit tiering; a 20-point increase can drop your APR by a crucial quarter-point.
Shop Regional Credit Unions: Smaller financial institutions often offer portfolio loans with more flexible underwriting than major national banks.
Calculate the Break-Even Point: Ensure your total closing costs are recouped through monthly savings within 24 months of closing.
“Market Strategist View: Refinancing in 2026 is an exercise in opportunistic timing. Borrowers must maintain immaculate financial profiles ready to strike the moment Treasury yields dip.”
Mastering the complexities of today’s debt environment ensures you can successfully lower your debt service costs and protect your long-term financial stability.
Discover more from The Economy
Subscribe to get the latest posts sent to your email.

The days of pulling generic auto insurance quotes based purely on your zip code and age are officially over. In 2026, insurance comparison engines are powered entirely by generative AI and real-time telematics. These platforms digest thousands of live data points—ranging from your driving smoothness via connected vehicle sensors to real-time traffic congestion patterns—to generate hyper-personalized premiums instantly.
For consumers, this evolution represents both a massive opportunity for savings and a hidden trap for penalty pricing. Understanding how AI algorithms evaluate risk is essential for anyone looking to lower their monthly auto insurance premiums.
How AI Comparison Engines Evaluate Your Risk Profile
Behavioral Telematics and Connected Cars
Modern cars stream performance data directly to insurance aggregators. Generative AI models analyze braking sharpness, acceleration curves, cornering G-forces, and phone distraction metrics. Drivers who maintain smooth, defensive habits are rewarded with dynamic rate cuts of up to 40% compared to traditional rating tiers.
Predictive Traffic and Weather Modeling
AI tools now cross-reference your daily commute route with predictive weather and accident probability models. If your standard parking location or driving corridor has a statistically higher incidence of uninsured motorist claims, your quotes will reflect that hyper-local risk assessment.
| Comparison Factor | Traditional Rating Model | 2026 Generative AI Model | Impact on Premium |
| Mileage & Usage | Annual estimated odometer reading | GPS tracking & live trip duration | High (up to 35% savings) |
| Driving Behavior | MVR driving record & accidents | Real-time braking, speed, & G-force | Critical (determines tier) |
| Vehicle Tech | Make, model, and safety rating | ADAS calibration & repair cost data | Moderate |
Strategies to Lower Your AI-Driven Insurance Quote
To outsmart the algorithm and secure the lowest possible premium in 2026, drivers must proactively manage their digital footprint on insurance platforms.
Opt-In for Telematics Trial Periods: Many insurers offer immediate 15% discounts just for installing their driving app; let it track safe habits for 30 days to lock in permanent savings.
Scrub Unverified Public Records: Ensure your motor vehicle report is free of clerical errors that AI risk models misinterpret as reckless behavior.
Compare AI Aggregators: Use platforms that integrate multi-carrier API feeds rather than single-brand comparison sites to find the best risk-adjusted rate.
“Industry Note: AI-driven pricing rewards transparency and precision. Drivers who actively manage their telematics data consistently out-save those relying on legacy quote calculators.”
Embracing AI comparison tools allows savvy policyholders to customize coverage limits precisely to their driving habits, eliminating wasted premium spend while ensuring robust protection.
Discover more from The Economy
Subscribe to get the latest posts sent to your email.

Pakistan Real Estate Tax 2026: What Buyers, Sellers and Investors Must Check

SME Finance Pakistan 2026: Why Small Businesses Still Struggle for Credit

Pakistan IMF Programme 2026: Why Bailouts Keep Returning

Agri-Tech Pakistan 2026: Where Farming Innovation Could Actually Pay

Pakistan Tax Net: Why Agriculture, Retail and Property Are So Hard to Tax

KSE-100 Index 2026: Is Pakistan’s Stock-Market Recovery Sustainable?

Pakistan IT Exports 2026: What Would It Take to Reach $10 Billion?

Pakistan AI Policy 2025: Can It Raise Productivity and Create Jobs?

Pakistan Remittances 2026: How Overseas Workers Support the Economy

Can Pakistan Reach $34 Billion in Exports? The Real Barriers and Fastest Fixes

Why Pakistan’s Inflation Is Still Near 10% Despite Economic Stabilisation

Holiday Airfare 2026: Why Flights Cost More & Fares

California Prop 40 Explained: The 2026 Billionaire Wealth Tax Ballot Measure

US–Iran Conflict in October 2026: Hormuz, Oil Prices and Diplomacy

Crude Oil & Petroleum Market Analysis: OPEC+ Decisions and Price Forecasts

World’s Largest Economies: Ranking the Top Global Powers

Pakistan Economy 2026: Inside the SBP’s Balancing Act

Asian Stock Markets 2026: Japan, China, Pakistan & More

Silver Price Today: Why the Xi-Trump AI Standoff Is Fueling a Safe-Haven Rally

SpaceX IPO 2026: History’s Biggest Stock Debut?

Oil Prices 2026: Inside the Hormuz Crisis That Won’t End

Algorithmic Dogfights: Why the U.S. and China Must Establish Rules of Engagement for Autonomous Air Power

IMF Reports 2026: What the Latest Data Means for the Global Economy

Top US Convenience Store Chains: Store Counts, EV Charging, and Sales Trends

Business Insurance: What Coverage You Actually Need and What It Costs in 2026

Who Is Shivon Zilis? The Neuralink Executive at the Center of the Musk–OpenAI Trial

Is AI a Stock Bubble in 2026? What the Data Shows

Corporate America Faces a New Debt Test as US Borrowing Costs Surge
-

 Markets & Finance10 months ago
Top 15 Stocks for Investment in 2026 in PSX: Your Complete Guide to Pakistan’s Best Investment Opportunities
-

 Analysis8 months ago
Johor’s Investment Boom: The Hidden Costs Behind Malaysia’s Most Ambitious Economic Surge
-

 Analysis8 months ago
Top 10 Stocks for Investment in PSX for Quick Returns in 2026
-

 Banks9 months ago
Best Investments in Pakistan 2026: Top 10 Low-Price Shares and Long-Term Picks for the PSX
-

 Analysis9 months ago
Brazil’s Rare Earth Race: US, EU, and China Compete for Critical Minerals as Tensions Rise
-

 Investment9 months ago
Top 10 Mutual Fund Managers in Pakistan for Investment in 2026: A Comprehensive Guide for Optimal Returns
-

 Global Economy10 months ago
15 Most Lucrative Sectors for Investment in Pakistan: A 2025 Data-Driven Analysis
-

 Global Economy10 months ago
Pakistan’s Export Goldmine: 10 Game-Changing Markets Where Pakistani Businesses Are Winning Big in 2025