
Analysis
US-China Semiconductor War 2026: Bifurcation, Tungsten Shock, and the Race for AI Chips

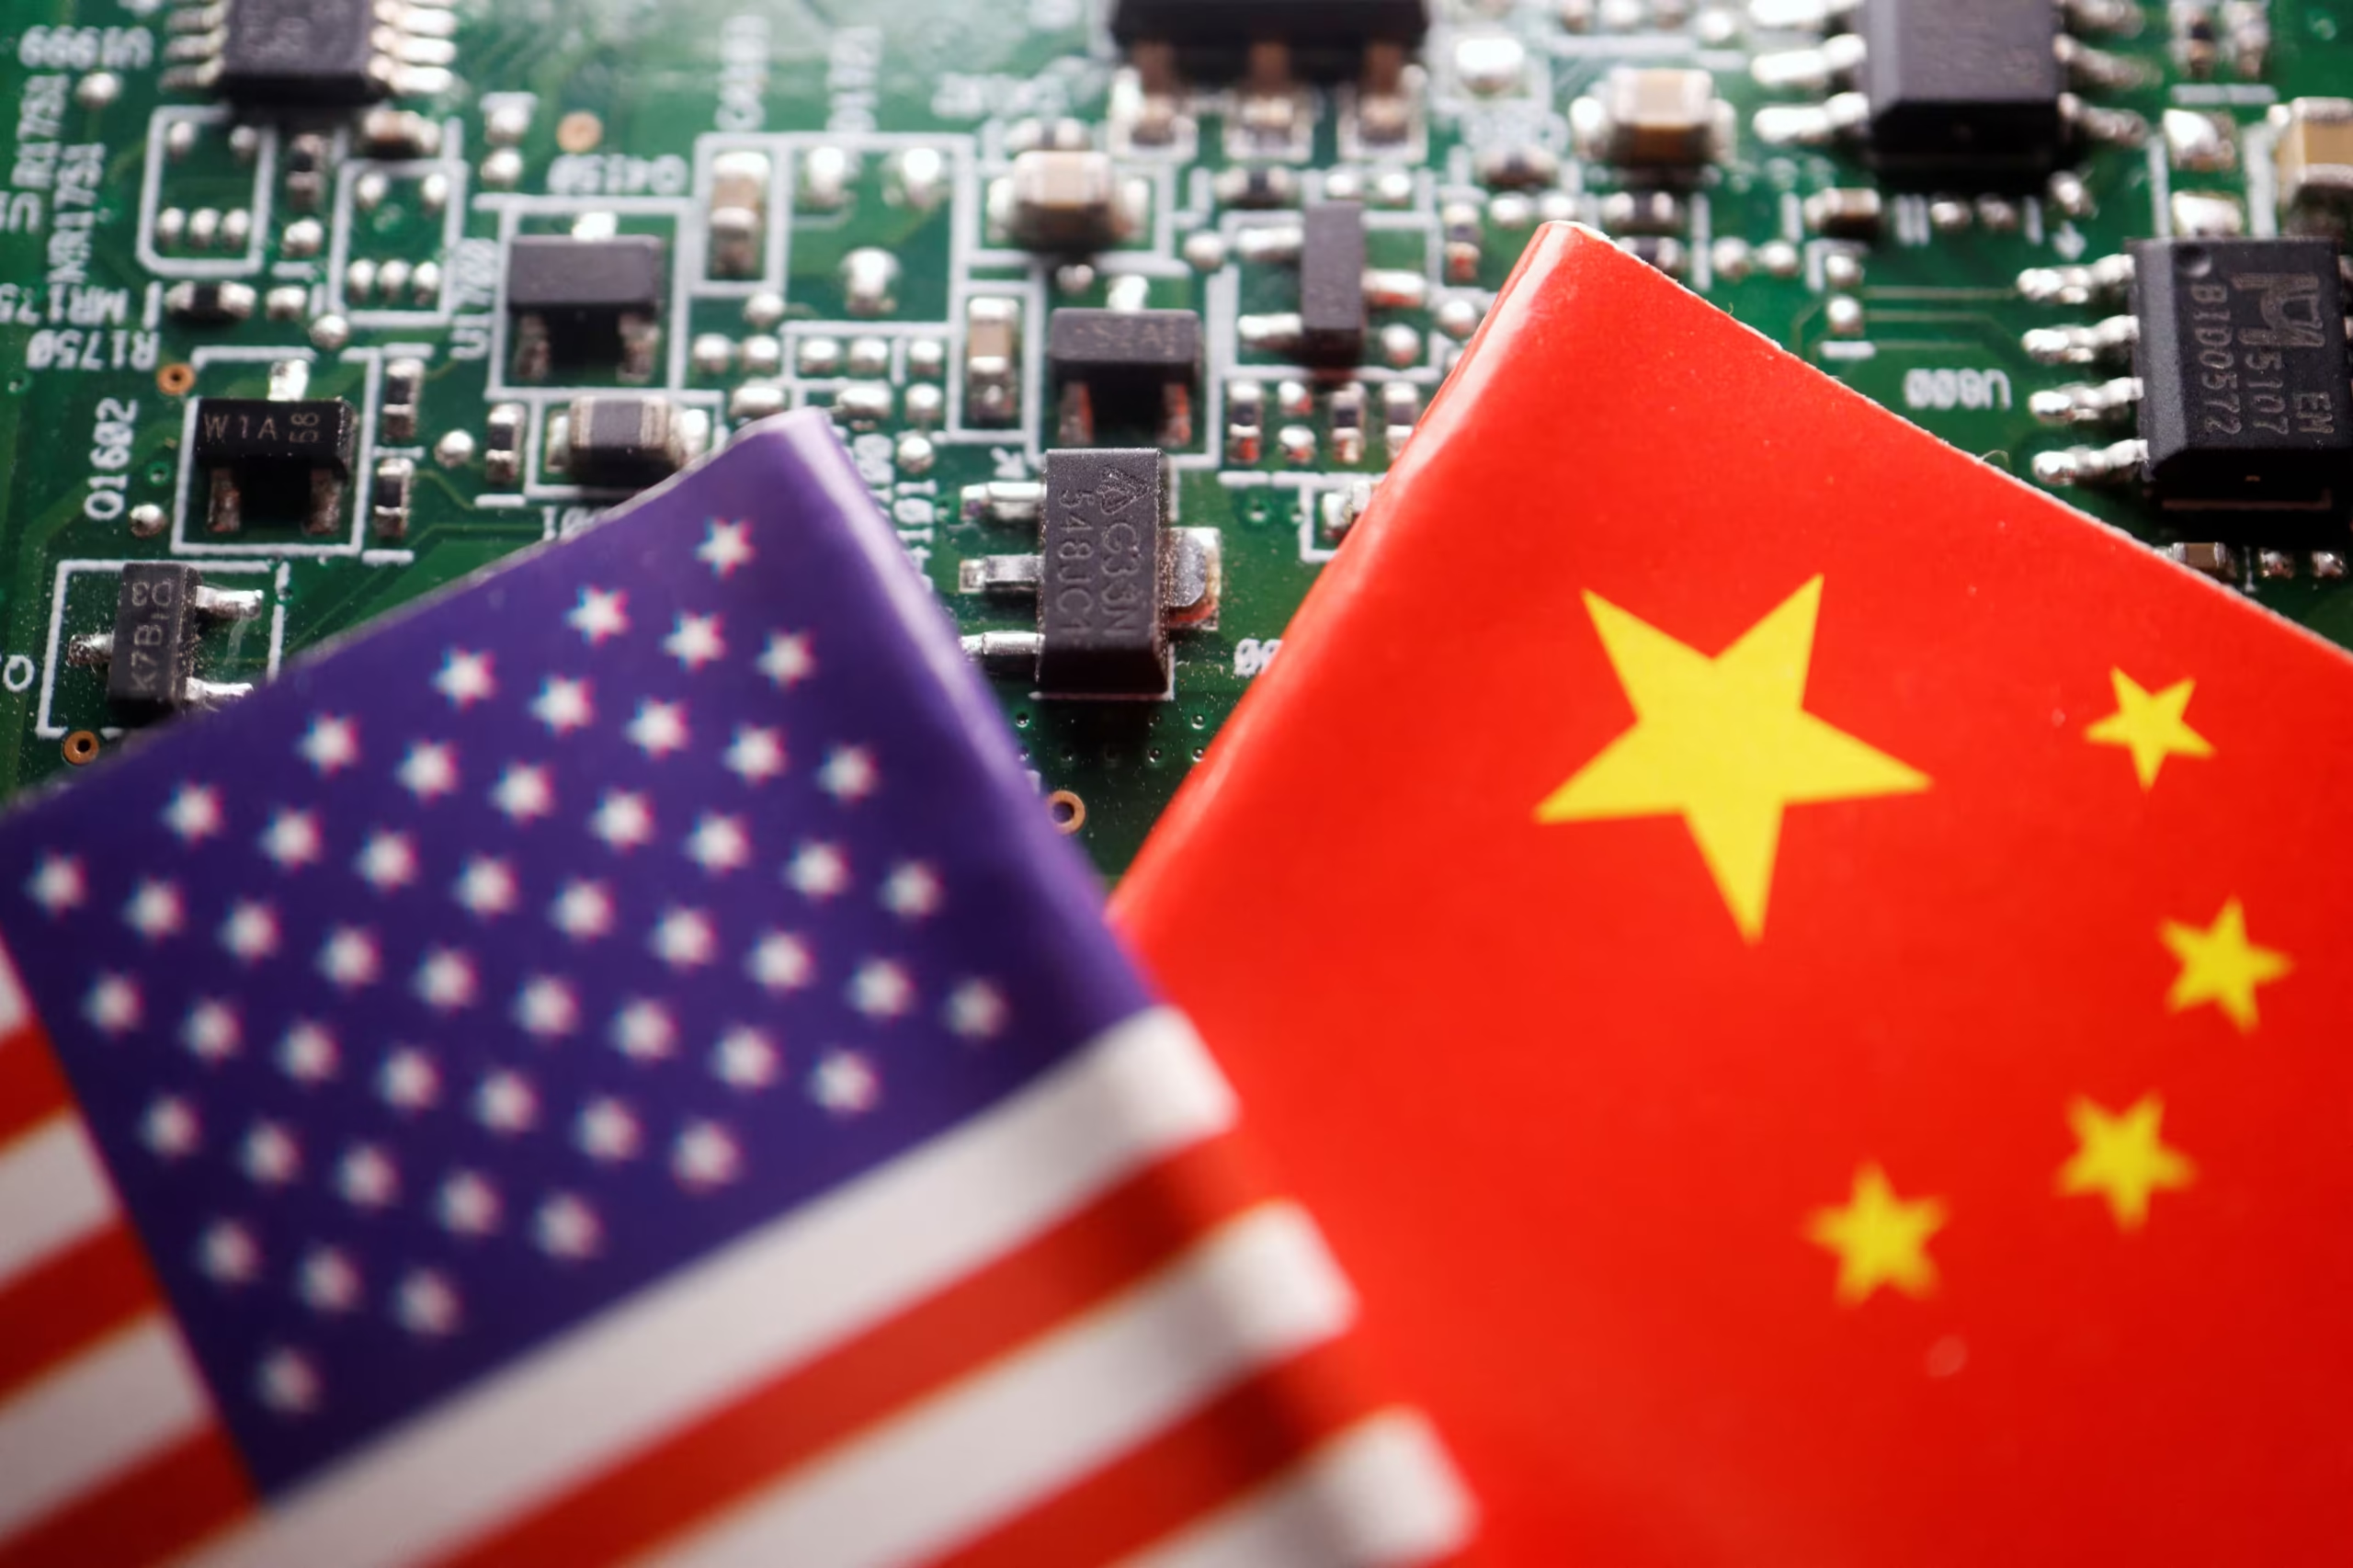
China’s domestic chip ecosystem is accelerating even as US export controls tighten. With tungsten up 557% and Nvidia’s China share halving, we map the permanent splitting of the global semiconductor supply chain.The global semiconductor supply chain is bifurcating. This statement was contested in 2023, hedged in 2024, and is now — as of 2026 — treated as a structural baseline by supply chain strategists, chipmakers, and government planners on both sides of the Pacific. The question has shifted from whether the split will happen to how deep and permanent it will become.
The evidence is visible in multiple datasets simultaneously. Nvidia, which once commanded over 90% of the Chinese AI chip market, had seen that share decline to approximately 50% by early 2026 — not because US export controls had successfully denied China access to capable chips, but because the combination of tariffs, “buy local” mandates, and regulatory uncertainty had accelerated Chinese enterprises’ migration to domestic alternatives. Meanwhile, China’s semiconductor output surged 87% year-on-year in May 2026, underscoring that domestic production capacity was advancing at a pace that few had forecast five years ago.
The Tungsten Shock: A Materials Leverage Beijing Chose to Use
In February 2026, China added tungsten to its export control list as trade tensions with the United States escalated. The consequence was rapid and severe. Tungsten prices rose 557% in just over a year — outperforming gains in gold, copper, and oil by a wide margin. Chinese exports of restricted tungsten products fell approximately 40% in 2025. The strategic logic was precise: China controls roughly 79% of global tungsten mine production, and tungsten’s exceptionally high melting point and density make it an essential input for chipmaking — both in chips themselves and in multiple fabrication processes at advanced nodes.
The move demonstrated that materials leverage extends far beyond rare earths. For semiconductor supply chains already under AI-driven demand stress, the tungsten shock added a new category of critical bottleneck that western efforts to build alternative supply chains cannot resolve in the near term.
Nvidia’s Paradox: Export Controls and the H200 Restart
The Nvidia-China relationship in 2026 illustrates the inherent contradiction of export controls applied to commercially motivated technology companies. After a roughly ten-month freeze on advanced chip exports to China — during which Nvidia absorbed a $5.5 billion charge tied to stranded inventory — a December arrangement allowed H200 sales to approved Chinese customers, with the US government taking a 25% cut of revenues. The arrangement normalised commerce while creating a fiscal mechanism for the US government.
Chinese tech firms collectively placed orders for more than two million H200 units for 2026 delivery — a volume that simultaneously demonstrates unmet demand and the limits of export control effectiveness. Where legal channels are closed, demand finds other pathways: a DOJ indictment unsealed in 2026 detailed a scheme involving approximately $2.5 billion in Supermicro servers containing restricted Nvidia GPUs being smuggled to Chinese buyers.
China’s Domestic Progress: Real but Incomplete
China’s semiconductor self-sufficiency ambitions are advancing, but the trajectory is uneven across subsectors. SMIC and Hua Hong have made genuine progress at mature nodes. Equipment vendors Naura and AMEC are gaining market share globally. The country’s AI chip domestic alternatives — while not yet matching Nvidia’s leading-edge capability — are advancing at an accelerating pace under the pressure of necessity.
The critical constraint remains high-bandwidth memory. CXMT, China’s domestic HBM producer, is targeting viable HBM3 yields in 2026 and HBM3E by 2027. If those milestones are achieved on schedule, Nvidia’s current China advantage — which exists precisely because China’s domestic HBM production remains constrained — will narrow materially. The competitive window is real but finite.
The Strategic Implication: Permanent Bifurcation as Business Baseline
For supply chain strategists, the most consequential shift is not any individual export control or price spike — it is the recognition that the global semiconductor supply chain’s bifurcation is permanent. Semiconductor leaders navigating this environment most effectively are treating the US-China bifurcation as a structural feature of the landscape, not a temporary disruption awaiting resolution.
This means conducting detailed audits of supplier dependencies, stress-testing revenue models against scenarios where China access is restricted or structurally changed, and tracking China’s domestic chip progress as a competitive variable rather than a geopolitical curiosity. Revenue projections that assume stable China market access now carry geopolitical risk that most financial models have not historically priced.
The age of a single, integrated global semiconductor supply chain is over. The question is how many chains will replace it, and at what cost.
Discover more from The Economy
Subscribe to get the latest posts sent to your email.



Pakistan closed out July 2026 with two of its strongest economic signals in years — even as the underlying trade picture tells a more cautious story. Workers’ remittances hit $3.6 billion in July, up 13% year-on-year, the State Bank of Pakistan confirmed on Monday, August 10 (The Nation). Meanwhile, the benchmark KSE-100 index has delivered one of its strongest runs in the region.
Remittances: A Record Year, Confirmed
July’s $3.6 billion inflow marked a 4.5% increase over June, continuing a pattern that has defined Pakistan’s external accounts throughout FY2026. According to the Ministry of Finance’s monthly economic outlook, cited by the Express Tribune, workers’ remittances rose to $41.6 billion for the full FY2025-26, up 8.6% from $38.3 billion the previous year (Express Tribune). Saudi Arabia and the UAE remain the dominant sources, together accounting for close to half of total inflows, according to earlier-year tracking from Pakistan & Gulf Economist, alongside notably strong growth from the UK and EU corridors.
The KSE-100’s Extraordinary Run
Pakistan’s stock market has been the standout story of FY2026. The benchmark KSE-100 index surged 27.6% year-on-year to 176,042 points by July 29, 2026, with market capitalisation rising 19.4% in rupee terms and 21.6% in dollar terms, according to the Ministry of Finance’s own reporting (Express Tribune). That kind of rally, sustained over a full fiscal year, places Pakistan’s equity market among the best performers globally for the period — a striking outcome for an economy still working through an active IMF program.
The Trade Picture Is Less Flattering
The same Ministry of Finance report is candid about where the pressure points remain. Exports declined to $30.8 billion for FY2025-26, down from $32.3 billion the prior year, while imports rose sharply to $64.5 billion from $59.1 billion. Foreign direct investment fell to $1.64 billion from $2.48 billion, and portfolio investment remained negative for the year.
Despite that widening trade gap, Pakistan’s current account deficit was contained to just $139 million for the full fiscal year — a remarkably narrow figure that the finance ministry credits directly to record remittance inflows. Foreign exchange reserves reached $22.7 billion by mid-July 2026, and the rupee actually appreciated slightly to Rs277.80 against the dollar, compared with Rs283.05 a year earlier. Inflation averaged 7.1% across FY2026, staying within the government’s target band despite elevated global oil prices.
The IMF Backdrop
Pakistan’s macroeconomic stabilization continues under the IMF’s Extended Fund Facility. The Fund’s most recent review found fiscal performance “strong,” with a primary surplus of 1.6% of GDP expected for FY26, in line with program targets, while gross reserves climbed to $16 billion by end-2025 from $14.5 billion six months earlier (IMF). A separate 28-month Resilience and Sustainability Facility arrangement, approved in May 2025, continues supporting Pakistan’s climate and disaster-resilience reforms.
The Risk the Ministry Itself Flagged
Pakistan’s own finance ministry has been unusually direct about the fragility beneath these headline numbers, warning that renewed escalation between the United States and Iran could trigger volatility in global energy prices, trade flows, and financial markets — risks that could disrupt Pakistan’s improving trajectory given the country’s continued exposure to Gulf labor markets and energy import costs (Express Tribune).
The Bottom Line
Pakistan’s FY2026 story is genuinely two-sided: a stock market and remittance base performing better than almost anyone forecast a year ago, financing a current account that has stayed remarkably close to balance — set against an export sector that continues to shrink and a foreign direct investment picture that remains stubbornly weak. Whether the KSE-100 rally and remittance strength can persist long enough for structural export reform to catch up remains the defining question for Pakistan’s economy heading into FY2027.
How much did Pakistan’s remittances grow in July 2026?
Pakistan’s remittances reached $3.6 billion in July 2026, up 13% year-on-year, while the KSE-100 stock index surged 27.6% year-on-year to 176,042 points by late July.
Discover more from The Economy
Subscribe to get the latest posts sent to your email.
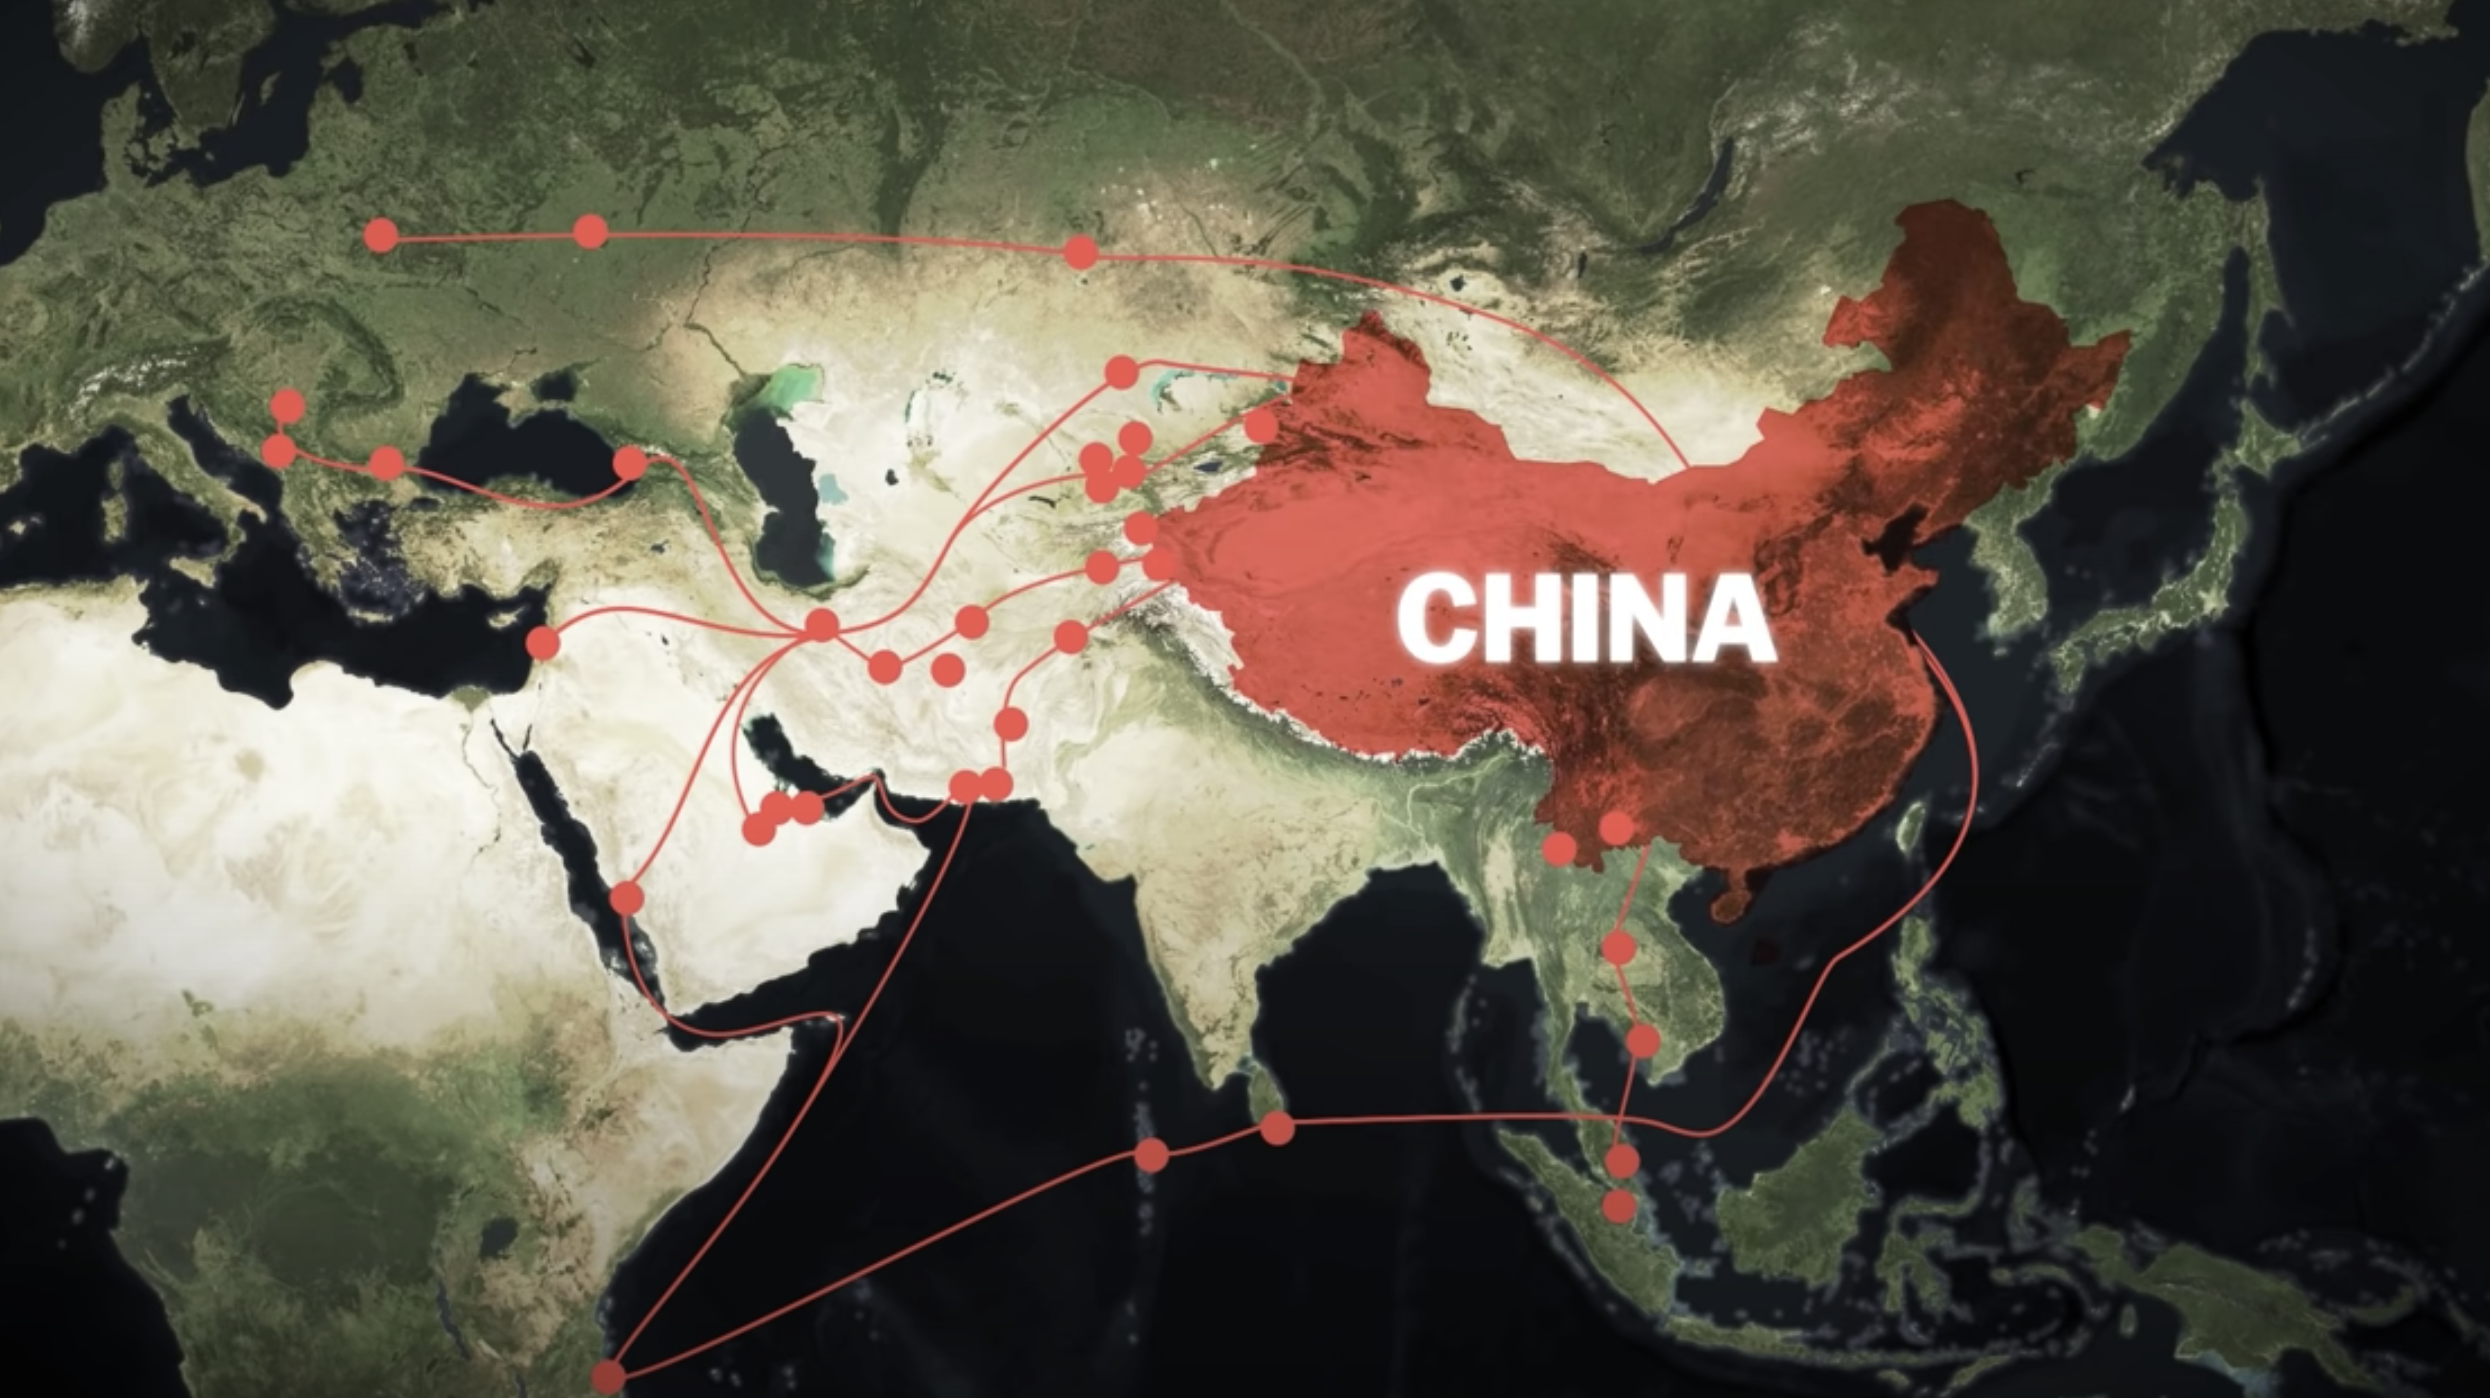
China’s foreign goods trade maintained strong momentum through the first seven months of 2026, with total import-export value reaching 30.13 trillion yuan ($4.46 trillion), up 17.3% year-on-year, according to General Administration of Customs data released Friday, August 7 (CGTN).
Imports Are Outgrowing Exports — A Notable Reversal
The headline figure obscures a more interesting shift beneath it. Exports rose 14% to 17.44 trillion yuan, while imports climbed a faster 22% to 12.69 trillion yuan — meaning import growth has been outpacing export growth, according to the same customs data. That’s a meaningful departure from the pattern that dominated Chinese trade data through much of the mid-2020s, when policymakers leaned heavily on export-led growth while domestic demand lagged.
Mechanical and electrical products remain China’s dominant export category, totaling 11.12 trillion yuan and growing 21.2% — now accounting for 63.8% of China’s total exports, underscoring how central advanced manufacturing and electronics remain to the country’s trade profile.
Where the Growth Is Coming From
China’s trade diversification strategy continues to show measurable results. Trade with ASEAN grew 20% in the first seven months of the year, trade with the EU rose 9.5%, Latin America climbed 15.4%, and Africa grew 18.9%. Trade with Belt and Road Initiative partner countries reached 15.36 trillion yuan, up 15.5%, while trade with other APEC economies hit 18.03 trillion yuan, up 21% (CGTN).
This diversification has been years in the making, accelerated by tariff pressure from Washington. Trading Economics data from earlier in 2026 showed Chinese exports to the U.S. declining even as overall export volumes hit record highs, as manufacturers redirected shipments toward Southeast Asia, Africa, and Latin America to offset the impact of U.S. tariffs (Trading Economics).
A Growth Target Built on Trade Strength
The strong trade numbers are consistent with the trajectory Premier Li Qiang set out earlier in the year, when Beijing targeted 4.5%–5% GDP growth for 2026, down modestly from the prior year’s target, which itself was met largely through a roughly one-fifth surge in China’s trade surplus. Economists have been skeptical that Beijing will pivot away from export dependence any time soon, noting that recent policy documents pledged a “notable” increase in household consumption without offering many concrete mechanisms to deliver it (Investing.com/Reuters).
The US-China Undercurrent
Trade tensions with Washington remain an active backdrop rather than a resolved issue. The South China Morning Post’s ongoing coverage notes Beijing has launched an investigation into imported printers and photocopiers that use foreign-developed software, a direct response to the latest round of U.S. sanctions — illustrating how the trade relationship continues to generate tit-for-tat regulatory measures even as overall Chinese trade volumes with the rest of the world climb (SCMP).
Why the Import Surge Matters
A 22% jump in imports against 14% export growth is a data point worth watching closely for anyone tracking global demand signals. Stronger Chinese imports typically translate into higher demand for commodities, industrial inputs, and consumer goods from trading partners — a potentially supportive signal for economies like Indonesia, Malaysia, and Australia that count China as a top trading partner. Whether this reflects a genuine, durable shift toward domestic consumption-led growth, or simply reflects higher commodity prices flowing through import values, will become clearer as full-year 2026 data consolidates.
How much did China’s trade grow in 2026?
China’s total goods trade reached 30.13 trillion yuan ($4.46 trillion) in the first seven months of 2026, up 17.3% year-on-year, with imports (+22%) growing faster than exports (+14%) for the period.
Discover more from The Economy
Subscribe to get the latest posts sent to your email.

Malaysia’s economy expanded 5.8% year-on-year in the second quarter of 2026, accelerating from 5.4% in the first quarter, according to preliminary estimates from the Department of Statistics Malaysia — a pace that has caught even optimistic forecasters off guard (Trading Economics).
What Drove the Acceleration
Chief Statistician Datuk Seri Dr. Mohd Uzir Mahidin attributed the strength to resilient domestic demand and broad-based improvement across productive sectors. The sectoral breakdown shows where the momentum concentrated: mining and quarrying rebounded sharply to 10.2% growth (from -2.1% in Q1), driven by higher natural gas production, while manufacturing accelerated to 7.5% (from 5.9%), supported by increased output of electrical, electronic, and optical products alongside petroleum and chemical goods (Trading Economics).
Services growth eased slightly to 5.4% from 5.6%, and construction moderated to 6.6% from 7.0%, while agriculture contracted 3.7% amid weaker oil palm and fishing output. For the first half of 2026 overall, Malaysia’s economy grew 5.6%, well above the 4.5% pace recorded in the same period a year earlier.
The Data Centre Effect
The through-line across nearly every recent Malaysia growth story is the same: artificial intelligence infrastructure. The IMF’s July 2026 World Economic Outlook Update kept Malaysia’s full-year GDP forecast unchanged at 4.7%, naming the country — alongside South Korea, Taiwan, and Thailand — as one of Asia’s top net exporters of AI-related hardware (W.Media).
The OECD’s 2026 Economic Survey of Malaysia echoes the point, noting that robust global demand for data centres and AI has buoyed the economy even through a temporary slowdown in early 2026, helping Malaysia post sizeable improvements in material living standards (OECD).
Malaysia’s finance ministry has credited the “Ekonomi MADANI” reform agenda for reinforcing this momentum, pointing to continued AI and data centre investment “supported by facilitative policies and a conducive investment environment,” alongside steady household spending buoyed by public-sector pay reforms and targeted cash assistance programs (Ministry of Finance Malaysia). Unemployment has fallen to 2.9%, the lowest in a decade.
Forecasts Are Playing Catch-Up
The Q2 beat is already forcing revisions. MBSB Investment Bank said it is reviewing its current 4.5% full-year GDP forecast upward following the stronger-than-expected second-quarter print, citing continued strength in the manufacturing Purchasing Managers’ Index, which held at 50.7 in July — comfortably in expansion territory (The Star). Rising tourist arrivals are also expected to support consumption through the second half of the year.
The Risk Still on the Table
None of this insulates Malaysia entirely from external shocks. The OECD survey flags that soaring global energy prices and disruptions in commodity supply chains — largely a function of the ongoing Middle East conflict — remain key vulnerabilities, and recommends Malaysia step up fiscal consolidation, including reducing fossil fuel subsidies and reintroducing a broader value-added tax, while protecting low-income households through targeted transfers.
The finance ministry itself has acknowledged the risk directly, noting that a prolonged West Asia conflict could disrupt global supply chains through higher energy, logistics, and input costs — pressures serious enough that Putrajaya has formalized a crisis management task force under the National Economic Action Council to monitor developments and coordinate real-time policy responses.
Bottom Line
Malaysia’s Q2 number is one of the clearest examples yet of how the AI infrastructure buildout is reshaping growth trajectories across export-oriented Southeast Asian economies. The question for the second half of 2026 is whether that momentum can offset the same energy and supply-chain risks that are complicating growth stories from Jakarta to Singapore.
How fast did Malaysia’s economy grow in Q2 2026?
Malaysia’s GDP grew 5.8% year-on-year in Q2 2026, up from 5.4% in Q1, driven by a rebound in mining, accelerating manufacturing, and sustained data centre and AI-related investment.
Discover more from The Economy
Subscribe to get the latest posts sent to your email.

PPI Report Shocks Wall Street as Fuel Costs Squeeze America

Pakistan’s Twin Engines: Remittances and Stock Market Surge

China’s Trade Surges to $4.46 Trillion — the Real Story

US Inflation Cools to 3.4% in July, Clearing the Runway for a September Fed Cut

UK Inflation Set to Peak Near 3.2% as Bank of England Holds the Line at 3.75%

Malaysia’s Growth Accelerates to 5.8% as Data Centre Boom Defies Global Uncertainty

Indonesia’s Economy Beats Forecasts — But Investors Aren’t Celebrating Yet

US Senate Passes Sweeping Russia Sanctions Bill, Threatening 100% Tariffs on Oil Buyers

Singapore Doubles Down on Growth as AI Capex Rewrites the Forecast

Canada-US Tariff Deadline: Inside the 50% Levy Standoff Before Aug 19

Russia’s War Economy Got a Reprieve From Iran

China’s Economy Has a Structural Problem: Factories Are Winning, Households Are Losing

How Malaysia “Shrugged Off” Trump’s Tariffs — and What Comes Next

Singapore’s AI Boom Is Now a Two-Country Story

China Politburo July 2026: Stimulus Signals Explained

Down But Not Out: Inside the Slow Sinking of Russia’s War Economy

Gulf Capital Retreat From Pakistan 2026: UAE Loan Freeze & What It Means

Russia Fuel Shortages 2026: Inside a Cracking War Economy

Top 15 Financial Stocks for Investment in PSX

Strait of Hormuz Crisis 2026: How Trump’s Toll U-Turn Exposes Global Economic Risk

Pakistan’s Economic Growth: Resilience Amid Challenges

Andy Burnham, UK Gilts and Mortgages: July 2026 Explainer

Fed Chair Kevin Warsh’s AI Rate Bet 2026: Inside the FOMC Split on Productivity vs Inflation

Pakistan Economy 2026: IMF Growth Warning vs. a Booming KSE-100

Anthropic’s Trillion-Dollar Race: Inside the Path to an October 2026 IPO

Pakistan Passed Its Third IMF Review

Gold Price 2026: How Central Banks Made Gold Bigger Than US Treasuries in Reserves

SpaceX Stock Lockup Expiration Explained: Why $123B in Shares Could Hit the Market
-

 Markets & Finance7 months ago
Top 15 Stocks for Investment in 2026 in PSX: Your Complete Guide to Pakistan’s Best Investment Opportunities
-

 Analysis6 months ago
Johor’s Investment Boom: The Hidden Costs Behind Malaysia’s Most Ambitious Economic Surge
-

 Analysis6 months ago
Top 10 Stocks for Investment in PSX for Quick Returns in 2026
-

 Analysis6 months ago
Brazil’s Rare Earth Race: US, EU, and China Compete for Critical Minerals as Tensions Rise
-

 Banks7 months ago
Best Investments in Pakistan 2026: Top 10 Low-Price Shares and Long-Term Picks for the PSX
-

 Investment7 months ago
Top 10 Mutual Fund Managers in Pakistan for Investment in 2026: A Comprehensive Guide for Optimal Returns
-

 Global Economy8 months ago
15 Most Lucrative Sectors for Investment in Pakistan: A 2025 Data-Driven Analysis
-

 Global Economy8 months ago
Pakistan’s Export Goldmine: 10 Game-Changing Markets Where Pakistani Businesses Are Winning Big in 2025