
Analysis
Why Trump’s Iran Timeline Is Reshaping Currency Markets

As safe-haven demand unwinds, the yen’s recovery from 160.46 tests the BOJ’s resolve and exposes a market desperate for clarity.
When President Donald Trump told reporters on April 1, 2026, that the U.S. military campaign against Iran could conclude “within two to three weeks,” he did something that months of tanker attacks and escalating airstrikes had failed to accomplish: he forced currency markets to reprice geopolitical risk in real time . Within hours, the Japanese yen had clawed its way back from this year’s low of 160.46 per dollar, the dollar index slipped to a one-week trough, and traders began unwinding the very safe-haven positions they had built since late February .
Here’s the uncomfortable truth that the wire-service headlines missed: the dollar stable after Trump Iran statement narrative is not a story about peace breaking out. It is a story about markets probabilistically trading a conflict window that hasn’t yet closed—and about the Federal Reserve, the Bank of Japan, and global investors navigating a landscape where a single presidential utterance can do more to move asset prices than weeks of diplomatic back-channeling.
This is the new normal. And for anyone holding yen, dollars, or exposure to emerging markets, understanding what happens next requires looking beyond the headline to the structural forces—oil, interest rates, and intervention risk—now colliding beneath the surface.
1: The Immediate Market Reaction—A Tale of Two Forces
By mid-morning Tokyo time on April 1, the market had absorbed Trump’s remarks alongside conflicting signals from Pentagon officials. The result was a currency market caught between relief and residual fear.
The dollar initially gave up some of its safe-haven premium, with the dollar index easing 0.03% to 99.70 as the euro climbed to $1.1576, its highest in more than a week . But the greenback did not collapse. As of the latest data, USD/JPY was trading near 158.55, a notable recovery from the 160.46 low recorded earlier this year, yet still historically elevated .
What explains the dollar’s relative stability? Three factors.
First, the U.S. remains a net energy exporter—a structural advantage that makes it more resilient to oil price shocks than import-dependent economies like Japan or the eurozone . Second, despite the relief rally, no formal ceasefire agreement exists. Defense Secretary Pete Hegseth simultaneously warned that “the next few days…would be decisive” and that conflict could intensify absent a deal . Third, and most critically, the market has not yet decided whether Trump’s timeline is credible or merely aspirational.
Kyle Rodda, senior market analyst at Capital.com, captured this tension perfectly: “While the headlines were worth a bit of a jump in risk assets, the state of the war and its impact on fundamentals haven’t materially changed yet and the overnight moves are liable to quickly reverse” .
In other words, April 1 was not a trend reversal. It was a pause—a moment of recalibration—with the dollar still supported by the possibility that the conflict could, in fact, drag on.
2: Geopolitical Context—Markets Trading a “Two-Week War”
What makes this moment distinct from previous Middle East flare-ups is the speed with which markets have incorporated a defined timeline into pricing. As Nigel Green, CEO of the deVere Group, put it: “Markets are, effectively, now trading a two- or three-week war scenario based on Trump’s latest comments” .
This is not merely semantic. It represents a fundamental shift in how geopolitical risk is being priced across asset classes.
Consider oil. Brent crude had spiked toward $119 per barrel amid fears of a prolonged conflict and potential Strait of Hormuz disruption. Following Trump’s remarks, it fell back toward $105—a move that has already begun feeding into inflation expectations and, by extension, interest rate projections . The S&P 500 futures extended gains, and Asian markets rallied, with South Korea’s Kospi jumping more than 6% .
Yet historical parallels suggest caution. The 2019–2020 tanker war in the Strait of Hormuz saw multiple escalatory cycles, each followed by temporary de-escalation headlines that failed to produce lasting stability. More recently, the 2022 Ukraine shock demonstrated how quickly geopolitical timelines can slip once conflict becomes entrenched.
The market is now pricing de-escalation faster than diplomacy can deliver. That gap—between market expectation and political reality—is where volatility lives.
3: Yen-Specific Analysis—Why 160.46 Was the Breaking Point
For Japan, the yen recovery 160 narrative is about more than just a currency rebound. The level 160.46 USD/JPY represented a psychological and policy red line—one that Japanese authorities had signaled they would not allow to be crossed without action.
The BOJ intervention risk yen recovery dynamic has been building for weeks. Japan’s top currency diplomat recently warned that officials could take “decisive” action—language markets interpret as a precursor to actual yen-buying intervention . Governor Kazuo Ueda has also stressed that currency movements now have a more pronounced impact on inflation than in the past, keeping the door open to further rate hikes .
Here’s what changed on April 1: as safe-haven demand faded, the yen strengthened without BOJ intervention. That matters because it suggests the market itself—not just official action—is beginning to reprice yen downside risks. Sho Suzuki, market analyst at Matsui Securities, noted that “the reversal of the long-running ‘buy dollars, sell yen’ trade is likely to continue” .
But he added a critical caveat: the move has not yet become a one-way shift, because concerns about the conflict linger.
For carry-trade investors, this is a moment of reckoning. The yen has been the world’s preeminent funding currency for years, with investors borrowing cheaply in yen to buy higher-yielding assets. A sustained yen recovery would unwind those positions—potentially amplifying the move. The Bank of Japan’s March Tankan survey showed improving business sentiment, but firms expect conditions to worsen in the coming months, underscoring the fragility of the domestic recovery .
4: Broader Macro & Investor Implications
Beyond the dollar-yen cross, the Trump Iran signal is reverberating across global markets in ways that demand portfolio rethinking.
The Federal Reserve is the elephant in the room. Markets had largely priced out rate cuts for 2026 as rising oil prices stoked inflation concerns. But if the conflict de-escalates and crude continues to pull back, inflation expectations ease—and the Fed regains flexibility. Friday’s jobs report will be pivotal: economists expect 60,000 new jobs in March, a rebound from February’s unexpected 92,000 loss . A sharp deterioration would revive rate-cut bets and pressure the dollar.
Oil remains the transmission mechanism. The Wall Street Journal reported that the United Arab Emirates is preparing to help the U.S. and allies force open the Strait of Hormuz if necessary . That would be a game-changer, but it also carries escalation risks. Energy-importing emerging markets—particularly in Asia—stand to benefit most from lower oil prices, while oil exporters face a double whammy of lower prices and reduced geopolitical risk premiums.
Portfolio implications: Investors should consider three adjustments.
- Reduce safe-haven dollar overweights if the conflict timeline holds, but maintain hedges given the fragility of the ceasefire narrative.
- Reassess yen exposure—the 160 level appears to be a policy floor, whether enforced by the market or the BOJ.
- Monitor carry-trade unwinding as a potential source of volatility, particularly in higher-yielding emerging market currencies.
5: Outlook & My Expert Opinion—Three Scenarios for the Next 3–6 Months
Over the next six months, the path for USD/JPY and global currency markets will be determined by the interplay of three variables: the conflict’s duration, the Fed’s reaction function, and BOJ policy.
| Scenario | Probability | USD/JPY Outlook | Key Drivers |
|---|---|---|---|
| Controlled De-escalation | 45% | 155–160 | Trump’s timeline holds; oil stabilizes near $100; Fed on hold; BOJ hikes once |
| Prolonged Conflict | 35% | 160–165 | Timeline slips; oil spikes to $120+; safe-haven dollar strength resumes; BOJ intervention |
| Disorderly Intervention | 20% | 145–155 | BOJ forced to act decisively; coordinated intervention; Fed cuts surprise |
My view: the market is currently overweighting Scenario 1 and underweighting Scenario 2. Trump’s “two- to three-week” timeline is plausible, but the underlying issues—Strait of Hormuz access, Iranian nuclear ambitions, regional power dynamics—are not resolvable in that timeframe. Markets that have aggressively priced de-escalation are vulnerable to a sharp reversal if headlines turn negative.
The most likely outcome is a choppy range for USD/JPY between 155 and 160, with episodic spikes higher on conflict headlines and lower on intervention fears. Investors should treat the current dollar stability not as an all-clear signal, but as a reprieve to reposition.
Conclusion: The Currency Market’s New Reality
When a single presidential statement can move the yen from 160.46 to 158.55 in hours, we are witnessing something profound. The traditional separation between geopolitics and currency markets has collapsed. Every trader, every portfolio manager, every corporate treasurer now operates in a world where policy pronouncements carry the weight of central bank action.
For the dollar, stability is not strength—it is a measure of the market’s uncertainty about whether the war ends in weeks or months. For the yen, the recovery from 160 is a reminder that even the most oversold currencies have floors when policy credibility is on the line.
And for investors, the lesson is simple: in a market trading on a “two-week war” timeline, the greatest risk is not the headline you see—it is the timeline you assume.
Discover more from The Economy
Subscribe to get the latest posts sent to your email.


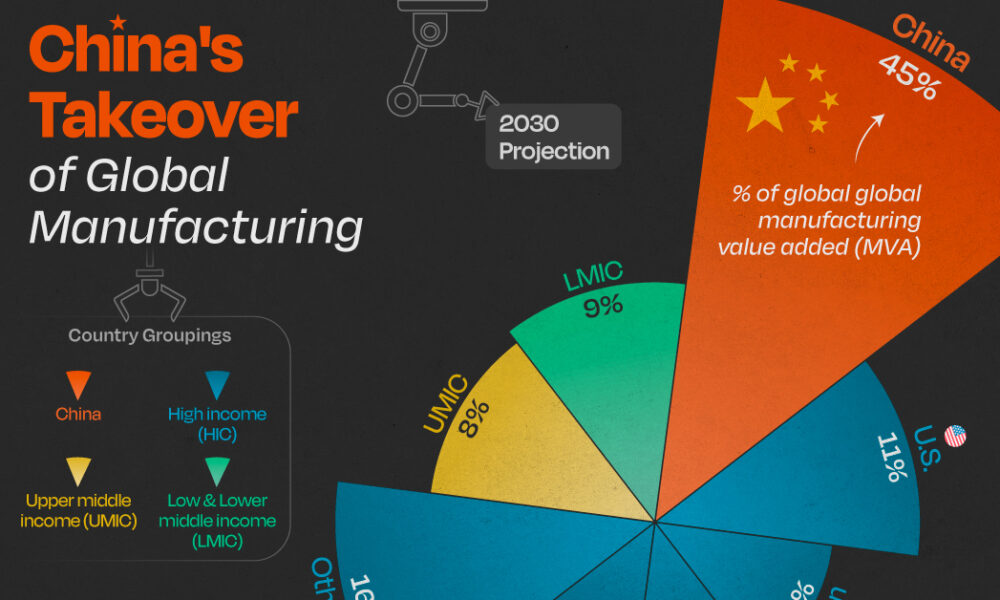
China’s exports have been the good-news story in an otherwise mixed economic picture. They’re not just holding up; through the first four months of 2026 they were running about 14% to 15% above the same period a year earlier, according to figures cited by the US-China Economic and Security Review Commission and Vanguard’s economic outlook. That’s the kind of number that would normally signal a healthy economy. The complication is what’s happening underneath it.
A growth model showing its age
Manufacturing capacity utilization fell to 73.9% in early 2026 — near a decade low outside of the pandemic shutdowns, per the Commission’s bulletin. That’s the tell. China is producing and shipping more, but a growing share of its industrial base is running under capacity, which points to a structural mismatch: the country’s manufacturing engine has outgrown both its domestic consumption and, increasingly, what the rest of the world is willing to absorb without pushback.
Goldman Sachs Research, in a report cited by Goldman Sachs’ own analysis, forecasts 4.8% real GDP growth for 2026 — above consensus expectations of 4.5% — driven substantially by continued export strength and a softening drag from the property downturn. But that same report flags the labor market as a genuine weak spot: hiring, measured across a weighted average of PMI employment sub-indexes, is at its most depressed level in a decade outside Covid, and urban nominal wage growth slowed to just 3.8% year-on-year in Q3 2025.
Why Beijing isn’t reaching for stimulus
Given the export strength, one might expect policymakers to feel less urgency about consumption-side stimulus. That’s roughly what’s happening — and it’s a deliberate choice, not an oversight. Xi Jinping’s government remains committed to dominating high-value manufacturing, which means comprehensive fiscal stimulus aimed at consumers remains unlikely even as domestic demand stays soft, according to the Commission’s bulletin.
The People’s Bank of China is expected to hold its policy rate steady through the rest of the year, preferring targeted structural tools over a broad-based rate cut, per Vanguard’s forecast. That’s a notably cautious stance given how weak the property sector remains — property investment indicators are down 50% to 80% from their 2020–21 peaks, and a “meaningful domestic-demand turnaround remains elusive,” in Vanguard’s own words.
The regulatory push to keep capital at home
Two moves by Chinese regulators in mid-2026 point to where Beijing’s real priority sits: keeping household savings and private capital funneled toward domestic industrial policy rather than flowing overseas. New rules taking effect July 1 restrict outbound investment that could be used to export restricted technology or expertise under the guise of ordinary capital flows, with violations carrying fines, visa restrictions and industry blacklisting, according to the Commission’s bulletin. The regulations follow Beijing’s move to block the founders of AI firm Manus from completing a sale to Meta, even after the company had relocated its headquarters from China to Singapore — a signal that Beijing is willing to reach across borders to keep promising tech assets tethered to domestic or Hong Kong listings.
The currency and trade angle
Goldman’s team makes an out-of-consensus call worth flagging: it expects China’s current account surplus to rise to 4.2% of GDP in 2026, up from 3.6% in 2025, while the broader analyst consensus surveyed by Bloomberg expects a decline to 2.5%. The divergence comes down to export resilience — falling export prices are making Chinese goods more competitive even as the yuan is expected to appreciate slightly, with export-price inflation in dollar terms forecast to turn positive, rising to 0.7% from -2.7% the prior year.
The bottom line
China’s economy in 2026 is a study in contrasts: robust headline export growth sitting on top of underutilized factories, a weak labor market, and a property sector still in its fifth year of decline. The World Bank’s own baseline, published in its country program materials, projects growth moderating toward 4.0% by 2026 — a more conservative read than Goldman’s. Either way, the consensus across forecasters is the same: exports are carrying more of China’s growth than is healthy for the long run, and Beijing’s policy choices this year suggest it’s betting on technological dominance to eventually solve the demand problem, rather than opening the stimulus taps to solve it directly.
Discover more from The Economy
Subscribe to get the latest posts sent to your email.
There’s a number that keeps showing up in every conversation about Pakistan’s economy, and it keeps getting bigger: circular debt. As of early July 2026, the gas sector’s share of that debt alone has topped Rs 3.44 trillion, and Islamabad has missed a deadline the IMF set for tariff reforms meant to arrest the slide, according to Dawn.
What circular debt actually is, and why it won’t go away
Circular debt is the chain of unpaid obligations that builds up when the price consumers pay for electricity or gas doesn’t cover what it actually costs to produce and deliver it. Someone in the chain — a power producer, a gas utility, a state-owned enterprise — ends up carrying an IOU, and that IOU gets passed down the line. Earlier this year, IMF officials pressed Pakistan on exactly this dynamic, questioning the government’s plan to zero out gas-sector circular debt, according to Aaj English. At the time, officials said around Rs 150 billion remained payable to companies including Oil and Gas Development Company Limited and Pakistan Petroleum Limited.
Islamabad’s proposed fix included a Rs 5-per-unit levy on gas, dividends from state-owned companies redirected toward debt reduction, and the sale of 35 LNG cargoes annually on the international market. The IMF, per that same reporting, raised pointed questions about whether the plan was actually viable.
The commitments Pakistan has already made
Under its Extended Fund Facility, Pakistan has committed to capping circular debt growth at Rs 300 billion for FY2027 and cutting power-sector subsidies from 0.7% of GDP to 0.6%, according to details reported by ProPakistani. The government has also shifted Nepra’s annual tariff-rebasing cycle from July to January, and Ogra now revises gas tariffs twice a year instead of once.
Structurally, some of this is working. The IMF’s own review in May 2026 credited Pakistan with a primary fiscal surplus of 1.6% of GDP for FY26, broadly in line with program targets, and noted gross reserves had climbed to $16 billion by end-December, up from $14.5 billion six months earlier, according to the IMF’s own press release. That progress unlocked roughly $1.1 billion under the EFF and $220 million under a parallel climate-resilience facility, bringing total disbursements under the two arrangements to about $4.8 billion.
Where the fault lines actually are
The uncomfortable part of this story, laid out by commentary reported in The Hans India, is that revenue targets get IMF scrutiny with great precision, while structural reform of loss-making public enterprises — Pakistan International Airlines and Pakistan Steel Mills chief among them — moves far more slowly. Those enterprises’ losses are absorbed by the national exchequer through subsidies, guarantees, and debt restructuring year after year, and privatization plans keep slipping because the political cost of confronting them is high.
Distribution company inefficiency compounds the problem. In FY25, Discos posted Rs 265 billion in losses, an improvement on FY24’s Rs 276 billion but still a substantial drag, according to Geo News, with Quetta, Peshawar and Hyderabad among the worst-performing utilities.
What happens if the pattern holds
Pakistan’s debt-to-GDP ratio sits between 70% and 80% as of 2026, according to Wikipedia’s economic summary, with debt servicing occasionally consuming two-thirds of government spending. That’s the backdrop against which every circular-debt conversation happens: there is very little fiscal room left to absorb another missed deadline.
The missed gas tariff deadline doesn’t automatically trigger a program breakdown — Pakistan has weathered similar friction points before during its current EFF arrangement. But with the IMF’s own documentation showing persistent concern about the credibility of debt-reduction plans, and with global energy prices still elevated in the aftermath of the Iran war, the margin for further slippage is thin. The next review will likely hinge less on the rhetoric around reform and more on whether the Rs 5 levy and LNG cargo sales actually show up in the numbers.
Discover more from The Economy
Subscribe to get the latest posts sent to your email.
Analysis
Malaysia Bets Its 2026 on “Execution” — And the Semiconductor Upcycle Is Doing the Heavy Lifting

Malaysia’s government has declared 2026 a year of “execution” and “discipline” as the Anwar Ibrahim administration races to deliver on the 13th Malaysia Plan (RMK13) ahead of elections that could come as early as February 2028, according to Fortune’s interview with economy minister Akmal Nasrullah Mohd Nasir.
A Strong Base to Build From
Malaysia’s economy grew 4.9% in 2025 following 5.1% growth the year before, with unemployment falling to 2.9% — the lowest in a decade — and the ringgit trading at its strongest level in five years. HSBC’s ASEAN economist Yun Liu forecasts 4.6% growth for 2026, citing strength in electrical equipment manufacturing, tourism, and sound government policy, while Nomura economists have projected an even more bullish 5.2%, pointing to infrastructure spending under RMK13.
The ASEAN+3 Macroeconomic Research Office (AMRO) projects growth moderating slightly to 4.6% from an estimated 4.9% in 2025, describing Malaysia’s performance as reflecting its “entrenched position in global semiconductor and electronics value chains” and the broader global tech upcycle, according to AMRO’s assessment of Malaysia’s investment upcycle.
Navigating Washington Without Picking Sides
Malaysia’s trade relationship with the US has been turbulent. Washington imposed 25% tariffs on Malaysian goods in April 2025, rattling the country’s export-led economy, before a deal reduced US duties to 19% in exchange for Malaysia lowering tariffs on select American products, with exemptions carved out for aviation components and electrical equipment. Malaysia’s trade hit a record high of more than 3 trillion ringgit (roughly $780 billion) last year despite the friction.
Deputy finance minister Liew Chin Tong has framed Malaysia’s positioning explicitly around neutrality: the country is “not China, not the US,” a stance he argues gives Malaysia a strategic advantage in both geopolitical and supply-chain terms, according to Fortune’s reporting from the Forum Ekonomi Malaysia summit.
Capital Is Flowing In — From Everywhere
Malaysia recorded 22.8 billion ringgit (about $5.8 billion) in foreign direct investment in the first quarter of 2026, a 6.0% year-on-year increase, moderating from the prior quarter’s 48.7% surge. Inflows into information and communication technology services remained particularly strong, with China, Hong Kong, and Singapore serving as the primary capital sources, according to McKinsey’s Southeast Asia quarterly economic review. Bank Negara Malaysia has held its policy rate steady following a pre-emptive 25 basis-point cut in July 2025, with headline inflation projected to average just 2.0% in 2026.
The Long Game: Semiconductors, Rare Earths, and Nuclear Power
Beyond RMK13’s near-term targets, Malaysian officials are positioning the country’s industrial strategy around decades, not years. Minister Akmal has reiterated commitments to eliminate coal use by 2044 and reach net zero by 2050, while confirming Malaysia is actively “exploring the potential” of nuclear power to meet the energy demands of its expanding data-center and semiconductor sectors. AMRO’s structural policy guidance urges Malaysia to develop domestic semiconductor and rare-earth capabilities as a hedge against ongoing US-China “geoeconomic fracturing,” positioning the country as a trusted neutral hub for global manufacturers diversifying away from concentrated exposure to either superpower.
Discover more from The Economy
Subscribe to get the latest posts sent to your email.

China Economy 2026: Export Growth Masks Manufacturing Overcapacity

Pakistan Iran-US Ceasefire Mediation 2026: Diplomatic Gains, Economic Risks

Pakistan Circular Debt Crisis 2026: IMF Deadline Missed, Rs 3.44 Trillion

Indonesia Russian Oil Imports 2026: Why Jakarta Is Diversifying Crude Supply

Russia Bans Diesel Exports 2026: Global Fuel Market Impact Explained

Gulf Sovereign Wealth Funds Hit Record $53.9B in H1 2026 Despite Iran War

America’s Workers Are Vanishing From the Labor Force — And It’s Not the Usual Reasons

ASEAN+3 Enters 2026 From a Position of Strength — But Two Storms Are Building Offshore

US Tariff Investigation 2026: 60 Countries, Forced Labor Claims and the EU Trade Fight

UK Digital Identity Framework 2026: The £5bn Plan to Reshape Financial Verification

The Money Is Drying Up: How US Pressure Is Choking Off Russia-China Payment Channels

Indonesia GDP Growth 2026: 5.61% Expansion Marks Fastest Pace in Three Years

Singapore Makes Its Move to Become Asia’s Precious-Metals Capital

Malaysia Bets Its 2026 on “Execution” — And the Semiconductor Upcycle Is Doing the Heavy Lifting

Top 20 PSX Stocks for Investment in 2027: Your Complete Guide to Pakistan’s Best Investment Opportunities

Investors Pile Into Bullish Dollar Bets as ‘US Exceptionalism’ Trade Returns

Carry Trade Unwind 2026: How the Yen’s Snapback Triggered a Global Margin Call

Pakistan Textile Body Welcomes FY27 Budget, Seeks FTR

Japan’s Nikkei Scales Record Peak as AI Shares Track US Chip Rally

Why China’s Demand Stimulus Still Isn’t Working

Grinding the Already Ground: Pakistan’s Inflation Crisis

JPMorgan Cuts Anthropic AI Access in Hong Kong

Weak Demand at Treasury Auctions Is Quietly Rattling Bond Investors

China Tungsten Export Curbs: Is Japan’s AI Chip Supply at Risk?

Xponential Fitness Franchise Lawsuit: The $3.97M Judgment

SpaceX IPO opens door for retail savers via X Money

SpaceX IPO: Musk Raises $75bn in History’s Largest Listing

Bank Indonesia Rate Hike 2026: New Mandate’s First Market Test
-

 Markets & Finance6 months ago
Top 15 Stocks for Investment in 2026 in PSX: Your Complete Guide to Pakistan’s Best Investment Opportunities
-

 Analysis5 months ago
Top 10 Stocks for Investment in PSX for Quick Returns in 2026
-

 Analysis5 months ago
Brazil’s Rare Earth Race: US, EU, and China Compete for Critical Minerals as Tensions Rise
-

 Analysis5 months ago
Johor’s Investment Boom: The Hidden Costs Behind Malaysia’s Most Ambitious Economic Surge
-

 Banks6 months ago
Best Investments in Pakistan 2026: Top 10 Low-Price Shares and Long-Term Picks for the PSX
-

 Investment6 months ago
Top 10 Mutual Fund Managers in Pakistan for Investment in 2026: A Comprehensive Guide for Optimal Returns
-

 Global Economy6 months ago
15 Most Lucrative Sectors for Investment in Pakistan: A 2025 Data-Driven Analysis
-

 Global Economy6 months ago
Pakistan’s Export Goldmine: 10 Game-Changing Markets Where Pakistani Businesses Are Winning Big in 2025