
China Economy
The World’s 50 Largest Economies: A 25-Year Growth Trajectory Analysis (2000-2025)
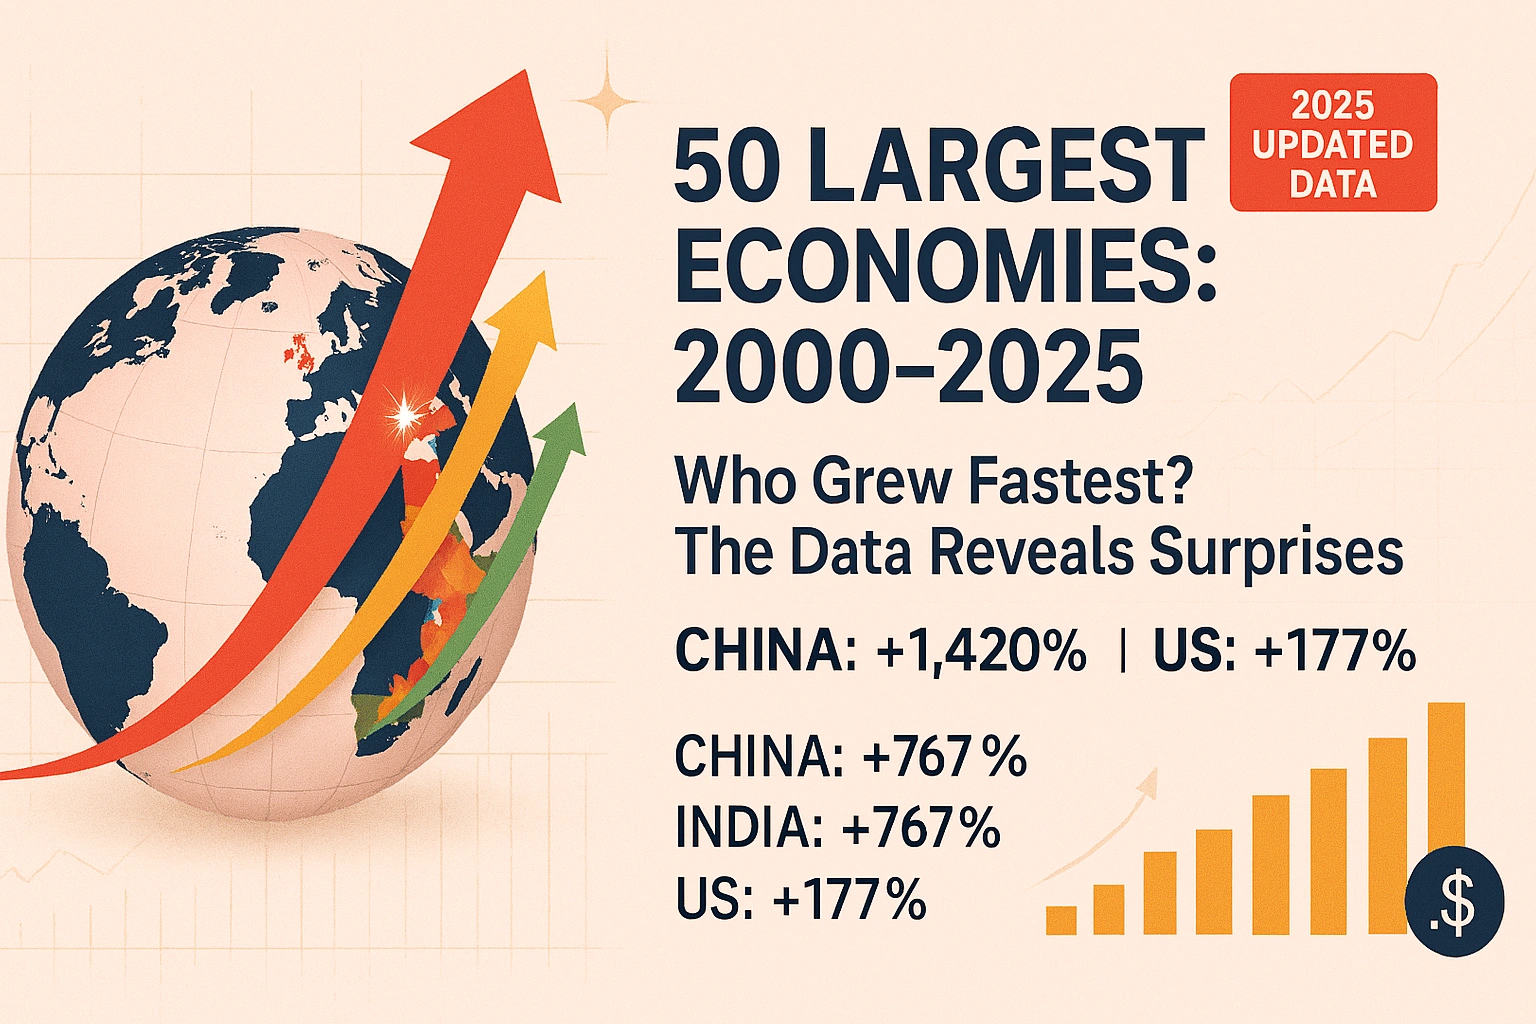
How GDP Expansion and Export Dynamics Reshaped Global Economic Power
The dawn of the 21st century marked a watershed moment in economic history. In 2000, the global economy stood at approximately $33 trillion in nominal GDP. Today, that figure exceeds $105 trillion. But beneath these aggregate numbers lies a far more compelling story: a dramatic reshuffling of economic power that would have seemed fantastical to observers at the turn of the millennium.
China’s economy has expanded fourteenfold. India’s has grown nearly eightfold. Meanwhile, traditional economic powers have seen their relative positions shift in ways that challenge decades of assumptions about development, growth, and global economic hierarchy. This analysis examines all 50 of the world’s largest economies, tracking their GDP trajectories and export performance across 25 years of globalization, crisis, and transformation.
For investors allocating capital across borders, policymakers navigating geopolitical competition, and citizens seeking to understand their place in the global economy, these patterns reveal which strategies succeeded, which models faltered, and what the next quarter-century might hold.
Methodology and Data Framework
This analysis draws primarily on datasets from the International Monetary Fund’s World Economic Outlook Database, supplemented by World Bank national accounts data and OECD statistics for member countries. Export data comes from the World Trade Organization’s statistical database and national statistical agencies.
GDP Measurement Approach
Two methodologies dominate international comparisons. Nominal GDP measures economic output in current U.S. dollars using market exchange rates. This approach captures the actual dollar value of economies in international transactions but can be distorted by currency fluctuations. Purchasing Power Parity (PPP) adjusts for price level differences between countries, providing a better measure of domestic living standards and real output.
This analysis primarily uses nominal GDP for rankings and international comparisons, as it reflects actual economic power in global markets, trade negotiations, and geopolitical influence. PPP figures are referenced where relevant for understanding domestic economic conditions and real growth rates.
Time Period and Baseline
The year 2000 serves as an ideal baseline for several reasons. It represents the post-Cold War economic order before China’s 2001 WTO accession, captures the dot-com bubble peak, and provides a pre-9/11, pre-financial crisis reference point. The 25-year span encompasses multiple economic cycles, technological revolutions, and structural transformations.
Data Limitations
All international economic comparisons face inherent challenges. GDP calculations vary by national statistical methodology. Currency fluctuations can dramatically shift nominal rankings. Some economies (particularly China) face ongoing debates about data accuracy. Export statistics may not fully capture services trade or digital transactions. These limitations warrant acknowledgment without undermining the broader patterns revealed.
The Top 10 Economic Titans: Dominance and Disruption
United States: Sustained Primacy ($28.8 Trillion)
The United States began the millennium with a GDP of approximately $10.3 trillion and has grown to roughly $28.8 trillion in 2025, according to Bureau of Economic Analysis estimates. This represents 180% growth over 25 years, or a compound annual growth rate of about 4.2% in nominal terms.
What’s remarkable isn’t just absolute growth but sustained leadership through multiple crises. The U.S. economy absorbed the dot-com crash, the 2008 financial crisis, and the COVID-19 pandemic while maintaining its position as the world’s largest economy and primary reserve currency issuer. The dollar’s role in global trade and finance, combined with technological leadership in software, biotechnology, and artificial intelligence, has preserved American economic dominance even as relative share declined.
U.S. exports expanded from $1.1 trillion in 2000 to approximately $3.0 trillion in 2024, driven by services (particularly digital and financial), agricultural products, and advanced manufacturing. The trade deficit widened substantially, reflecting consumption patterns and the dollar’s reserve status enabling persistent current account imbalances.
China: The Most Dramatic Rise in Economic History ($18.5 Trillion)
No economic transformation in human history compares to China’s 25-year ascent. From a GDP of approximately $1.2 trillion in 2000, China’s economy expanded to roughly $18.5 trillion by 2025—a staggering 1,440% increase. The compound annual growth rate exceeded 11% for much of this period, moderating to 5-6% in recent years as the economy matured.
China’s 2001 accession to the World Trade Organization catalyzed this transformation. The country became the “world’s factory,” with exports surging from $249 billion in 2000 to over $3.5 trillion by 2024. China now exports more than any other nation, with manufactured goods comprising the bulk of shipments.
This growth trajectory lifted 800 million people out of poverty, created the world’s largest middle class, and shifted global supply chains. China surpassed Japan as the world’s second-largest economy in 2010, a symbolic moment marking Asia’s return to historical prominence. The economy’s sheer scale now influences commodity prices, manufacturing trends, and technological development globally.
The Chinese model combined state-directed capitalism, export-led growth, massive infrastructure investment, and financial repression to channel savings into productive capacity. Whether this model remains sustainable as demographics worsen and debt accumulates represents one of the key questions for global economics through 2050.
Japan: Stagnation, Resilience, and Recent Revival ($4.1 Trillion)
Japan’s economic story offers a counterpoint to China’s rise. The world’s second-largest economy in 2000 with GDP of $4.9 trillion, Japan grew to only $4.1 trillion by 2025 in nominal terms—a decline of 16%. However, this masks a more complex reality.
In PPP terms, Japan’s economy expanded modestly. Deflation, an aging population, and yen depreciation compressed nominal figures. Yet Japanese corporations remained technological leaders, the country maintained high living standards, and exports of automobiles, electronics, and machinery remained substantial at approximately $900 billion annually.
The “lost decades” narrative oversimplifies. Japan’s unemployment remained remarkably low, social cohesion high, and per capita income among the world’s highest. Recent economic reforms under various administrations have targeted corporate governance, labor market flexibility, and monetary stimulus with mixed results.
Germany: Europe’s Export Champion ($4.7 Trillion)
Germany’s economy expanded from $1.9 trillion in 2000 to approximately $4.7 trillion in 2025, representing 145% growth. This performance stands out in a European context marked by crisis and stagnation.
The German model centered on export-oriented manufacturing excellence, particularly automobiles, machinery, and chemicals. Exports reached $1.9 trillion in 2024, making Germany one of the world’s leading exporters relative to economic size. The trade surplus consistently exceeded 5% of GDP, reflecting competitiveness but also structural imbalances within the eurozone.
Eurozone membership provided Germany with an undervalued currency relative to its productivity, advantaging exporters. However, this came at the cost of regional imbalances, as southern European economies struggled with the same currency that propelled German growth.
India: The Emerging Giant ($4.0 Trillion)
India’s trajectory represents the other great Asian success story. GDP expanded from approximately $470 billion in 2000 to $4.0 trillion in 2025—growth of 750%. While less dramatic than China’s rise in percentage terms, India’s expansion occurred in a democracy with different structural constraints.
Services-led growth distinguished India’s model. Information technology, business process outsourcing, and financial services drove development rather than manufacturing. Exports grew from $43 billion in 2000 to approximately $775 billion in 2024, with services comprising a larger share than typical for developing economies.
India’s 1.4 billion people and favorable demographics position the country as potentially the world’s third-largest economy by 2030. However, challenges around infrastructure, education quality, and institutional capacity temper projections.
United Kingdom: Brexit and Beyond ($3.5 Trillion)
The UK economy grew from $1.6 trillion in 2000 to approximately $3.5 trillion in 2025, representing 120% expansion. Financial services dominance in the City of London, combined with pharmaceuticals, aerospace, and creative industries, sustained growth despite manufacturing decline.
The 2016 Brexit referendum and subsequent departure from the European Union introduced new uncertainties. Trade patterns shifted, with services exports facing new friction and goods trade requiring customs procedures. The long-term impact remains contested, with research from institutions like the Centre for Economic Performance suggesting modest negative effects on trade and investment.
France: Social Model Under Pressure ($3.1 Trillion)
France expanded from $1.4 trillion in 2000 to roughly $3.1 trillion in 2025, growth of 125%. The French model balanced strong social protections, significant state involvement in strategic sectors, and export competitiveness in aerospace, luxury goods, and agriculture.
High taxation, rigid labor markets, and pension obligations created fiscal pressures throughout the period. Yet French multinationals competed globally, productivity remained high, and quality of life indicators consistently ranked among the world’s best.
Italy: Sclerotic Growth and Structural Challenges ($2.3 Trillion)
Italy represents the developed world’s most disappointing performer. GDP grew from $1.1 trillion in 2000 to only $2.3 trillion in 2025, barely doubling over 25 years. Structural problems including low productivity growth, political instability, banking sector weakness, and demographic decline constrained expansion.
Northern Italy’s industrial districts maintained export competitiveness in machinery and luxury goods, but southern underdevelopment, rigid labor markets, and high public debt limited potential. Italy’s experience illustrates how institutional quality and structural reforms matter as much as initial conditions.
Canada: Resource-Rich Stability ($2.2 Trillion)
Canada’s economy expanded from $740 billion in 2000 to approximately $2.2 trillion in 2025, representing nearly 200% growth. Natural resources (oil, natural gas, minerals, timber) provided substantial export revenues, while proximity to the United States ensured market access.
The Canadian model balanced resource extraction with services growth, immigration-driven population expansion, and prudent financial regulation. Canadian banks survived the 2008 crisis largely unscathed, reflecting stronger regulatory oversight than American counterparts.
South Korea: From Developing to Developed ($1.9 Trillion)
South Korea’s rise from $562 billion in 2000 to $1.9 trillion in 2025 represents successful development strategy execution. The country transitioned from middle-income to advanced economy status, with globally competitive firms like Samsung, Hyundai, and LG driving export growth.
Electronics, automobiles, and shipbuilding propelled exports from $172 billion in 2000 to over $750 billion in 2024. Heavy investment in education, R&D spending exceeding 4% of GDP, and strategic industrial policy yielded technological leadership in semiconductors and displays.
Positions 11-30: The Global Middle Class
This tier encompasses economies ranging from $700 billion to $1.8 trillion, representing diverse development models and regional dynamics.
Russia ($1.8 Trillion): Expanded from $260 billion in 2000 to peak at $2.3 trillion before sanctions and oil price volatility reduced GDP to approximately $1.8 trillion. Commodity dependence, particularly energy exports, has driven boom-bust cycles. Geopolitical tensions following the 2014 Ukraine annexation and 2022 invasion drastically reshaped economic relationships.
Brazil ($2.3 Trillion): Grew from $655 billion to roughly $2.3 trillion, with commodity cycles dominating. Agricultural exports (soybeans, beef, sugar) and mineral resources drove growth, but political instability, infrastructure deficits, and education gaps constrained potential. Brazil illustrates the “middle-income trap” where initial development success stalls before reaching advanced status.
Australia ($1.7 Trillion): Expanded from $415 billion to $1.7 trillion, benefiting enormously from Chinese demand for iron ore, coal, and natural gas. The commodity boom of 2003-2011 drove exceptional growth, with Australia avoiding recession for nearly three decades—a remarkable run enabled by flexible monetary policy, immigration, and resource wealth.
Spain ($1.6 Trillion): Grew from $580 billion to $1.6 trillion despite a devastating 2008-2013 crisis. Construction and real estate collapse, banking sector distress, and unemployment exceeding 25% created severe pain. Recovery came through labor market reforms, tourism growth, and European Central Bank support, demonstrating eurozone integration benefits and constraints.
Mexico ($1.8 Trillion): Expanded from $680 billion to $1.8 trillion, benefiting from NAFTA/USMCA market access and manufacturing nearshoring. Automobile production, electronics assembly, and agriculture linked Mexican growth tightly to U.S. economic cycles. Violence, corruption, and institutional weakness limited potential despite favorable geography.
Indonesia ($1.4 Trillion): Grew from $165 billion to $1.4 trillion, Southeast Asia’s largest economy demonstrating commodity wealth and demographic dividend. Palm oil, coal, and mineral exports drove growth, while domestic consumption from 275 million people provided resilience. Infrastructure development remains critical for sustaining momentum.
Netherlands ($1.1 Trillion): Expanded from $415 billion to $1.1 trillion, maintaining status as a trading hub and logistics gateway. Rotterdam’s port, favorable tax treatment for multinationals, and export-oriented agriculture (flowers, vegetables) sustained prosperity despite small geographic size.
Saudi Arabia ($1.1 Trillion): Oil wealth drove expansion from $190 billion to $1.1 trillion, with volatility reflecting crude prices. Vision 2030 diversification efforts aim to reduce petroleum dependence, but progress remains limited. The kingdom’s position as swing producer in OPEC gives it outsized influence over global energy markets.
Turkey ($1.1 Trillion): Grew from $270 billion to $1.1 trillion, bridging Europe and Asia geographically and economically. Manufacturing exports, tourism, and construction drove growth, but political uncertainty, inflation, and unconventional monetary policy created volatility. Currency crises in 2018 and 2021 highlighted vulnerabilities.
Switzerland ($940 Billion): Expanded from $265 billion to $940 billion, maintaining its status as a financial center and precision manufacturing hub. Pharmaceuticals, watches, machinery, and banking services generated trade surpluses despite high costs. Political neutrality, institutional quality, and innovation sustained exceptional per capita prosperity.
Poland ($845 Billion): Perhaps Europe’s greatest success story, expanding from $171 billion to $845 billion. EU accession in 2004 catalyzed transformation, with structural funds, market access, and institutional reforms driving convergence. Manufacturing exports, particularly automobiles and electronics, integrated Poland into German supply chains.
Argentina ($640 Billion): Illustrates development disappointment, growing from $284 billion to only $640 billion. Chronic inflation, debt defaults (2001, 2020), currency crises, and policy instability prevented potential realization. Agricultural wealth (beef, soybeans, wheat) couldn’t overcome institutional dysfunction.
Belgium ($630 Billion): Grew from $230 billion to $630 billion, benefiting from EU headquarters location, port of Antwerp, and chemicals/pharmaceuticals exports. Political fragmentation between Flemish and Francophone regions created governance challenges without preventing prosperity.
Ireland ($630 Billion): Extraordinary expansion from $100 billion to $630 billion, though figures are distorted by multinational tax strategies. Genuine growth in pharmaceuticals, technology services, and financial operations was amplified by corporate profit shifting. The “leprechaun economics” phenomenon saw GDP surge 26% in 2015 largely from accounting changes.
Thailand ($540 Billion): Expanded from $126 billion to $540 billion, maintaining position as Southeast Asian manufacturing hub. Automobile production, electronics assembly, and tourism sustained growth despite political instability. Integration into regional supply chains, particularly for Japanese manufacturers, proved durable.
Austria ($530 Billion): Grew from $195 billion to $530 billion, leveraging location between Western and Eastern Europe. Manufacturing excellence, tourism, and banking services for Central Europe maintained high living standards.
United Arab Emirates ($510 Billion): Oil wealth and diversification drove expansion from $104 billion to $510 billion. Dubai’s transformation into a trading, tourism, and financial hub demonstrated how resource wealth can fund structural transformation. Aviation, real estate, and logistics complemented hydrocarbon revenues.
Nigeria ($500 Billion): Africa’s largest economy expanded from $67 billion to $500 billion, driven by oil exports and population growth. However, per capita income gains remained modest as 220 million people diluted aggregate growth. Infrastructure gaps, corruption, and security challenges constrained development despite resource wealth.
Israel ($530 Billion): Grew from $130 billion to $530 billion, earning its “startup nation” moniker. High-tech exports (software, cybersecurity, semiconductors) and defense industries drove development. R&D intensity exceeding 5% of GDP and mandatory military service creating technical skills sustained innovation.
Singapore ($525 Billion): Expanded from $96 billion to $525 billion, maintaining status as Southeast Asian financial center and trading hub. Despite tiny geography, strategic location, rule of law, and openness to global commerce created exceptional prosperity. Per capita income ranks among the world’s highest.
Positions 31-50: Rising Stars and Resilient Performers
The lower half of the top 50 reveals diverse economies at various development stages, from African emerging markets to smaller European nations.
Malaysia ($445 Billion): Electronics manufacturing, palm oil, and petroleum drove growth from $90 billion to $445 billion. Integration into East Asian supply chains sustained development, though middle-income challenges emerged as low-cost advantages eroded.
Philippines ($470 Billion): Grew from $81 billion to $470 billion, with remittances from overseas workers, business process outsourcing, and domestic consumption driving expansion. The country’s 115 million people and English proficiency created services export opportunities.
Bangladesh ($460 Billion): Remarkable transformation from $53 billion to $460 billion, propelled by ready-made garment exports. The country became the world’s second-largest clothing exporter after China, demonstrating how labor-intensive manufacturing can drive initial development.
Vietnam ($430 Billion): Stunning growth from $31 billion to $430 billion represented successful transition from command to market economy. Manufacturing exports, particularly electronics and textiles, attracted investment fleeing Chinese costs. Vietnam increasingly serves as “China plus one” diversification destination.
Egypt ($400 Billion): Expanded from $100 billion to $400 billion, though population growth to 110 million meant modest per capita gains. Suez Canal revenues, tourism, natural gas, and agriculture sustained the economy, but political instability and food security concerns created challenges.
Denmark ($410 Billion): Grew from $165 billion to $410 billion, maintaining Nordic social model with high taxation, strong welfare state, and export competitiveness in pharmaceuticals, renewable energy, and maritime services. Consistently ranks among world’s happiest and most prosperous nations.
Colombia ($390 Billion): Expanded from $100 billion to $390 billion, with oil, coal, coffee, and flowers driving exports. Security improvements after decades of conflict attracted investment, though inequality and political polarization persisted.
Pakistan ($380 Billion): Grew from $74 billion to $380 billion, but population expansion to 240 million meant per capita income remained low. Textiles exports, agriculture, and remittances sustained the economy, though political instability, debt burdens, and energy shortages constrained growth.
Chile ($360 Billion): Expanded from $78 billion to $360 billion, with copper mining dominating exports. Market-oriented policies since the 1980s created Latin America’s highest per capita income, though inequality sparked social unrest in 2019.
Finland ($305 Billion): Grew from $125 billion to $305 billion despite Nokia’s mobile phone business collapse. Adaptation to technology sector changes, forestry exports, and strong education system maintained prosperity.
Romania ($330 Billion): EU membership catalyzed growth from $37 billion to $330 billion. Manufacturing exports, particularly automobiles, and IT services drove convergence with Western European living standards, though institutional challenges remained.
Czech Republic ($330 Billion): Expanded from $61 billion to $330 billion, becoming a manufacturing hub for German automotive industry. Škoda Auto’s integration into Volkswagen Group symbolized broader economic integration.
Portugal ($285 Billion): Grew from $120 billion to $285 billion despite 2010-2014 eurozone crisis requiring bailout. Tourism, exports to Spain and France, and reforms restored growth.
Iraq ($270 Billion): Oil wealth rebuilt economy from wartime devastation, expanding from $32 billion to $270 billion. However, political instability, sectarian violence, and petroleum dependence left development fragile.
Peru ($270 Billion): Grew from $53 billion to $270 billion, with copper, gold, and fishmeal exports driving expansion. Market reforms in 1990s created Latin America’s fastest-growing major economy for two decades.
New Zealand ($270 Billion): Expanded from $54 billion to $270 billion, leveraging agricultural exports (dairy, meat, wine) and tourism. Small population and geographic isolation didn’t prevent high living standards.
Greece ($240 Billion): Cautionary tale of boom and bust, growing from $130 billion to peak at $355 billion before eurozone crisis collapsed GDP to $240 billion. Debt crisis, austerity, and depression demonstrated risks of unsustainable fiscal policy within monetary union.
Qatar ($235 Billion): Natural gas wealth drove expansion from $30 billion to $235 billion. World’s highest per capita income reflects tiny population and massive hydrocarbon reserves. 2022 World Cup hosting demonstrated global ambitions.
Hungary ($215 Billion): Grew from $47 billion to $215 billion after EU accession. Automotive manufacturing for German brands and electronics assembly attracted investment, though democratic backsliding created tensions with Brussels.
Kazakhstan ($220 Billion): Oil wealth expanded economy from $18 billion to $220 billion. Resource dependence and authoritarian governance characterized development model, with diversification efforts showing limited progress.
Growth Champions: Who Grew Fastest?
While absolute size matters, growth velocity reveals which economies executed successful development strategies.
Highest Absolute GDP Growth (2000-2025):
- China: +$17.3 trillion
- United States: +$18.5 trillion
- India: +$3.5 trillion
- Germany: +$2.8 trillion
- Indonesia: +$1.2 trillion
Highest Percentage Growth (2000-2025):
- China: +1,440%
- Vietnam: +1,290%
- Bangladesh: +770%
- India: +750%
- Ethiopia: +680%
- Indonesia: +745%
- Poland: +395%
- Ireland: +530%
- Philippines: +480%
- Turkey: +307%
These rankings reveal that developing economies with large populations, favorable demographics, and successful integration into global trade achieved the fastest expansion. Manufacturing-oriented models (China, Vietnam, Bangladesh) outperformed commodity exporters, though natural resources provided growth where institutional quality allowed investment in productive capacity.
Export Growth Leaders:
Countries that dramatically expanded export volumes demonstrated competitiveness gains:
- China: $249 billion (2000) → $3,500 billion (2024) = +1,305%
- Vietnam: $14 billion → $385 billion = +2,650%
- India: $43 billion → $775 billion = +1,700%
- Poland: $32 billion → $395 billion = +1,134%
- Mexico: $166 billion → $620 billion = +273%
GDP Per Capita Improvements:
Several economies achieved dramatic per capita income gains, reflecting successful development:
- China: $960 → $13,100 (+1,265%)
- Poland: $4,450 → $22,000 (+395%)
- South Korea: $11,900 → $38,000 (+220%)
- Ireland: $25,600 → $98,000 (+283%, distorted by corporate accounting)
- Singapore: $23,800 → $88,000 (+270%)
Disappointments and Stagnation:
Some economies failed to realize potential or regressed:
- Japan: Nominal GDP declined despite stable living standards
- Italy: Barely doubled in 25 years, chronic stagnation
- Argentina: Chronic instability prevented resource wealth translation to broad prosperity
- Greece: Boom-bust cycle erased years of gains
- Venezuela: Collapsed from $117 billion to $70 billion, representing catastrophic policy failure
Structural Patterns and Insights
Several patterns emerge from 25 years of economic data:
Export-Led vs. Domestic Consumption Models
The most successful developing economies pursued export-oriented growth. China, Vietnam, Bangladesh, and Poland integrated into global supply chains, using external demand to drive industrialization and employment. Export manufacturing provided hard currency, technology transfer, and productivity improvements.
In contrast, economies relying primarily on domestic consumption or commodity exports faced greater volatility. Brazil, Russia, and Saudi Arabia experienced boom-bust cycles tied to resource prices, while protected domestic markets in Argentina and Venezuela bred inefficiency without external competitive pressure.
Resource Curse and Blessing
Natural resource wealth produced divergent outcomes based on institutional quality. Norway, Australia, and Canada translated resource abundance into broad prosperity through strong governance, transparent management, and economic diversification. Russia, Venezuela, and Nigeria experienced corruption, dutch disease, and volatility, demonstrating that institutions matter more than endowments.
The resource curse isn’t inevitable but requires deliberate policy to avoid. Sovereign wealth funds, transparent revenue management, and investment in education and infrastructure distinguished successful resource exporters.
Technology Adoption and Productivity
Economies that invested heavily in education, R&D, and digital infrastructure achieved sustained productivity gains. South Korea’s transformation from middle-income to advanced economy status reflected R&D spending exceeding 4% of GDP and technical education emphasis. Estonia’s digital transformation and Finland’s recovery from Nokia’s collapse demonstrated how human capital investment enables adaptation.
Countries that underinvested in education and allowed technological gaps to widen faced stagnation. Italy’s productivity growth essentially flatlined, while Greece’s education system failed to match labor market needs.
Demographics and Growth
Population structure powerfully influenced growth trajectories. India, Indonesia, and Philippines benefited from working-age population expansion, while Japan, Germany, and Italy struggled with aging and shrinking workforces. China’s demographic dividend is now reversing, with working-age population declining and dependency ratios rising.
The demographic transition from high birth rates and young populations through working-age expansion to aging and decline follows predictable patterns. Successful economies maximized growth during demographic dividend periods while building institutions and capital for aging. Japan’s challenges forewarn China’s future.
Institutional Quality Impact
Perhaps most fundamentally, institutional quality—rule of law, property rights protection, corruption control, regulatory quality—distinguished successful from failed development. Poland’s EU membership forced institutional reforms that unleashed growth. Argentina’s institutional dysfunction perpetuated crisis despite resource wealth and human capital.
Research from institutions like the World Bank’s Worldwide Governance Indicators consistently shows institutional quality correlating with growth, investment, and development outcomes. While causality is complex, the pattern holds across regions and time periods.
The 2000-2025 Economic Narrative: Crisis and Transformation
The 25-year period wasn’t smooth expansion but rather featured multiple shocks that reshaped economies:
Dot-Com Bust (2000-2002): Technology stock collapse triggered recession in advanced economies but barely affected most developing countries, illustrating financial integration levels.
China’s WTO Accession (2001): Perhaps the single most consequential economic event, integrating 1.3 billion people into global trading system and triggering manufacturing shifts worldwide.
Commodity Supercycle (2003-2008): Chinese demand drove unprecedented increases in oil, metals, and agricultural prices, enriching resource exporters and catalyzing infrastructure investment.
Global Financial Crisis (2008-2009): The worst economic crisis since the Great Depression exposed financial system vulnerabilities, triggered sovereign debt concerns, and prompted massive monetary stimulus. Advanced economies bore the brunt while emerging markets recovered faster.
Eurozone Crisis (2010-2012): Sovereign debt problems in Greece, Ireland, Portugal, Spain, and Italy threatened monetary union’s survival. ECB intervention and fiscal austerity created divergent outcomes across member states.
Emerging Market Slowdown (2013-2015): Chinese growth deceleration, commodity price collapses, and Fed tightening expectations triggered outflows and currency crises in vulnerable economies.
U.S.-China Trade Tensions (2018-2019): Tariff escalation, technology restrictions, and supply chain concerns marked shift from cooperation to strategic competition, with effects rippling through integrated global economy.
COVID-19 Economic Shock (2020-2021): Pandemic lockdowns triggered sharpest global contraction since World War II, followed by rapid recovery driven by unprecedented fiscal and monetary stimulus. Supply chain disruptions and inflation accelerated.
Post-Pandemic Inflation Surge (2022-2025): Stimulus-fueled demand colliding with supply constraints produced highest inflation in four decades. Central bank tightening raised recession risks while reshaping investment patterns toward domestic production and resilience over efficiency.
Each crisis tested economic models and policy frameworks. Countries with fiscal space, flexible institutions, and diversified economies generally recovered faster than those with rigidities, debt burdens, and concentrated exposures.
Future Implications: The Economic Landscape Through 2050
Several trends will likely shape the next quarter-century:
Demographic Dividend Shifts: India, Indonesia, Philippines, and African economies enter prime demographic periods while China, Europe, and eventually East Asia age rapidly. Working-age population shifts will drive growth location.
Technology Revolution Impact: Artificial intelligence, automation, and digital platforms will reshape productivity and employment. Countries that invest in digital infrastructure and technical education will capture disproportionate gains.
Climate Transition Economics: Decarbonization will require trillions in investment, creating winners in renewable energy and losers in fossil fuels. Early movers in clean technology may capture first-mover advantages while climate-vulnerable economies face adaptation costs.
Deglobalization vs. Regionalization: U.S.-China decoupling and supply chain reshoring may fragment the global economy, but regional integration (Africa Continental Free Trade Area, RCEP in Asia) could create new growth poles. Mexico and Southeast Asia may benefit from nearshoring trends.
BRICS+ Expansion: Efforts to create alternatives to dollar-dominated financial system and Western-led institutions reflect multipolar ambitions. Success remains uncertain but reflects broader power shifts.
Debt Sustainability Challenges: Many economies carry high debt burdens accumulated through crisis responses. Rising interest rates test sustainability, particularly for developing countries facing hard currency obligations.
Inequality and Social Stability: Within-country inequality grew alongside between-country convergence. Political polarization and social unrest may constrain growth-friendly policies, while automation and AI could accelerate labor market disruption.
Projections suggest China may reach or exceed U.S. GDP in nominal terms by 2035-2040, though per capita income will lag for decades. India will likely become the world’s third-largest economy before 2030. Indonesia, Vietnam, Bangladesh, and Philippines could all rank among the world’s 20 largest economies by mid-century.
However, these projections assume continuity in policies and institutions. As the past 25 years demonstrated, shocks, crises, and policy choices produce unexpected outcomes. Argentina’s decline from the world’s tenth-largest economy in 1900 to barely top-30 today warns against determinism.
Conclusion: The New Multipolar Economic Order
The 25-year period from 2000 to 2025 witnessed the most dramatic reshuffling of economic power in modern history. China’s rise, India’s emergence, and developing Asia’s transformation challenged Western economic dominance that characterized the post-World War II era.
Yet nuance matters more than headlines. The United States maintained absolute leadership while adapting to relative decline. Europe weathered existential crises to preserve integration. Japan’s stagnation coexisted with high living standards. Commodity exporters experienced booms and busts reflecting both resource wealth and institutional quality.
For investors, the patterns suggest several implications: Demographic dividends drive long-run growth. Export competitiveness, particularly in manufactured goods, proves more durable than commodity dependence. Institutional quality matters more than initial conditions. Crisis resilience requires fiscal space and flexible institutions.
For policymakers, the lessons emphasize: Trade integration, properly managed, accelerates development. Education and R&D investment compound over decades. Financial stability and prudent debt management prevent crisis vulnerabilities. Demographic transitions require foresight and adaptation.
The next 25 years will differ from the last. China’s demographic cliff, climate imperatives, technological disruption, and geopolitical fragmentation create new challenges. But fundamental principles endure: Investment in human capital, institutional quality, openness to trade and ideas, and sound macroeconomic management distinguish successful from failed development.
The global economic hierarchy that seemed immutable in 2000 proved anything but. The hierarchy emerging today will likewise transform by 2050. Understanding which forces drive change—and which countries position themselves to capitalize—remains the central challenge for anyone seeking to navigate the 21st century’s economic landscape.
Data Note: This analysis relies on data available as of January 2026, drawing primarily from IMF World Economic Outlook Database (October 2024), World Bank World Development Indicators, and OECD statistics. GDP figures for 2025 represent estimates subject to revision. Exchange rate fluctuations significantly impact nominal rankings. Readers should consult original sources for the most current
Discover more from The Economy
Subscribe to get the latest posts sent to your email.


China’s leadership used its closely watched late-July Politburo meeting to strike a more supportive tone on the economy without committing to the kind of sweeping stimulus package investors had hoped might follow a sharp second-quarter slowdown, reinforcing Beijing’s preference for targeted, precision-guided policy support over broad-based easing.
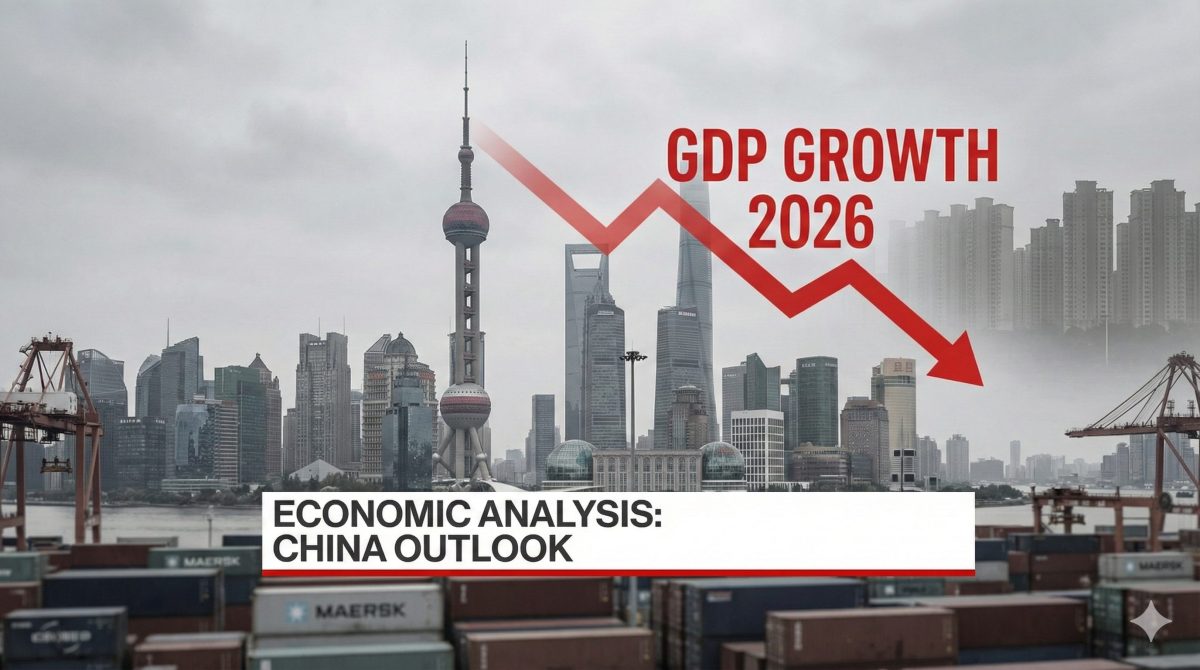
Growth Slows Below Beijing’s Own Target Range
China’s economy expanded 4.3% year-on-year in the second quarter of 2026, a marked deceleration from the 5.0% pace recorded in the first quarter and a figure that sits below the lower bound of Beijing’s own 4.5–5% full-year growth target — the lowest such target range Beijing has set since the early 1990s, according to CryptoBriefing’s analysis of the data. Consumer demand has remained persistently weak, and deflationary pressure has now been a recurring theme in the Chinese economy for several consecutive quarters.
A Reuters poll of economists ahead of the meeting found growth for 2026 as a whole is expected to cool to around 4.6%, before easing further to roughly 4.4% in 2027, as weak domestic demand offsets the boost from resilient exports recorded during a global oil-price shock earlier this year.
Fiscal Firepower Exists — But Beijing Is Choosing Restraint
Perhaps the most consequential signal from analysts previewing the meeting was not about new money, but about unused capacity. China retains roughly RMB 6.8 trillion of this year’s approved government bond issuance quota still undeployed as of the end of June, alongside an RMB 800 billion quasi-policy financing instrument and an estimated RMB 1.8 trillion in unused bond quota carried over from prior years, according to analysis published on Substack’s macro research platform. The implication: Beijing does not lack tools, it is choosing to prioritise faster execution of existing plans over announcing a new headline package.
Standard Chartered economists have argued the meeting was likely to emphasise accelerating fiscal execution in the second half rather than expanding the overall scope of policy support, with monetary policy relegated to a supplementary role. That reading is consistent with the People’s Bank of China’s approach since May 2025, when it last adjusted policy rates or reserve requirements, opting instead for short-term liquidity operations.
China’s July 2026 Politburo meeting signalled stronger support language without a large new stimulus package, after Q2 GDP growth slowed to 4.3% — below Beijing’s 4.5–5% target. With RMB 6.8 trillion in unused bond quota available, policymakers are prioritising faster fiscal execution over broad-based monetary or fiscal easing.
Property Downturn and Overcapacity Remain the Structural Drag
Beneath the headline growth numbers lies a widening bifurcation. New growth drivers — high-end manufacturing, the digital economy, and modern services — accounted for more than 40% of growth in the first half, with high-tech manufacturing value-added up 13.3%. Yet retail sales grew just 1.3% year-on-year in the same period, and fixed-asset investment fell 5.7%, according to detailed policy analysis from independent China economy newsletter Fred Gao. That divergence — a resilient “new economy” propping up an ailing “old economy” — is precisely the dynamic policymakers appear determined not to paper over with indiscriminate stimulus that could derail the structural transition central to the 15th Five-Year Plan’s opening year.
Markets Should Watch Implementation, Not Rhetoric
The consistent message from economists across Citi, Standard Chartered, and independent research houses ahead of the meeting was that markets should discount policy language and instead track fiscal execution data in the coming months — the pace of local government bond issuance, infrastructure project approvals, and any loosening of housing-related restrictions in major cities. Beijing’s playbook, as one analyst close to policymaking circles put it, increasingly resembles precision-guided support rather than the credit-fuelled stimulus waves of 2008–09 or 2015–16.
What It Means for Investors
For global investors positioned in Chinese equities, the yuan, or commodities exposed to Chinese infrastructure demand, the takeaway is one of managed disappointment: meaningful policy support is coming, but gradually, and calibrated to avoid reigniting the property-sector excesses Beijing spent years trying to unwind. A weaker yuan remains the most likely near-term consequence of any incremental stimulus, while a sharper-than-expected growth slowdown in the third quarter remains the primary catalyst that could force Beijing’s hand toward broader action.
Discover more from The Economy
Subscribe to get the latest posts sent to your email.
China Economy
China’s Growth Slips to a Four-Year Low: Why Beijing Still Won’t Pull the Stimulus Trigger

Introduction
China’s economy expanded just 4.3% in the second quarter of 2026, the weakest quarterly pace since late 2022, missing economists’ 4.5% consensus forecast and slowing sharply from 5% growth in the first quarter (CNBC). The reading came in below Beijing’s own full-year target range of 4.5% to 5% — already the least ambitious growth goal China has set in decades — and has intensified calls for fresh stimulus even as policymakers show little appetite for aggressive intervention (CNBC).
What’s Actually Slowing
The slowdown is being driven by an accelerating slide in investment and stubbornly subdued consumption, even as exports have remained comparatively resilient — helped, paradoxically, by a global oil shock that boosted demand for Chinese goods in some categories even as it squeezed household budgets in others (WHBL/Reuters). Reuters’ polling of analysts projects growth will edge up slightly to 4.6% in the third quarter before easing to 4.5% in the fourth, putting full-year 2026 growth at roughly 4.6%, down from 5.0% in 2025 and expected to slow further to 4.4% in 2027 (WHBL/Reuters).
Notably, one bright spot within the investment slump is technology: surging tech-related imports point to a deepening domestic AI infrastructure buildout, with autos and consumer electronics adding further momentum even as broader fixed-asset investment weakens (CNBC).
The Deflation Problem Beijing Can’t Shake
Underlying the growth numbers is a more persistent structural issue: China’s producer prices have now fallen for roughly three years running, undercutting corporate profitability and discouraging the kind of household spending that would normally pull the economy out of a slowdown (FXStreet). When prices fail to rise, consumers have less incentive to spend “today,” a dynamic that suppresses GDP and forces the central bank to actively target positive inflation rather than simply react to it (FXStreet). Analysts at FxPro describe China as a continued “net exporter of deflation” to the rest of the world — as its own overcapacity pushes discounted goods into global markets, applying disinflationary pressure well beyond its borders (FXStreet).
Why Beijing Is Holding Back on Stimulus
Despite the weak headline numbers, most analysts expect no aggressive stimulus action from the late-July Politburo meeting unless growth deteriorates more sharply. The reasoning is twofold: exports have remained resilient, and policymakers remain more focused on curbing excess factory capacity to fight deflation than on further juicing demand, which risks worsening the overcapacity problem that is driving deflation in the first place (WHBL/Reuters).
That said, fiscal policy is expected to accelerate through the second half of the year. Beijing has set a budget deficit of around 4% of GDP for 2026 and lined up heavy government bond issuance specifically to shore up growth after early-year support was front-loaded and then faded (WHBL/Reuters). Capital Economics expects growth to pick up over the second half as this fiscal support ramps up, while cautioning that domestic overcapacity will remain entrenched — meaning China’s economy stays structurally reliant on exports for growth rather than a genuine consumption rebound (WHBL/Reuters). Analysts polled by Reuters expect the People’s Bank of China to hold its key seven-day reverse repo rate unchanged for the remainder of 2026, signaling that Beijing sees this as a fiscal problem rather than a purely monetary one (WHBL/Reuters).
The Trade War Backdrop
The slowdown is unfolding against continued tensions with trade partners, including the United States, which have weighed on export growth even as it has held up better than domestic demand (CNBC). U.S. tariffs specifically are cited as a factor exacerbating China’s domestic deflationary trend by reducing demand for Chinese goods abroad, compounding the overcapacity problem at home (FXStreet). Analysts note that a meaningful reversal of China’s deflationary spiral would likely require either a Federal Reserve rate cut that eases global financial conditions, or a easing of the tariff regime directly — neither of which is fully within Beijing’s control (FXStreet).
What to Watch Next
- The late-July Politburo meeting: the clearest near-term signal of whether Beijing shifts from measured fiscal support to a more aggressive stimulus posture.
- Producer price index trends: continued multi-year declines would reinforce the deflation narrative and pressure corporate margins further.
- Bond issuance pace: heavy issuance against a 4%-of-GDP deficit target will be a key gauge of how quickly fiscal support actually reaches the real economy.
- U.S.-China trade signals: any easing of tariffs would provide more relief to Chinese exporters than domestic policy alone is currently offering.
Key Takeaways
- China’s Q2 2026 GDP growth of 4.3% was its weakest since late 2022, missing forecasts and falling below Beijing’s own full-year target range.
- Producer prices have declined for roughly three years, cementing China’s role as a net exporter of global deflation.
- Beijing is prioritizing capacity reduction over demand-side stimulus, betting that fiscal spending — not rate cuts — will carry the second-half recovery.
- Full-year 2026 growth is forecast at around 4.6%, cooling further to 4.4% in 2027 as structural export-reliance persists.
- A genuine reversal of China’s deflation trend likely depends on external factors — Fed policy or US tariff relief — as much as domestic stimulus.
Sources: CNBC, WHBL/Reuters, FXStreet
Discover more from The Economy
Subscribe to get the latest posts sent to your email.
China’s economy has just delivered its weakest quarterly result since the depths of the pandemic recovery, and the number that matters most isn’t the headline growth figure — it’s what Beijing does, or doesn’t do, about it.
The Numbers Behind the Miss
Gross domestic product expanded 4.3 percent in the April-to-June period, according to the National Bureau of Statistics, missing economists’ forecast of 4.5 percent and slowing sharply from 5 percent in the first quarter. Crucially, that print came in below Beijing’s own full-year target range of 4.5 to 5 percent — described by CNN as the least ambitious goal Beijing has set in decades — and represents a rare public admission of economic weakness for a government that has long leaned on infrastructure investment and exports to mask domestic softness.
An accelerating slide in fixed investment, alongside subdued consumption, is doing most of the damage. Reuters polling ahead of the release had already flagged that weak domestic demand was offsetting the boost from resilient exports during the global oil shock triggered by the Iran conflict.
The Export Paradox
Here is the twist most coverage has undersold: China’s exports haven’t collapsed — in some categories they’ve been the standout performer. Higher energy costs stemming from the war in Iran have actually helped pull China out of one of its longest deflationary stretches on record, as global buyers seeking to reduce fossil-fuel exposure have turned to Chinese batteries, electric vehicles and clean-energy technology.
Macquarie analysts found that chips, computer parts and power equipment accounted for roughly half of China’s export growth in the first half of 2026, underscoring how intertwined China’s growth engine has become with global AI infrastructure spending — even as its domestic property and consumption engines continue to sputter.
Will Beijing Blink on Stimulus?
All eyes now turn to the Politburo’s expected late-July meeting. The consensus among analysts is caution rather than a bazooka. Capital Economics expects growth to pick up in the second half as fiscal support ramps up, but warns that entrenched domestic overcapacity means China’s economy will remain structurally reliant on exports rather than consumption for growth. UOB economist Woei Chen Ho told CNN that a large-scale stimulus package appears unlikely, with selective, targeted measures instead more probable to stabilise investment and consumption.
Beijing has already set a budget deficit of roughly 4 percent of GDP for 2026 and lined up heavy bond issuance, with GDP growth forecast to edge up modestly to 4.6 percent in the third quarter before easing again in the fourth, according to Reuters’ economist poll.
Deflation Still the Deeper Problem
Even with the export-led relief, China’s deflationary pressure has not disappeared. Producer prices have now fallen for well over two years running, with July’s year-on-year decline running at roughly 3.6 percent even as consumer inflation hovers near zero. Analysts note this dynamic effectively exports deflation to trading partners already grappling with tariff-driven cost pressures — complicating monetary policy from Washington to Jakarta.
Why It Matters for Southeast Asia and the Gulf
China remains the dominant trading partner for much of Southeast Asia and a major source of imports for Pakistan. A structurally slower, export-dependent China means continued downward pressure on regional manufacturing prices, but also sustained demand for the commodities and components that feed its clean-energy export machine — a dynamic ASEAN economies from Malaysia to Indonesia are positioning to capture, as detailed in our companion coverage of the region’s investment inflows.
Discover more from The Economy
Subscribe to get the latest posts sent to your email.

Indonesia Financial Hub 2026: Can It Rival Singapore, Dubai?

Russia Fuel Shortages 2026: Inside a Cracking War Economy

China Politburo July 2026: Stimulus Signals Explained

Andy Burnham, UK Gilts and Mortgages: July 2026 Explainer

Pakistan’s 2026 Monsoon Floods Threaten Fragile Economic Recovery as Inflation Nears 9%

Pakistan Gulf Investment Outflows 2026: Peace Deal Stakes Explained

Canada Trade Diversification 2026: China, Indonesia, UAE Deals Explained

US Forced-Labour Tariffs on 60 Countries: The Hidden Trade Shock of 2026

Global Central Banks 2026: Fed, BoE and BoJ Decisions Could Reshape Markets

Gulf Capital Retreat From Pakistan 2026: UAE Loan Freeze & What It Means

Pakistan’s Most Reliable Export Is Its People: Remittances Hit $41.6 Billion, Overtaking Total Exports

Indonesia’s Confidence Problem: Record Investment, a Sinking Rupiah, and a Widening Credibility Gap

Down But Not Out: Inside the Slow Sinking of Russia’s War Economy

China’s Growth Slips to a Four-Year Low: Why Beijing Still Won’t Pull the Stimulus Trigger

Carry Trade Unwind 2026: How the Yen’s Snapback Triggered a Global Margin Call

AI Bubble Warning 2026: Why BIS, IMF and Bank of England Fear a Market Crash

BRICS De‑Dollarization Strategy Takes Shape with $15 Billion Local‑Currency Push

The AI Super Bubble Is Ready to Burst

Russia Bans Diesel Exports 2026: Global Fuel Market Impact Explained

Strait of Hormuz Blockade 2026: Oil Prices Surge 9% as US-Iran Conflict Reignites

Private Credit Warning: Most BDCs Turn Unprofitable in 2026, Reuters Finds

Bitcoin $150k Milestone Achieved as US Sovereign Crypto Pivot Looms

IMF Cuts Pakistan Growth Forecast, Raises Inflation to 8.4%
Gulf Capital Retreat From Pakistan 2026: UAE Loan Freeze & What It Means

India Economic Rise 2026: How the Subcontinent Toppled Japan

Strait of Hormuz 2026: Why Markets Still Don’t Trust It’s Open

China Housing Market Turnaround: White‑List Model Stabilises Prices

Gold Price Forecast 2026: Fed’s July 29 Decision and Record Central Bank Buying Explained
-

 Markets & Finance7 months ago
Top 15 Stocks for Investment in 2026 in PSX: Your Complete Guide to Pakistan’s Best Investment Opportunities
-

 Analysis5 months ago
Johor’s Investment Boom: The Hidden Costs Behind Malaysia’s Most Ambitious Economic Surge
-

 Analysis5 months ago
Top 10 Stocks for Investment in PSX for Quick Returns in 2026
-

 Analysis6 months ago
Brazil’s Rare Earth Race: US, EU, and China Compete for Critical Minerals as Tensions Rise
-

 Banks6 months ago
Best Investments in Pakistan 2026: Top 10 Low-Price Shares and Long-Term Picks for the PSX
-

 Investment7 months ago
Top 10 Mutual Fund Managers in Pakistan for Investment in 2026: A Comprehensive Guide for Optimal Returns
-

 Global Economy7 months ago
15 Most Lucrative Sectors for Investment in Pakistan: A 2025 Data-Driven Analysis
-

 Global Economy7 months ago
Pakistan’s Export Goldmine: 10 Game-Changing Markets Where Pakistani Businesses Are Winning Big in 2025