
Development Finance
Why Developing Economies Face a Sharper Inflation Problem

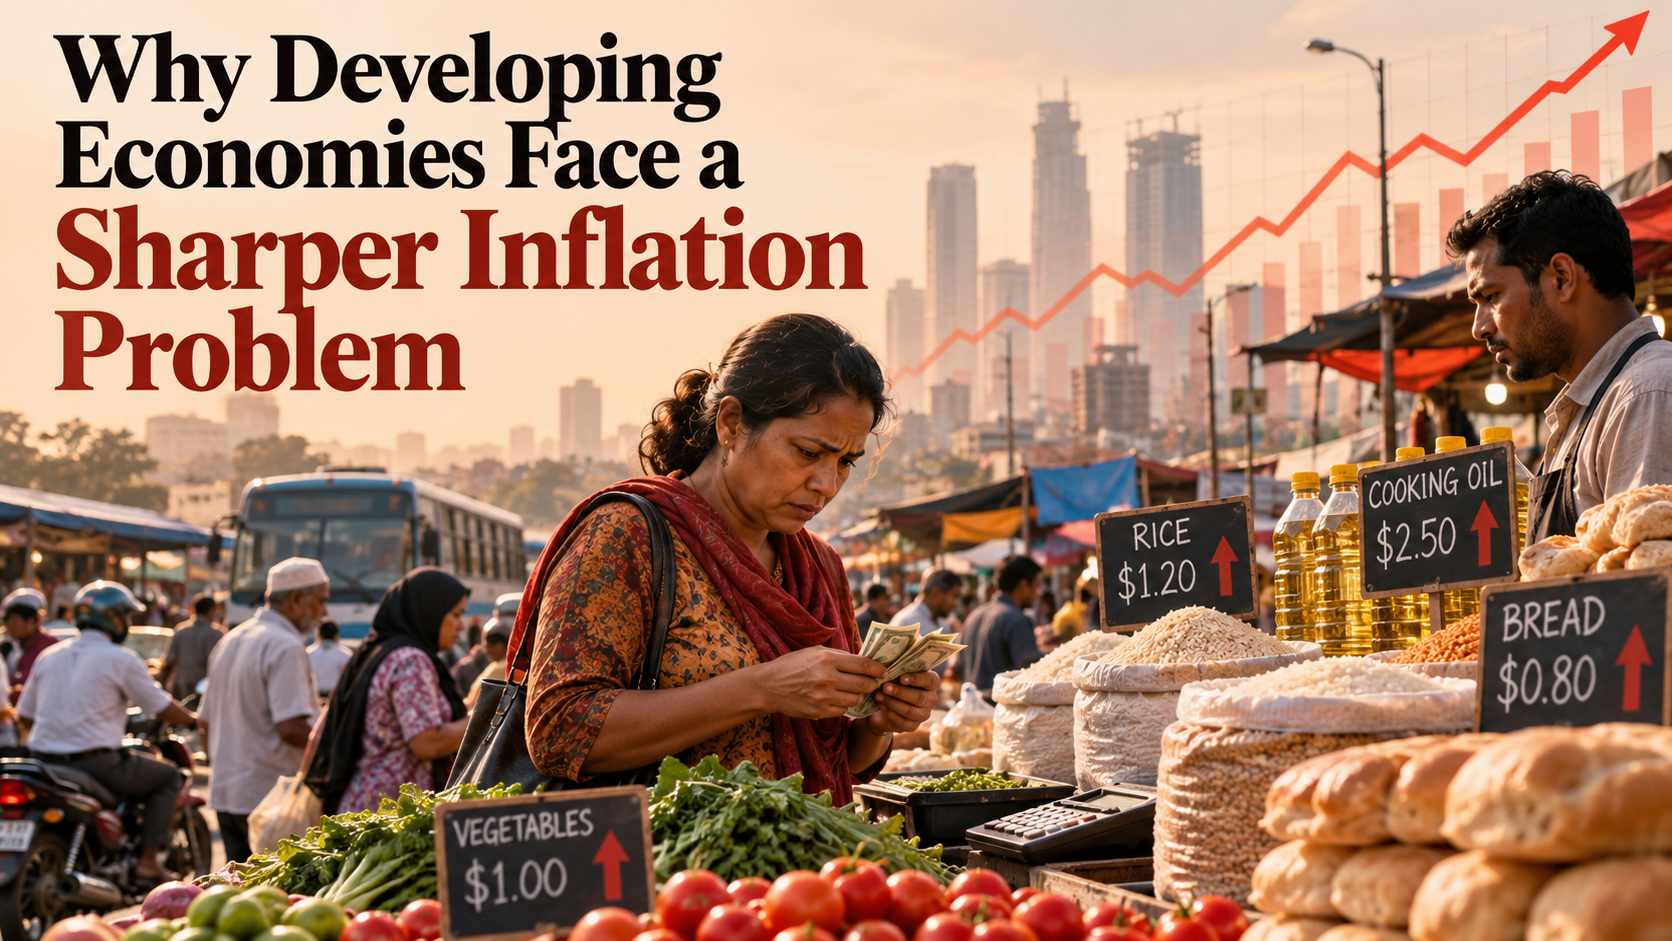
Inflation hurts developing economies more severely when basic necessities take up more of household budgets, imported energy becomes expensive and public finances leave little room for protection. The challenge in 2026 is not simply that prices are rising. It is that lower-income governments often have fewer credible tools for insulating people without creating additional inflation, debt or currency pressure.
The UN’s mid-2026 economic update projected developing-economy inflation at 5.2% in 2026, up from 4.2% in 2025. The IMF’s October World Economic Outlook forecast global inflation at 4.7% for 2026 and 4.1% in 2027. These figures cover different groups and forecast vintages; they should not be treated as competing estimates of the same statistical series.
Key takeaways
- Developing-economy inflation reflects exposure to food, fuel, exchange rates and local supply constraints.
- A drop in inflation usually means prices rise more slowly—not that the cost of living returns to old levels.
- Broad price controls can be far more expensive than time-limited support to vulnerable households.
- Monetary tightening alone cannot repair a disrupted energy corridor or an inefficient distribution network.
- Pakistan needs coherent monetary, fiscal, energy and social-protection policies rather than one isolated anti-inflation measure.
Why the same oil shock has different social costs
Suppose international diesel prices rise. Freight companies face higher fuel costs, farmers may pay more for machinery and irrigation, and producers must move goods to wholesale markets. Retail prices depend on competition, taxes, exchange rates and how much of the cost firms can absorb. The process is neither instantaneous nor identical across products.
In a country where a large share of disposable income already pays for food, transport and essential utilities, a modest increase in those categories can crowd out health, education and savings. A wealthier household has more discretionary expenditure to reduce. Inflation is therefore a distributional event, not just a movement in the consumer-price index.
The UN DESA mid-2026 assessment identifies energy disruptions as a threat to development financing and household purchasing power. High international fuel prices can raise an import bill even where domestic demand is not especially strong. A response built entirely around slowing demand may tackle some second-round price pressures while leaving the root supply shortage untouched.
The four transmission channels
Imported energy and fertilizer
Energy enters production costs, shipping rates, power generation and many food supply chains. Fertilizer prices affect agriculture, while transport costs affect food distribution. If the economy depends on imported inputs, the external price shock is multiplied by currency conditions and domestic tax arrangements.
Exchange rates and foreign-currency financing
Importers commonly need foreign currency to pay suppliers. A depreciation can increase local-currency costs even if international commodity prices are unchanged. Conversely, a stable currency can reduce the immediate pass-through of external price movements, although it cannot remove shortages in global supply.
Domestic bottlenecks
Electricity losses, inefficient storage, weather disruption, transport constraints and weak competition can keep local prices elevated after international benchmarks retreat. Inflation control therefore needs improvements in market infrastructure, not just central-bank statements.
Inflation expectations and wages
Workers negotiate pay based on past and expected living costs; firms choose prices based on anticipated inputs and consumer demand. When expectations become unanchored, a one-time supply shock may lead to more persistent inflation. Credible institutions matter because they shape expectations before every price adjustment occurs.
The cost-of-living trap
The rate of inflation and the price level are different. If a household’s essential shopping basket increases from 100 units to 110 units, prices have risen 10%. If they subsequently rise to 113.3, inflation has fallen to 3% in that second period—but the basket is still considerably more expensive than at the beginning. The example is illustrative, not a statistic about any country.
That distinction explains why people may report severe living-cost pressure while a finance ministry celebrates falling inflation. Real wages have to catch up with the accumulated price increase before purchasing power is restored. Social support may need to respond to that level effect, not just the latest monthly percentage change.
It also shapes political trust. If officials speak only of disinflation, citizens may reasonably believe their daily experience is being dismissed. Better communication would explain changes in staple prices, wage growth and household purchasing power separately.
How supply shocks get amplified by external finance
Costlier imported fuel can coincide with weaker access to international finance. A government may need more foreign exchange to pay for the same volume of energy while investors demand higher returns on its debt. The IMF’s April 2026 Fiscal Monitor explains how rising interest costs and large spending obligations have weakened fiscal resilience worldwide. The problem is particularly acute where expenditure commitments are inflexible and revenue collection is unreliable.
Energy markets can also shift by product. The IEA’s October 2026 oil assessment describes acute diesel tightness and pressure on refining economics, illustrating why inflation analysis must look beyond a single crude-oil benchmark. A shortage of transport fuel can raise food-distribution costs even when headline crude prices do not move by the same proportion.
Trade dependence matters as well. The WTO’s October trade update finds stronger goods trade alongside weaker services-trade prospects, showing that demand and supply shocks are uneven. Developing economies that import energy and export tourism services can experience an unfavorable combination while technology-equipment exporters benefit from a different global cycle.
The policy dilemma: protect prices or protect people?
When fuel prices rise, politicians face pressure to cap tariffs or subsidize consumption. This can reduce the immediately visible cost for all users, but it also makes the state responsible for a potentially large and unpredictable bill. Benefits may flow disproportionately to higher-volume users, including wealthier households and energy-intensive companies.
The IMF’s October 2026 World Economic Outlook argues for temporary, targeted income support during cost-of-living crises. Its analysis finds that price-suppressing measures can require 3 to 22 times the fiscal resources of targeted transfers. That is a finding from its policy analysis, not a promise that any one country’s programme will save a fixed amount.
A better-designed package identifies households facing serious hardship, transfers assistance through transparent channels and sets a clear duration. Where social registries are incomplete, governments should invest in them rather than treat universal subsidies as a permanent substitute for accurate targeting.
| Policy response | Immediate attraction | Principal risk | More credible safeguard |
|---|---|---|---|
| Broad fuel subsidy | Visible retail relief | High cost, leakage to large users | Time limit and published budget |
| Targeted cash transfer | Direct household purchasing power | Exclusion and delivery problems | Updated registries and appeals |
| Interest-rate tightening | Anchors expectations and demand | Slower credit and activity | Data-dependent communication |
| Exchange-rate intervention | Temporary currency stability | Reserve depletion if unsustainable | Adequate buffers and transparency |
| Energy efficiency | Lower structural import exposure | Upfront costs and long gestation | Competitive procurement and oversight |
Original policy comparison; the correct mix varies by country.
The challenge for central banks
Monetary policy affects credit conditions, demand and inflation expectations. It does not create oil or fertilizer. A central bank confronted with an energy shock must judge how much of the first-round increase will spread to other prices and wage demands. It must also consider the effect of interest rates on the exchange rate and the fiscal cost of servicing debt.
Too little action can damage credibility if inflation persists. Too much action can make already weak investment and employment conditions worse. The objective is not to eliminate every price increase, which may be impossible, but to prevent an external shock from becoming embedded in sustained domestic inflation.
The fiscal authority faces a parallel problem. Rising public borrowing costs leave less money for targeted relief. The IMF’s October assessment of sovereign yields says higher interest rates and high public debt reinforce each other. In that setting, monetary and fiscal credibility become jointly important.
Pakistan: the particular problem of overlapping shocks
Pakistan’s inflation outlook combines global energy exposure with domestic electricity costs, agriculture, logistics, exchange rates and fiscal policy. It would be a mistake to attribute every change in the consumer-price index to imported oil, or to assume that domestic monetary policy alone can fix the supply side.
In its October 7 Pakistan review statement, the IMF said headline inflation had moderated to around 10.3% in September after peaking in May. The statement also advised maintaining an appropriately tight monetary stance and making any future fuel assistance limited, time-bound and targeted. This is a specific reported observation for Pakistan—not a global figure.
The consequences for lower-income households extend beyond average inflation. Irregular income, high commuting costs and dependence on purchased food can make budget adjustment difficult. A strategy should therefore combine trusted inflation measurement with safety-net design, efficient utilities and incentives for production and employment.
What developing governments should measure
Official inflation should be complemented by food and transport subindexes, nominal and real wages, exchange-rate developments, foreign-exchange reserves, subsidy spending and progress in delivering targeted transfers. Policymakers should also monitor regional differences in prices and availability, which may reveal distribution and logistics problems concealed by national averages.
Another useful indicator is the gap between headline inflation and underlying inflation measures. Persistent core inflation after energy prices retreat can signal that expectations and domestic pricing pressures have spread. But no measure should be interpreted without understanding its construction and coverage.
What businesses and households can do
Import-dependent companies should stress-test costs under multiple currency and commodity-price scenarios, maintain realistic working capital and avoid assuming that every price increase can be passed to consumers. Exporters may experience a different combination of costs and foreign-currency revenues; their exposure should be analysed separately.
Households can benefit from clear budgeting and caution with variable-rate debt, but personal decisions depend on income stability and individual financial circumstances. Economic policy cannot transfer the full burden of a national inflation shock to family budgeting. It must address structural causes and help households that lack financial buffers.
Risks and limitations
Forecast inflation depends on future energy prices, weather, international shipping conditions and policy actions. UN estimates published in May cannot incorporate every development by October. Country-level outcomes can diverge sharply from developing-country averages; even stable inflation can coexist with a loss of purchasing power if wages lag behind prices. Targeted assistance can also miss eligible recipients when administrative systems are weak.
Frequently asked questions
Why is developing-country inflation often higher?
Greater exposure to food and fuel prices, currency movements, supply constraints and weaker policy buffers can amplify shocks. It is not a universal rule for every country.
Did the UN forecast 5.2% developing-economy inflation in 2026?
Yes, in its mid-2026 update. This is a forecast for a country group, not Pakistan’s official inflation rate.
Is 4.7% IMF inflation the figure for developing economies?
No. The IMF’s 4.7% headline forecast covers the world economy in aggregate and uses the October 2026 forecast vintage.
Do falling inflation rates mean prices are falling?
Usually not. Lower positive inflation means prices continue to rise more slowly.
Why not cap every fuel price?
Broad caps can exhaust budget resources and channel more relief to the largest users, leaving less funding for vulnerable households.
What is the most useful inflation indicator for families?
The prices of their own essential spending categories relative to household income, alongside a credible official consumer-price index.
Conclusion
The developing world’s inflation problem is more than a central-bank calculation. It is a distributional, fiscal and production challenge. Price stability remains essential, but it is strongest when accompanied by targeted household protection, dependable energy and transport systems, and policies that expand productive capacity. Suppressing the price signal without addressing those foundations can turn a temporary shock into a persistent fiscal weakness.
Discover more from The Economy
Subscribe to get the latest posts sent to your email.


Development Finance
Indonesia Navigates Mega-Project Risks as China and Russia Eye the 2,772km Trans-Kalimantan Railway
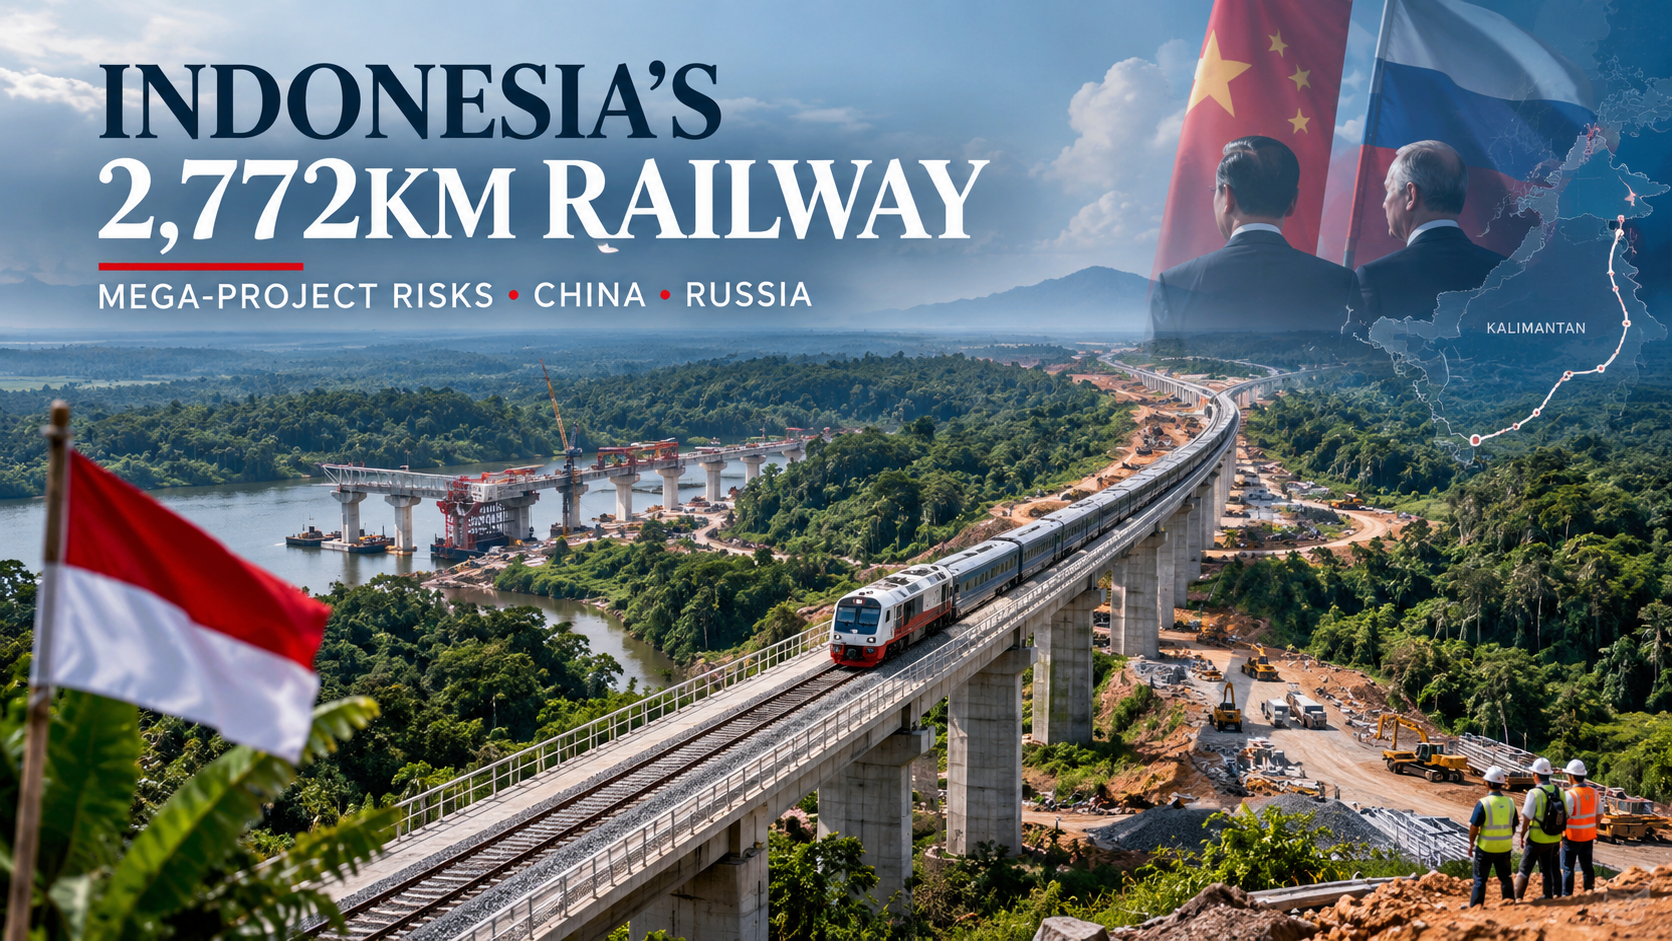
Indonesia is looking to foreign investors—primarily China and Russia—to help fund the ambitious 2,772-kilometer Trans-Kalimantan railway. The sprawling network aims to transform the resource-rich island of Borneo by vastly improving the transportation of minerals and passengers. However, as Jakarta maps out the future of its national rail infrastructure, financial hangovers from previous mega-projects are dictating a far more cautious approach to international commercial agreements.
While the completion of Southeast Asia’s first high-speed rail line between Jakarta and Bandung initially boosted confidence, its crippling cost overruns—alongside the recently stalled underground metro project in Bali—have analysts and government watchdogs warning against the unmitigated risks of foreign-backed debt traps.
The Trans-Kalimantan Vision: Minerals, Connectivity, and Foreign Capital
The Trans-Kalimantan railway is a central pillar of Indonesia’s broader National Railway Master Plan, which targets an expanded 12,100 km of operational railways by 2030. The initial phases aim to construct a 730-kilometer rail link connecting South, Central, and East Kalimantan. The railway will be crucial for the logistical transport of commodities and will eventually integrate with Indonesia’s new capital city, Nusantara.
According to statements by Indonesia’s Transportation Minister, Dudy Purwagandhi, the government is actively exploring foreign investment to shoulder the immense costs of the undertaking. Both Beijing and Moscow have expressed strong interest in the project, seeing it as a prime opportunity to deepen their economic footprint in Southeast Asia.
However, attracting the capital is only half the battle. Negotiating terms that protect Indonesia’s sovereign and economic interests is where the true challenge lies.
The “Whoosh” Warning: High-Speed Rail’s Lingering Debt
If Jakarta needs a blueprint on what to avoid, it only has to look at “Whoosh”—the Jakarta-Bandung high-speed rail. Originally championed as a symbol of Indonesian modernization and a flagship of China’s Belt and Road Initiative, the project broke ground in 2016 with an estimated price tag of $5.5 billion.
By the time it became operational in late 2023, complications ranging from delayed land acquisitions to the COVID-19 pandemic pushed the total project cost past $7.2 billion. The resulting cost overruns of between $1.2 billion and $1.9 billion forced Indonesian state-owned entities to take on heavy financial burdens.
Furthermore, lower-than-anticipated passenger revenues have generated operating losses reaching roughly $258 million in 2024, placing massive pressure on the state rail operator Kereta Api Indonesia (KAI). The high 3.4% interest rate on refinancing loans has triggered widespread domestic criticism and prompted the current administration to push for immediate debt renegotiations with Beijing. The “Whoosh” debacle demonstrates the acute fiscal vulnerability of heavy reliance on a single foreign creditor.
Bali’s Stalled Underground Metro
Concerns over foreign-funded infrastructure are not limited to Java. The highly publicized Bali Urban Subway (Bali Metro) provides another fresh cautionary tale regarding the viability of international megaproject investments.
Conceived as a solution to Bali’s crippling tourist traffic, the underground rail network held a high-profile groundbreaking ceremony in September 2024, backed by anticipated funding from Chinese and South Korean investors. However, as of late 2026, the project has suffered from zero visible progress. Facing an exorbitant estimated price tag of $20 billion and a stark lack of private investment commitment, the Bali provincial government was forced to abandon the underground design entirely in August 2026, pivoting to a much cheaper above-ground Light Rail Transit (LRT) alternative instead.
The abrupt stalling of the Bali Metro highlights the friction between grand infrastructure proposals and the harsh reality of foreign investor risk appetite—particularly when complex land acquisition and local topography are involved.
Strategic Caution Moving Forward
As Indonesia brings China and Russia to the negotiating table for the Trans-Kalimantan railway, it will likely prioritize rigorous feasibility studies, diversified funding models, and strict caps on state budget exposure.
Jakarta is learning that while international capital can expedite its transition into a modern economic powerhouse, the fine print of these multi-billion-dollar deals will determine whether these railways become engines of growth—or generations of debt. To successfully execute the Trans-Kalimantan railway, Indonesia must strike a delicate balance: leveraging foreign technological and financial muscle while fiercely protecting its domestic financial stability.
Discover more from The Economy
Subscribe to get the latest posts sent to your email.
Analysis
DBS Surges to Two-Month High After Q1 2026 Earnings Beat: Why Singapore’s Wealth Powerhouse Is Rewriting the Rate-Headwind Playbook
Singapore’s largest bank just delivered a quiet masterclass in strategic reinvention — and the market noticed.
The trading floor at Marina Bay Financial Centre opened on April 30 with a familiar tension: earnings season for Singapore’s big three banks, geopolitical noise from the Middle East, and a rate environment that refuses to cooperate. By mid-morning, DBS Group Holdings (SGX: D05) had answered the most pressing question. Its shares surged as much as 4.3% toward S$59, touching their highest level since early February 2026, after the bank reported first-quarter net profit of S$2.93 billion — a figure that exceeded the Bloomberg consensus estimate of S$2.88 billion and signaled something more significant than a routine beat: a structural pivot, years in the making, finally delivering at scale.
For those tracking the evolution of Asian banking, DBS’s Q1 2026 results are less a quarterly report than a proof of concept. When interest rates began their long descent from peak levels, the conventional wisdom held that Singapore’s lenders — deeply dependent on net interest income — would bleed margin. DBS has spent the better part of three years engineering a different outcome.
What the Numbers Actually Say: Anatomy of a Record Quarter
DBS’s Q1 2026 net profit reached S$2.93 billion, up 1% year-on-year and a robust 24% quarter-on-quarter, as strong wealth management and treasury performance offset lower interest margins. Total income achieved a record S$5.95 billion, up 1% year-on-year and 12% quarter-on-quarter, driven by robust fee income and treasury sales.
Flat year-on-year headline growth might tempt a casual reader to shrug. That would be a misreading. Strip away the rate-drag math, and the underlying quality of the quarter is striking:
- Net interest income declined 7% to S$3.48 billion during the period, weighed by heightened economic uncertainty and tighter monetary conditions.
- Net interest margin fell to 1.89%, narrowing 23 basis points year-on-year as SORA and HIBOR rates declined and the Singapore dollar strengthened. On a quarter-on-quarter basis, NIM compressed only four basis points, and group net interest income was little changed on a day-adjusted basis, as rate pressures were offset by hedging and balance sheet growth.
- Commercial book net fee and commission income increased 16% to S$1.48 billion. Wealth management fees hit a record S$907 million, driven by higher investment product sales and bancassurance.
- Profit before tax rose 2% year-on-year to S$3.51 billion, while return on equity held at a healthy 17%.
In blunter terms: DBS lost roughly S$240 million in annualized net interest income to rate compression, then proceeded to replace that and more through fee-based businesses. That is not a coincidence. It is a deliberate strategic architecture producing measurable results.
Why DBS Outperformed Expectations Despite NIM Pressure
The headline question for anyone following Singapore banking in 2026 is simple: how does a bank grow total income in a falling-rate environment? DBS’s answer involves three interlocking engines.
First, the wealth management machine is now genuinely world-class. Record fees of S$907 million in a single quarter represent a trajectory that would have seemed improbable five years ago. DBS’s wealth AUM reached S$488 billion at the end of 2025, and fee capture rates have risen as the bank has deepened its investment product suite and expanded its private banking capabilities. The bank has benefited from a structural tailwind that transcends quarterly noise: the accelerating concentration of private wealth in Asia, particularly among Chinese entrepreneurial families diversifying assets out of Hong Kong, Indian ultra-high-net-worth clients seeking Singapore domicile, and Indonesian conglomerates repatriating capital in a less predictable regional environment.
Second, treasury customer sales have emerged as a genuine earnings buffer. Volatile markets — driven by the Iran war, erratic U.S. tariff policy, and currency dislocations — have paradoxically been good for DBS’s treasury franchise. Corporate and institutional clients hedging currency and rate exposures have generated elevated transaction volumes, and DBS’s market-making infrastructure has translated that activity into fee and trading income. This is a business that benefits from complexity, not calm.
Third, deposit growth and hedging are doing surprisingly effective work on the NIM line. Management now assumes interest rates will remain at current levels — versus its earlier assumption of two Fed rate cuts — with the impact of greater rate headwinds on group net interest income largely mitigated by deposit growth, now expected to be in the high single-digit range, and ongoing hedging activities. That is a materially more conservative rate assumption than most peers are running, and DBS is still guiding for stable total income. The implication: the downside scenario is already baked into management’s thinking.
The Dividend Story: S$0.81 Per Quarter, and Why It Matters
For the income investor, the dividend announcement is the centerpiece of this earnings release. The board declared an interim dividend of S$0.66 per share and a capital return dividend of S$0.15 per share for Q1 2026, in line with the previous quarter. This brings the annualized total dividend to S$3.24 per share. Management has previously reaffirmed that the capital return dividend of S$0.15 per quarter will be maintained through 2026 and 2027.
Based on the closing price of S$56.56 as of April 29, 2026, this implies a dividend yield of approximately 5.7%. Post-earnings, with the stock trading closer to S$59, that yield moderates toward 5.5% — still among the most generous in the developed Asian banking universe.
The sustainability of this payout is underpinned by genuine capital strength. DBS’s CET1 ratio remains well above regulatory minimums, and the bank’s return on equity of 17% is generating capital faster than it can be deployed at equivalent returns. The capital return dividend — a structure DBS introduced to systematically distribute surplus capital — is, in effect, a managed excess-capital release mechanism. It signals that management sees no transformational acquisition on the near horizon that would absorb this capital, which is itself information.
DBS vs. OCBC and UOB: Comparative Edge in Wealth and Scale
Singapore’s banking sector operates as an oligopoly of three exceptionally well-run institutions. Comparing them illuminates where DBS’s competitive advantage is genuinely differentiated and where the narrative may be overstated.
| Metric (Latest Available) | DBS | OCBC | UOB |
|---|---|---|---|
| FY2025 Net Profit | S$11.03B | Record | S$4.68B |
| Wealth AUM | S$488B | S$343B | S$201B |
| Q1 2026 NIM | 1.89% | ~1.92% | ~1.75–1.80% (guided) |
| Annualized Dividend Yield | ~5.5–5.7% | ~4.3% | ~mid-4s% |
| ROE | 17.0% | 12.6% | ~12% |
OCBC has quietly become the standout among Singapore’s three local banks in terms of 2026 share price performance, hitting an all-time high in April 2026 and touching a record of S$22.83 on April 2, 2026, taking its market capitalisation above S$100 billion for the first time. OCBC’s advantage lies in its insurance engine through Great Eastern and a wealth platform — Bank of Singapore — that has delivered the strongest percentage AUM growth among the three. OCBC’s broader wealth management income reached a record S$5.6 billion and made up 38% of total income, up from 34% a year earlier.
UOB, meanwhile, remains the most rate-sensitive of the three. Its NIM guidance of 1.75–1.80% reflects greater exposure to conventional lending spreads, and its fee business — while growing — has yet to achieve the scale needed to offset margin compression at DBS or OCBC levels.
Where does DBS’s edge lie, then? Scale, franchise quality, and the self-reinforcing flywheel of AUM growth. At S$488 billion in managed assets, DBS is generating wealth management fees that dwarf its peers. Its digital banking infrastructure — recognized repeatedly by Euromoney and Global Finance as world-class — allows it to serve mass affluent and private banking clients at a cost efficiency that smaller platforms cannot replicate. The bank’s credit ratings of AA- (S&P) and Aa1 (Moody’s) are among the highest of any bank globally outside the Swiss franchise, which matters enormously for institutional counterparty relationships and wholesale funding costs.
DBS leads with FY2025 net profit of S$11.03 billion and ROE of 16.2%, far ahead of ASEAN peers.
What Lower Rates Mean for Singapore Banks in 2026
Can fee income permanently replace the lost NIM income? This is the foundational question for Singapore banking equity investors in 2026.
The short answer is: partially yes, structurally, and more so for DBS than for its peers. But the math is not frictionless.
Every 10 basis point decline in NIM costs DBS roughly S$130–150 million in annual net interest income, based on its approximate loan book scale. Offsetting that requires sustained double-digit fee income growth — achievable, but not guaranteed in every quarter. Market-dependent fee streams (wealth management, investment banking, treasury) can disappoint badly in risk-off environments. The first quarter of 2026 was not risk-off; geopolitical anxiety about the Iran war appears to have driven client hedging activity and safe-haven AUM inflows into Singapore — a perverse benefit for DBS’s franchise.
DBS maintained its FY2026 guidance of total income to be around 2025 levels despite continued rate headwinds and heightened geopolitical uncertainty. Commercial book non-interest income is still expected to grow at high single-digit rates, with management flagging potential upside if market sentiment improves.
That is a deliberately conservative stance — and it is the right one. Management teams that over-promise on fee income trajectory in rate-transition environments tend to disappoint badly when markets turn. DBS’s guidance framing effectively sets a floor with a visible upside scenario, which is exactly how credible institutional investor relations communication should work.
Geopolitics as Both Risk and Catalyst: The Iran Variable
One of the more nuanced aspects of this earnings story is the Iran war’s dual role in DBS’s operating environment. The conflict — which has disrupted shipping lanes, elevated energy prices (crude oil trading near $105 per barrel as of April 30, 2026), and driven a flight-to-quality in global capital flows — has simultaneously increased credit risk in certain sectors and driven wealth inflows into Singapore’s perceived safe-haven financial ecosystem.
DBS management noted in its earnings statement that “while the Iran war and its potential second-order effects have added uncertainty to the outlook, our stress tests indicate that our credit portfolio remains sound.”
Asset quality remains reassuringly stable. The NPL ratio was stable at 1%, unchanged quarter-on-quarter. Specific provisions (ECL3) were 31% higher year-on-year but significantly lower quarter-on-quarter, and at 14 basis points of total loans — an entirely manageable level.
The geographic concentration of DBS’s loan book — predominantly Singapore, Hong Kong, and ASEAN — provides less direct exposure to Middle Eastern commodity credits or European leveraged finance, where stress is more visible. That said, a prolonged conflict-driven energy price shock would feed into inflation dynamics globally, complicate the Fed’s rate path, and potentially reverse some of the rate-cut assumptions embedded in DBS’s hedging strategy.
The ASEAN Wealth Boom: Why DBS Is Structurally Positioned for the Next Decade
Singapore’s emergence as the undisputed wealth management hub of Asia is not an accident, nor is it a temporary phenomenon. It reflects deliberate government policy, legal system reliability, tax competitiveness, and geographic centrality in a region generating unprecedented private wealth. The numbers are staggering: Asia-Pacific is projected to account for the largest share of global HNWI wealth growth through the end of the decade.
DBS sits at the intersection of three critical wealth migration corridors: Chinese entrepreneurial capital seeking offshore diversification post-2020, Indian ultra-HNW families consolidating multi-generational wealth in Singapore family offices, and Indonesian and Malaysian conglomerates professionalizing their balance sheets through Singapore-domiciled holding structures. For each of these client categories, DBS’s regional franchise — with operations across 18 markets — provides the cross-border infrastructure that standalone private banks cannot replicate.
The bank’s investment in digital onboarding, AI-driven investment advisory tools, and its digibank platform for mass affluent clients in India and Indonesia positions it to capture the next wave of wealth accumulation at margins that traditional relationship-banking models cannot achieve at scale.
This is what the S$907 million wealth management fee quarter represents: not just strong performance in one period, but the maturation of a decade-long franchise-building exercise.
Counterpoints: Why the Stock Reaction May Moderate
A rigorous analysis demands engagement with the bear case.
Valuation is not cheap. At approximately S$59 post-earnings, DBS trades at roughly 2.4x book value and 14–15x forward earnings — a meaningful premium to ASEAN banking peers and broadly in line with OCBC’s current premium multiple. DBS’s price-to-book ratio is higher than its peers’, so its valuation could be hurt if it disappoints in continuing to deliver ROE above its peers. At 17% ROE, the premium is justifiable — but it leaves little room for earnings misses.
NIM compression is not finished. The move from 2.12% to 1.89% year-on-year is significant, and the hedging strategy that has buffered further decline is not infinitely scalable. If SORA rates decline more sharply than current assumptions, or if deposit pricing proves stickier than expected, NIM could surprise to the downside.
Wealth fee volatility is real. The record S$907 million quarter was partly a function of elevated market activity. In genuinely risk-off quarters — sharp equity drawdowns, credit spread widening — investment product sales contract. DBS’s fee income is structurally higher than five years ago, but it is not immune to cyclical pressure.
The Iran war tail risk remains unquantified. A broader regional escalation, disruption to Asian shipping lanes, or a spike in energy prices that triggers a global growth slowdown would stress all of these fee income assumptions simultaneously.
Strategic Investor Takeaways
For long-term dividend income investors, DBS at a 5.5–5.7% yield — with a capital return dividend explicitly committed through 2027 — remains one of the most attractive risk-adjusted income positions in the Singapore equity universe. The payout is backed by 17% ROE and capital ratios that are comfortably above regulatory requirements. The dividend is not under threat in any plausible base-case scenario.
For total return investors, the path to meaningful share price upside requires either a re-rating of the wealth franchise (plausible if AUM growth continues to accelerate), a recovery in NIM to the 1.95–2.00% range (which would require rate stabilization or reversal), or a sustained re-rating of Singapore financial equities by global asset allocators as ASEAN becomes a larger weight in emerging market and Asia-Pacific mandates.
For institutional investors benchmarking against regional peers, DBS’s ROE advantage over ASEAN banking peers of 400–500 basis points is durable and reflects genuine franchise quality rather than leverage. The bank’s AA- rating and conservative provisioning culture make it a core holding in any Asia-Pacific financial sector allocation.
The consensus 12-month price target for DBS sits near S$61–68, implying meaningful upside from current levels even after today’s surge — though the wide range reflects genuine uncertainty about the NIM trajectory and geopolitical tail risks.
Conclusion: Resilience Is Not a Quarterly Accident
DBS’s Q1 2026 earnings beat is best understood not as a positive surprise relative to a consensus model, but as validation of a strategic thesis that has been building for years. Singapore’s largest bank has successfully navigated the most challenging interest rate transition in a decade by investing, methodically and at considerable cost, in fee-based businesses that are now large enough to matter at the group level.
The record wealth management fees, the resilient asset quality, the disciplined capital management, and the maintained dividend all tell the same story: this is an institution that has internalized the lesson that rate cycles are temporary and franchise quality is permanent.
As a long-time observer of Asian banking, I have watched DBS transform from a predominantly Singapore-centric retail lender into a genuinely regional wealth and institutional banking franchise. What the Q1 2026 numbers confirm is that the transformation has reached the point where it is visible in the income statement, not just the strategy slides.
Whether the stock sustains its two-month high depends on the variables DBS cannot control: the rate path, the Iran conflict’s evolution, and the global appetite for risk assets. What it can control — credit discipline, wealth franchise growth, capital allocation, and digital infrastructure investment — it is managing about as well as any bank in Asia.
For investors wondering whether this earnings beat changes the DBS thesis: it doesn’t change it. It confirms it.
Key Data Summary
| Metric | Q1 2026 | Year-on-Year Change |
|---|---|---|
| Net Profit | S$2.93 billion | +1% YoY, +24% QoQ |
| Total Income | S$5.95 billion (record) | +1% YoY, +12% QoQ |
| Profit Before Tax | S$3.51 billion | +2% YoY |
| Net Interest Income | S$3.48 billion | -7% YoY |
| Net Interest Margin | 1.89% | -23bps YoY |
| Wealth Management Fees | S$907 million (record) | — |
| Fee & Commission Income | S$1.48 billion | +16% YoY |
| Return on Equity | 17.0% | — |
| NPL Ratio | 1.0% | Stable |
| Dividend Per Share | S$0.81 | — |
| Annualized Dividend | S$3.24 | ~5.5–5.7% yield |
Discover more from The Economy
Subscribe to get the latest posts sent to your email.

The call came, as these things often do, without warning. A seasoned equity partner at one of the Big Four — two decades of late nights, cross-border engagements, client dinners, and carefully cultivated relationships distilled into a six-figure “units” allocation — was summoned for what was framed as a career conversation. The language was collegial, the room was quiet. And then, politely but unmistakably, the message landed: you will no longer share in the firm’s profits. We are moving you to a salaried partner role.
No performance improvement plan. No transparent benchmark they had failed to meet. Just the quiet arithmetic of a partnership that needed fewer people at the table.
This is not an isolated anecdote. According to reporting by the Financial Times, both KPMG and EY have in recent years removed members of their UK equity partnerships and instead offered them “salaried partner” roles — a demotion wrapped in the same title, drained of its financial substance. And on April 23, 2026, the story took on transatlantic dimensions: KPMG announced it was cutting roughly 10% of its US audit partners — approximately 100 individuals — after years of failed voluntary retirement programmes. The message to the profession has never been louder: the partnership is no longer a destination. It is, increasingly, a temporary assignment.
The Golden Ticket, Tarnished
For generations, making partner at a Big Four firm was the legal and financial world’s closest equivalent to a tenured professorship. You had, in the popular imagination and in contractual reality, arrived. The equity partnership conferred ownership, profit-sharing, prestige, and an implicit understanding that barring catastrophic misconduct, your position was secure until mandatory retirement. It was, in the language of another era, a job for life.
That compact is dissolving — not with a dramatic rupture, but through a series of quiet institutional manoeuvres that, taken together, signal a structural reorientation of how these firms are governed, whom they reward, and what professional excellence is now expected to deliver.
The statistics are unambiguous. Big Four partner promotions across the UK fell to just 179 in 2025, a five-year low and a sharp retreat from the 276 promoted at the peak of the post-pandemic boom in 2022, according to analysis by the Financial Times of Companies House filings, press releases, and LinkedIn data. EY elevated only 34 equity partners, down from 74 in 2022. Deloitte made just 60 promotions, against 124 in 2022. Overall, the total number of equity partners across the four firms fell for the first time in five years, dropping by roughly 80 to approximately 3,050.
The belt-tightening is deliberate, and its beneficiaries are the incumbents. KPMG’s average UK partner pay reached £880,000 in 2025 — an 11% year-on-year increase — putting it ahead of both PwC (£865,000) and EY (£787,000) for the first time since 2014. Deloitte partners crossed the £1 million threshold. Revenue, meanwhile, has barely moved: EY reported 2% growth in what it called a “challenging market”, while KPMG posted just 1% growth after 9% in 2023, and Deloitte suffered its first annual revenue decline in 15 years.
The mechanism is elementary. When you constrain the denominator — fewer equity partners sharing the profit pool — the numerator rises for those who remain. Profit-per-equity-partner (PEP) is the prestige metric in professional services, the figure that determines lateral hire competitiveness, graduate recruitment marketing, and the partner’s own sense of institutional worth. And right now, the Big Four are protecting it with considerable ruthlessness.
Demotion Without Firing: A New Instrument of Control
What distinguishes the current moment from previous cycles of partner attrition is not the reduction in numbers per se — firms have always managed their equity pools — but the instrument being used. The introduction of a salaried or “non-equity” partner tier creates a new, lower rung on the ladder that can be used not merely as a holding pen for promising directors, but as a landing zone for underperforming incumbents.
Deloitte, EY, and KPMG have all introduced this salaried partner tier, widely regarded in the industry as a mechanism for retaining senior staff without sharing profits. PwC, the only firm still operating an equity-only partnership, has created a “managing director” grade as its structural equivalent. The title is preserved; the economics are fundamentally altered.
In the case of KPMG’s UK operation, multiple people with knowledge of the matter told the Financial Times that partners were called into rooms for what were “positioned as career conversations” but were in reality mechanisms to reduce equity partner headcount. Some received the news with little warning, having been given positive performance feedback until the conversation itself. Several chose to leave rather than accept what they experienced as a demotion, describing the process as blindsiding.
EY, meanwhile, has demoted a small number of equity partners to salaried roles since introducing the tier in 2022, according to three people familiar with the matter. The firm declined to comment.
To be clear, “departnering” is not unique to accountancy. Goldman Sachs has long managed partner membership with clinical precision; law firms regularly de-equitise underperforming partners, particularly in mid-tier practices. But the cultural signal from the Big Four is significant precisely because of the scale, the prestige mythology, and the professional pipeline implications. These are the firms that recruit tens of thousands of graduates annually on the implicit promise of a meritocratic climb toward a life-altering outcome.
Why Now? Three Interlocking Forces
1. The Consulting Hangover
The pandemic generated an extraordinary and, in retrospect, unsustainable surge in demand for advisory services. Governments needed economic modelling, corporations needed digital transformation, boards needed risk assessment. The Big Four expanded headcount aggressively. By 2022, PwC was promising to add 100,000 staff globally; KPMG was promoting equity partners at a rate it could not sustain.
The hangover has been severe. PwC’s revenue growth slowed to 2.9% in fiscal 2025, down from 9.9% in 2023. Consulting revenues have contracted across the sector as clients, now operating in a tighter macro environment, question the value of expensive advisory mandates. James O’Dowd, managing partner at Patrick Morgan, told City AM that the firms are “cutting jobs to protect partner profits and rebalance bloated teams” after years of aggressive post-pandemic hiring.
2. AI Restructuring the Audit Architecture
Perhaps more structurally significant than the revenue cycle is the accelerating role of artificial intelligence in reshaping what partners actually do. KPMG launched its Workbench multi-agent AI platform in June 2025, developed with Microsoft, connecting 50 AI agents with nearly 1,000 more in development. EY granted 80,000 tax staff access to 150 AI agents through its EY.ai platform, investing more than $1 billion annually in AI platforms and products. Deloitte struck a deal with Anthropic to deploy Claude AI to its 470,000 employees worldwide.
The point is not that AI will replace partners tomorrow. It is, rather, that the work historically required to justify a partner’s existence — managing audit workflows, overseeing large teams of junior staff performing repetitive compliance tasks, supervising structured data review — is increasingly automated. KPMG acknowledged as much in its US announcement, noting that artificial intelligence is “increasingly handling key steps of audits, spurring firms to rethink staffing and delivery”. At PwC, leadership has indicated that new hires will be doing the work of managers within three years, supervising AI rather than performing the audit tasks themselves.
This compression of the value chain has a direct implication for partner economics. If AI can execute the audit procedures that previously required six team members, you need fewer partners to supervise them. The case for a large partnership structure becomes harder to make.
3. The Future-Revenue Problem
Laura Empson, professor of management at Bayes Business School, has articulated the third driver with particular precision. The question being asked of potential partners has shifted from “can you generate enough business this year?” to something more existential: “Will this person generate a substantial stream of income for the foreseeable future — and right now the future is particularly hard to foresee?” A director with a strong practice in regulatory compliance was, five years ago, a safe bet. Today, as AI takes on compliance automation and regulatory technology firms encroach on traditional advisory turf, the projection is far murkier. The firms are not just managing the present — they are hedging against futures they cannot yet model.
Winners, Losers, and the Long Game
The winners in this restructuring are, in the near term, the incumbent equity partners who remain. By shrinking the pool and reweighting units toward rainmakers — under KPMG’s current leadership, the firm has reallocated profit units to place less weight on tenure and more on business generation — the firms are concentrating extraordinary wealth among a smaller group. KPMG’s UK partners, who were earning £816,000 on average in 2025’s reporting cycle and £880,000 in the most recent period, now out-earn their counterparts at EY for the first time in a decade.
The losers are harder to count but easier to identify. The most acute damage falls on the cohort of ambitious directors and senior managers who have spent a decade or more building toward equity partnership as their defining professional objective. James O’Dowd of Patrick Morgan noted that whereas 20 years ago, Big Four employees could make equity partner by around 35, they are now looking at their early 40s — if they get there at all. The salaried partner tier is, for many, not a staging post but a terminus.
There is also a diversity dimension that deserves sharper scrutiny than it typically receives. Research consistently shows that informal sponsorship, visibility networks, and the “cultural fit” judgements that govern partnership decisions tend to replicate existing demographic profiles. When promotion cycles compress and the bar rises, historically underrepresented groups — women, minorities, first-generation professionals — disproportionately absorb the attrition. The firms publish annual diversity data with admirable transparency; whether that transparency translates into accountability when the pressure is on remains a live and uncomfortable question.
More troubling still is the impact on institutional knowledge. Partnership models, whatever their flaws, created an incentive for long-term relationship stewardship. A partner who owned the firm had reasons to invest in client relationships, mentorship, and institutional culture that extended well beyond the quarterly cycle. When you strip equity from people who have spent twenty years building domain expertise, you create a class of high-skilled employees with diminished loyalty and a market incentive to take their networks elsewhere — to boutiques, to in-house roles, to competitors offering better economics. The knowledge transfer implications are real.
The Contrarian View: Are They Trading Resilience for Returns?
Here is the question the managing partners are not asking loudly enough: does concentrating profits in fewer hands make these firms better, or merely more profitable in the short term?
There is a credible argument that what looks like strategic discipline is actually a structural fragility in the making. The Big Four derive much of their value not from capital but from trust — the trust that a client places in an auditor’s independence, the trust that a regulator places in a firm’s quality controls, the trust that markets place in a signed opinion. That trust is accumulated slowly, through relationships, through institutional memory, through the kind of deep sectoral expertise that takes years to develop.
When you compress the partner class aggressively, you signal to the broader professional pipeline that the implicit social contract has changed. Junior auditors at KPMG UK, earning around £32,500 as new graduates while partners take home nearly £880,000, are already observing a ratio that strains credulity as a meritocratic proposition. Removing overtime pay for busy season, shrinking the equity pool, and quietly demoting long-tenured partners does not create the conditions for the recruitment and retention of the next generation of exceptional audit professionals.
There is also the audit independence question. The Financial Reporting Council and its international equivalents have long expressed concern that commercial pressures on audit firms compromise the independence of judgment that audits require. A partnership model explicitly oriented toward protecting PEP — where the primary signal of success is partner compensation rather than audit quality — does not obviously serve the public interest that audit is meant to protect.
What Comes Next: Three Scenarios for the Profession
The optimistic scenario holds that these are rational adjustments to a structural oversupply of partners accumulated during an anomalous boom period, and that AI will simultaneously create new value — in AI assurance, ESG verification, regulatory technology — that supports a leaner but higher-margin partnership in the medium term. EY’s vision of a “service-as-a-software” commercial model, where clients pay by outcome rather than hour, might indeed generate the next platform for partnership growth.
The bearish scenario holds that compression of the talent pipeline, combined with AI-driven commoditisation of core services, will accelerate the fragmentation of the Big Four’s market position. Boutique advisory firms, technology-native audit platforms, and specialist consultancies are already capturing the mid-market segments where the Big Four’s scale is a disadvantage rather than an asset. If the firms price themselves out of the talent market by narrowing the partnership pathway, the talent goes elsewhere — and so, eventually, do the clients.
The structural scenario — and the one with the most historical precedent — is that this marks not a temporary adjustment but a permanent restructuring of what professional partnership means. The partnership model of the 20th century was predicated on human capital scarcity: expertise was concentrated in senior people, and those people needed to be economically incentivised to stay. AI erodes that logic. The next model may look less like a traditional partnership and more like a technology firm with a professional services overlay — equity concentrated at the top, a salaried technical workforce in the middle, and an AI infrastructure doing much of the work below.
For Aspiring Partners, Directors, and Regulators
If you are a director or senior manager at a Big Four firm reading this, the strategic implication is uncomfortable but clear: the pathway to equity partnership is narrower, later, and more uncertain than at any point in the past two decades. The hedge is diversification — cultivating expertise in areas where AI augments rather than replaces human judgment (regulatory navigation, complex cross-border transactions, AI assurance itself), and building client relationships that are genuinely portable. The salaried partner tier may, for some, represent a viable and well-remunerated alternative. For others, the boutique and in-house markets have never been more attractive.
For regulators, the questions are structural. Does the concentration of equity in fewer, higher-paid partners improve or compromise audit quality? Do the oversight frameworks that govern partnership conduct need updating to reflect the new realities of AI-assisted audit and performance-managed equity pools? The FRC and PCAOB have the tools to ask these questions. The political will to pursue them publicly is another matter.
For the firms themselves, the most important question may be one they are reluctant to examine: is the protection of partner compensation a strategy, or a symptom? A strategy would involve investing in the next generation of talent and expertise with the same vigour applied to protecting the equity pool. A symptom would be the short-term extraction of value from a franchise whose long-term competitive position is quietly eroding.
The Covenant, Rewritten
There is a moment, in the mythology of professional services, when a young accountant or consultant first allows themselves to imagine making partner. It is a moment of ambition and delayed gratification — the belief that if you are good enough, disciplined enough, client-focused enough, the institution will eventually reward your investment with a share in its future.
What KPMG and EY are doing — quietly, through human resource conversations in unremarkable meeting rooms — is rewriting that covenant. The reward is no longer guaranteed by longevity or even by excellence across a career. It is contingent, performance-managed, and revocable. In that sense, they are asking their most senior professionals to accept an employment relationship that the most junior associates have always known.
That may be a more honest model. It is certainly a more anxious one. And whether the profession that emerges from this restructuring will be better equipped to serve the public interest — or merely better equipped to serve the interests of those already at the top — is the defining question for the decade ahead.
Discover more from The Economy
Subscribe to get the latest posts sent to your email.

Global Maritime Hegemony: How China Secured Over 81% of All New Shipbuilding Orders

The Coming Battle Over AI, Jobs and Wages

Why Developing Economies Face a Sharper Inflation Problem

The New Geography of Trade: Are Supply Chains Coming Home?

Is AI Saving Global Growth or Creating the Next Bubble?

Global Banking Trends 2026: Digital Banks, AI and Compliance

Gold vs US Dollar vs Bitcoin in 2026: Inflation Hedge Compared

How Global Interest Rates Affect Savings, Loans and Investments

How to Invest During High Inflation: A Global Guide

Best Global Stocks to Watch in 2026: Four Sectors to Research

Pakistan’s 2027 Growth Strategy: Exports, AI, Energy and Jobs

Pakistan Economy FY2027: IMF Reform, Debt and Recovery Outlook

Global Interest Rates 2027: Risks for Pakistan’s Rupee and Debt

Energy Shock 2026–2027: Oil, Gas and Pakistan’s Economy

Crude Oil & Petroleum Market Analysis: OPEC+ Decisions and Price Forecasts

World’s Largest Economies: Ranking the Top Global Powers

Pakistan Economy 2026: Inside the SBP’s Balancing Act

Silver Price Today: Why the Xi-Trump AI Standoff Is Fueling a Safe-Haven Rally

Oil Prices 2026: Inside the Hormuz Crisis That Won’t End

Algorithmic Dogfights: Why the U.S. and China Must Establish Rules of Engagement for Autonomous Air Power

Top US Convenience Store Chains: Store Counts, EV Charging, and Sales Trends

SpaceX IPO 2026: History’s Biggest Stock Debut?

Who Is Shivon Zilis? The Neuralink Executive at the Center of the Musk–OpenAI Trial

Corporate America Faces a New Debt Test as US Borrowing Costs Surge

Global Economic Outlook 2026: 7 Forces Reshaping Markets, Trade and Business

Business Insurance: What Coverage You Actually Need and What It Costs in 2026

Is AI a Stock Bubble in 2026? What the Data Shows

Social Security Extra $90 Deposit: Who Qualifies for the October 2026 Medicare Rebate?
-

 Markets & Finance10 months ago
Top 15 Stocks for Investment in 2026 in PSX: Your Complete Guide to Pakistan’s Best Investment Opportunities
-

 Analysis8 months ago
Johor’s Investment Boom: The Hidden Costs Behind Malaysia’s Most Ambitious Economic Surge
-

 Analysis8 months ago
Top 10 Stocks for Investment in PSX for Quick Returns in 2026
-

 Banks9 months ago
Best Investments in Pakistan 2026: Top 10 Low-Price Shares and Long-Term Picks for the PSX
-

 Analysis9 months ago
Brazil’s Rare Earth Race: US, EU, and China Compete for Critical Minerals as Tensions Rise
-

 Investment9 months ago
Top 10 Mutual Fund Managers in Pakistan for Investment in 2026: A Comprehensive Guide for Optimal Returns
-

 Global Economy10 months ago
15 Most Lucrative Sectors for Investment in Pakistan: A 2025 Data-Driven Analysis
-

 Global Economy10 months ago
Pakistan’s Export Goldmine: 10 Game-Changing Markets Where Pakistani Businesses Are Winning Big in 2025