
Analysis
Six Lessons for Investors on Pricing Disaster


How once-unimaginable catastrophes become baseline assumptions
There is a particular kind of hubris that infects markets in the long stretches between catastrophes. Volatility compresses. Risk premia decay. The insurance gets quietly cancelled because it hasn’t paid out in years and the premiums feel like wasted money. Then the disaster arrives — not as a distant rumble but as a wall of water — and the entire analytical framework investors have spent years constructing turns out to have been a map of the wrong country.
We are living through one of the most instruction-rich moments in modern financial history. Since February 28, 2026, when the United States launched military operations against Iran and Tehran responded by closing the Strait of Hormuz, markets have been running a live masterclass in catastrophe pricing. West Texas Intermediate crude surged from $67 to $111 per barrel in under a fortnight — the fastest oil spike in four decades. War-risk insurance premiums on shipping through the Gulf soared more than 1,000 percent. The S&P 500 lost 5 percent in a single week, and the ECB and Bank of England are now staring down a renewed tightening scenario they spent the first quarter of 2026 insisting was off the table.
And yet — and this is the part that should make every portfolio manager uncomfortable — the analytical mistakes driving losses right now are not new. They are the same six structural errors investors have made in every previous crisis. Understanding them, really understanding them, is not an academic exercise. It is the difference between surviving the next disaster and being liquidated by it.
Key Takeaways at a Glance
- Markets price first-order disaster impacts; second- and third-order cascades are systematically underpriced
- Volatility is information; price-discovery failure is the true systemic risk — monitor private-to-public valuation spreads
- Tight CAT bond spreads signal capital crowding, not benign risk — use compression as a contrarian indicator
- Emerging market currencies and credit spreads lead developed-market pricing of global disasters
- Geopolitical risk premia decay faster than structural damage — separate the transitory from the permanent
- The best time to buy tail protection is when every indicator says you do not need it
Lesson One: Markets price the disaster they know, not the one that is compounding behind it
The economics of disaster pricing contain a fundamental asymmetry. Markets are reasonably good at incorporating a known risk — geopolitical tension, elevated VIX, stretched valuations — into current prices. What they catastrophically underprice is the second-order cascade that no single model captures.
Consider what the Hormuz closure actually detonated. Yes, oil went to $111 per barrel. Obvious. What was less obvious: the inflation feedback loop that forced investors to reprice central bank paths they had already discounted as settled. The Federal Reserve was expected to hold rates in 2026; futures now assign a 74 percent probability it does not cut at all this year. Europe’s energy import dependency made the ECB’s position worse. That transmission — from oil shock to rate-repricing to credit stress to equity multiple compression — is a chain, not a point event. Most risk models price the first link.
The academic framework for this is well established but rarely operationalised. The NBER disaster-risk literature, particularly Wachter (2013) and Barro (2006), argues that rare disasters produce risk premia that appear irrational in calm periods but are in fact the rational price of tail exposure across long time horizons. What these models miss, however, is that real-world disasters rarely arrive as clean, isolated point events. They arrive as cascades. The COVID-19 pandemic was not just a health shock — it was simultaneously a supply-chain shock, a demand shock, a sovereign-debt shock, and a labour-market restructuring shock. The Hormuz closure is not just an oil shock. It is an inflation shock, a monetary policy shock, a EM balance-of-payments shock, and an AI-investment sentiment shock, all at once.
Key takeaway: Map not just the primary disaster scenario but every second- and third-order transmission mechanism it activates. The primary impact is already partially in the price. The cascades are not.
Lesson Two: The real crisis is not volatility — it is the collapse of price discovery
Scott Bessent, the US Treasury Secretary, said something in March 2026 that deserves to be read not as politics but as a precise financial concept. Asked what genuinely frightened him after 35 years in markets, Bessent answered: “Markets go up and down. What’s important is that they are continuous and functioning. When people panic is when you’re not able to have price discovery — when markets close, when there is the threat of gating.”
Volatility is information. A price moving sharply up or down is a market doing exactly what it should: integrating new signals, adjusting expectations, clearing. The true systemic catastrophe is not a 10 percent drawdown. It is the moment when buyers and sellers can no longer find each other at any price — when the mechanism that produces prices breaks entirely.
This is not theoretical. Private credit markets are currently exhibiting exactly this dynamic. US BDCs — business development companies that provide credit to mid-market companies — have seen share prices fall 10 percent and trade 20 percent or more below their latest stated NAVs. Alternative asset managers that collect fees from these vehicles are down more than 30 percent. The public market is rendering a verdict on private valuations that the private market itself cannot yet deliver, because the private marks have not moved. There is no continuous clearing mechanism. There is no daily price discovery. There is only the last funding round — which is a negotiated fiction, not a price.
Investors who understand this distinction can do something useful with it: treat the spread between public-market pricing and private-market marks as a real-time fear gauge. When that gap widens sharply, the market is not panicking irrationally. It is pricing the absence of price discovery itself.
Key takeaway: Distinguish between volatility (information-rich, manageable) and price-discovery failure (structurally dangerous, contagion-prone). Monitor private-to-public valuation spreads as a leading indicator of the latter.
Lesson Three: Catastrophe bond complacency is always a warning, never a reassurance
In February 2026, Bloomberg reported that catastrophe-bond risk premia had fallen to levels not seen since before Hurricane Ian struck Florida in 2022. The cause was a surge of fresh capital chasing ILS yields. Managers called it a healthy market. A more honest reading is that it was a market pricing the wrong risk for the wrong reasons.
Here is the structural problem with catastrophe bonds, and indeed with most insurance-linked securities: the risk premium is set by the supply of capital chasing the trade, not by the true probability distribution of the underlying disaster. When capital floods in — as it has, driven by institutional allocators seeking uncorrelated returns — spreads compress regardless of whether the actual hurricane, flood, or geopolitical catastrophe risk has changed. The academic literature on CAT bond pricing, including recent work in the Journal of the Operational Research Society, confirms that cyclical capital flows consistently distort the risk-neutral pricing of catastrophe events.
The counter-intuitive lesson: when CAT bond spreads are tightest, protection is cheapest to buy and most expensive to have sold. The compression that looks like market efficiency is often capital crowding masquerading as a risk assessment. A catastrophe-bond market trading at pre-Ian yields six months before an Iran-driven energy crisis was not a serene market. It was a complacent one.
Key takeaway: Use catastrophe-bond spread compression not as a signal of benign risk conditions but as a contrarian indicator of under-priced tail exposure. Buy protection when it is cheap; do not sell it because it is cheap.
Lesson Four: Emerging markets absorb the shock first — and price it most honestly
There is a geographic hierarchy to disaster pricing that sophisticated global investors routinely ignore. When a major geopolitical or macro catastrophe detonates, the signal appears first in emerging market currencies, credit spreads, and energy import bills — not in the S&P 500 or the Dax. This is not because EM markets are more efficient. It is because they have less capacity to absorb shocks and therefore less incentive to pretend the shock is temporary.
The Hormuz closure is a case study. Developed-market investors spent the first week debating whether oil at $111 per barrel was “priced in.” Meanwhile, Gulf states were issuing precautionary production-cut announcements and Middle Eastern shipping had effectively ceased. Economies in South and Southeast Asia — which import 80 percent or more of their petroleum needs — faced simultaneous currency pressure (oil is dollar-denominated), fiscal pressure (fuel subsidies explode), and inflation pressure (food and transport costs surge). Countries like Pakistan, Sri Lanka, and Bangladesh were pricing a recession before most DM economists had updated their Q1 2026 forecasts.
The BIS research on disaster-risk transmission across 42 countries documents precisely this dynamic: world and country-specific disaster probabilities co-move in complex, non-linear ways. When global disaster probability rises, EM asset prices move first and fastest. For a DM investor, this is an early-warning system hiding in plain sight.
Key takeaway: Monitor EM currency indices, sovereign credit spreads, and fuel import data as leading indicators of how the global market is actually pricing a disaster — before the consensus in New York or London has caught up.
Lesson Five: Geopolitical risk premia have a half-life problem — and it is shorter than you think
Markets are extraordinarily good at normalising the catastrophic. This is not a character flaw; it is a survival mechanism. But for investors, the normalisation of extreme risk is one of the most financially treacherous dynamics in markets.
Consider the structural pattern Tyler Muir documented in his landmark paper Financial Crises and Risk Premia: equity risk premia collapse by roughly 20 percent at the onset of a financial crisis, then recover by around 20 percent over the following three years — even when the underlying structural damage persists. Wars display an even more dramatic version of this pattern. The initial shock is priced aggressively. But as weeks become months, the equity market begins to discount the conflict as background noise, even if oil remains $20 per barrel above pre-war levels and inflation continues to compound.
This half-life problem cuts in two directions. On the way in: investors are often too slow to price a new geopolitical risk, underestimating how durable its effects will be. On the way out: investors often reprice risk premia too quickly back to baseline, treating a structural change in the global system as if it were a weather event that has now passed. The Strait of Hormuz may reopen. But global shipping has permanently re-priced war-risk. Sovereign wealth funds in the Gulf are permanently reconsidering their US dollar reserve holdings. Indian and Japanese energy policymakers are permanently accelerating domestic diversification. These structural changes do not vanish when the headline risk premium fades.
Key takeaway: When pricing geopolitical disasters, separate the acute risk premium (which will fade) from the structural repricing (which will not). The former is a trading signal. The latter is an asset allocation decision that most portfolios have not yet made.
Lesson Six: The moment you feel safest is precisely when you are most exposed
The final lesson is the most counter-intuitive, and arguably the most important. There is a specific period in any market cycle — often 18 to 36 months after the previous crisis — when the cost of tail protection is at its cheapest, investor confidence is high, and catastrophe risk feels entirely theoretical. This is exactly when the next disaster is being loaded.
We can locate this period with precision in the current cycle. In early 2026, the CAPE ratio on US equities reached 39.8, its second-highest reading in 150 years. The Buffett Indicator (total market cap to GDP) hovered between 217 and 228 percent — historically associated with the period immediately before major corrections. CAT bond spreads were at post-Ian lows. VIX had compressed back to mid-teens. Private-credit redemption queues were elevated but not yet alarming. And the macroeconomic consensus — including, notably, within the US Treasury — was that tariff-driven inflation would prove transitory and that central banks would be cutting before mid-year.
Every one of those conditions has now reversed. The reversal took six weeks.
The academic literature on learning and disaster risk, particularly the Kozlowski, Veldkamp, and Venkateswaran (2020) framework on “scarring” from rare events, finds that markets systematically underestimate disaster probability in long stretches without disasters, then over-correct sharply when one arrives. This is not irrationality in the pejorative sense — it is Bayesian updating in the presence of genuinely ambiguous information. But the practical implication is stark: the time to buy disaster insurance is not after the disaster has arrived and the VIX has spiked to 45. It is in the quiet months when every indicator says you don’t need it.
Key takeaway: Maintain systematic, rule-based disaster hedges that do not depend on a real-time catastrophe forecast. The moment it feels unnecessary to hold tail protection is the moment the portfolio is most exposed to needing it.
The Synthesis: From Lessons to Portfolio Architecture
These six lessons converge on a single architectural principle: disaster pricing is not a moment-in-time forecast exercise. It is a permanent structural feature of portfolio construction.
The real mistake — the one that has cost investors dearly in 2020, in 2022, and again in 2026 — is not failing to predict the next disaster. It is believing that markets have already priced it in. The history of catastrophe pricing teaches us, with brutal consistency, that they have not. The cascade is underpriced. The price-discovery failure is unmodelled. The CAT bond spread is supply-driven, not risk-driven. The EM signal is ignored. The geopolitical risk premium is given a shorter half-life than the structural damage it caused. And the tail hedge is cancelled precisely when it is most needed.
The investors who will outperform across the full cycle are not those who predicted the Hormuz closure or the tariff escalation or the next crisis that has not yet been named. They are those who understood that unpriceable disasters are not unpriceable because they are impossible to imagine. They are unpriceable because the incentive structures of the investment industry consistently penalise the premiums required to hedge them.
That gap between what disasters cost and what markets charge for protection is not a market inefficiency. It is the most durable alpha in finance. Learning to harvest it is, in the deepest sense, the only lesson that matters.
Discover more from The Economy
Subscribe to get the latest posts sent to your email.


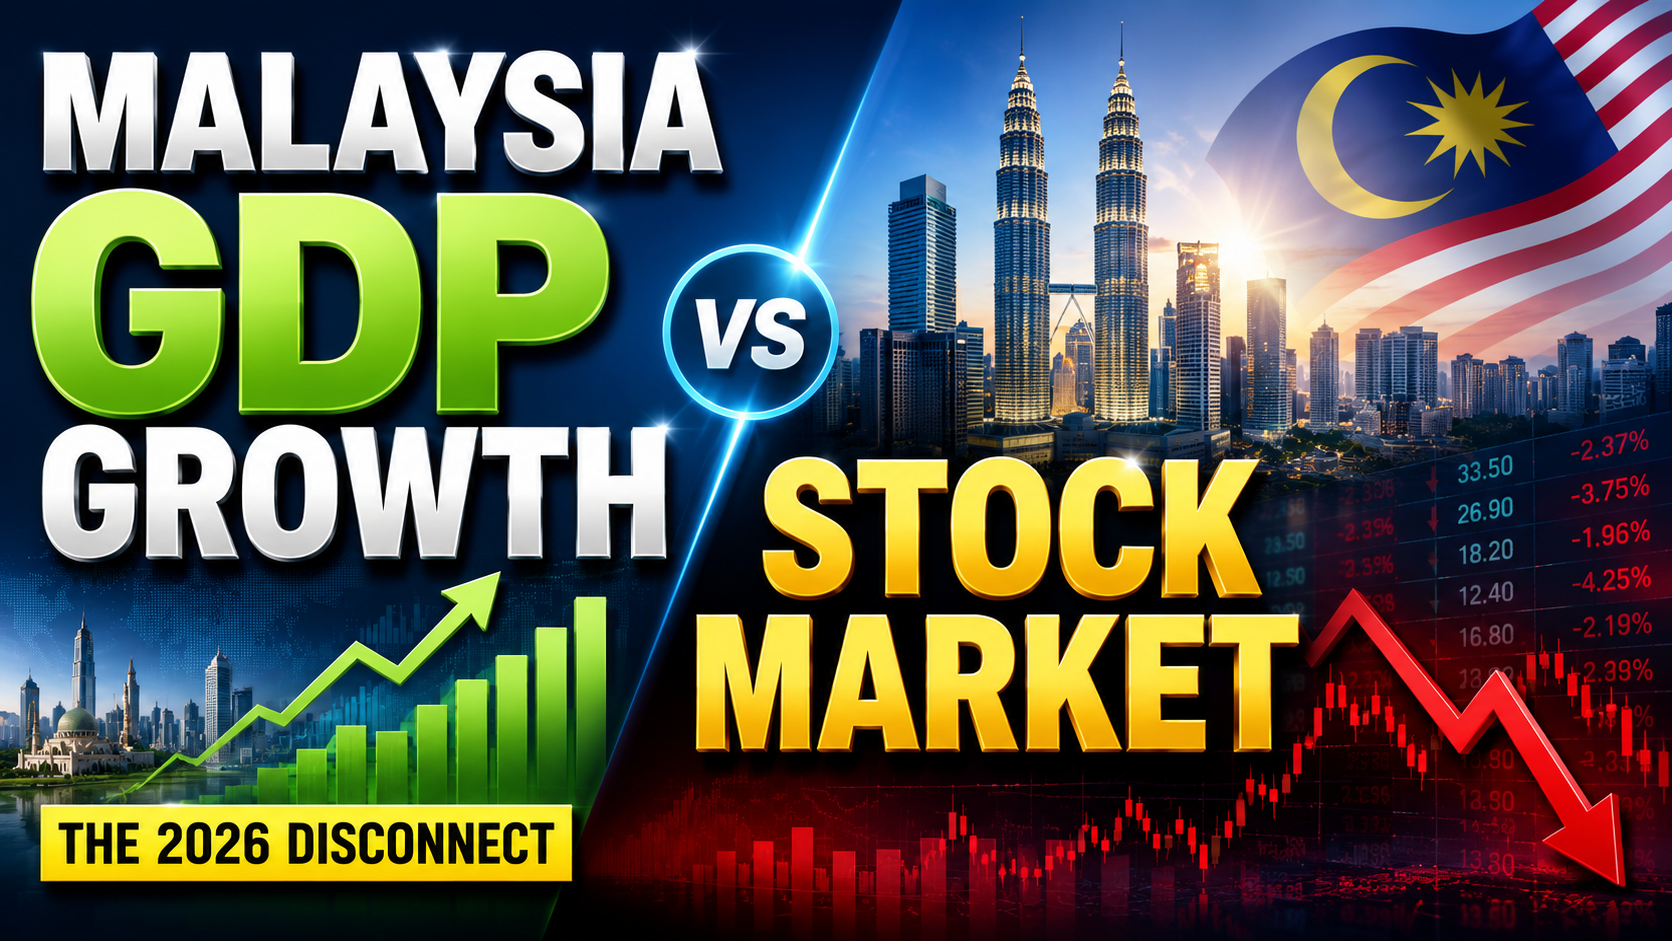
Malaysia posted its biggest trade surplus on record and second-quarter GDP growth of 5.8% in 2026, yet its stock market has stubbornly refused to rally — a disconnect that is puzzling investors even as the country climbs global competitiveness rankings and hosts record investor turnout at its largest retail investing event.
Record Growth Meets a Muted Market
Malaysia’s economy expanded 5.8% year-on-year in the second quarter of 2026, underpinning what former senior investment banker Ian Yoong Kah Yin describes as one of the most competitive economies globally, buoyed by the country’s largest-ever trade surplus, according to reporting in The Star. Yet with the exception of the semiconductor and plantation sectors, Yoong notes that many shares on Bursa Malaysia remain undervalued relative to that underlying strength — a gap he summarised memorably: “It’s like we held a party and no one came.”
The disconnect comes even as Hong Leong Investment Bank upgraded Malaysia’s full-year 2026 growth forecast to 4.7% from 4.5%, citing stronger-than-expected performance in the electrical and electronics sector alongside resilient domestic demand, according to BusinessToday. Household loans grew 5.2% year-on-year and credit card spending rose 10.2%, signalling that consumer demand remains a genuine pillar of growth rather than a statistical artefact of export strength alone.
A Competitiveness Ranking Jump — and a Retail Investing Boom
Malaysia’s underlying reform story has been validated externally. The country climbed eight places to rank 15th among 70 economies in the 2026 IMD World Competitiveness Ranking, its best showing in recent years, following an 11-place jump the year before, according to The Star. Economists attribute the climb to policy reforms improving government and business efficiency, streamlined investment approvals, accelerated digitalisation, and stronger fiscal management.
Retail investor enthusiasm, meanwhile, appears robust even if institutional capital has been slower to follow. INVEST Fair 2026, Malaysia’s largest retail investment event, drew an expected 20,000 visitors across more than 70 hours of programming at Kuala Lumpur’s Mid Valley Exhibition Centre in July, according to event coverage on TradingView. Separately, a survey of more than 3,500 active users by digital wealth platform Versa found that 70% of respondents would prioritise investing over debt repayment or emergency savings if they received a sudden windfall, according to The Star — evidence of a pronounced retail “investment reflex” even amid broader questions about household financial resilience.
Fixed Income Is Where the Real Money Is Flowing
While equities lag, Malaysia’s fixed income market tells a different story. Employees Provident Fund chief investment officer Mohamad Hafiz Kassim told the Sasana Symposium 2026 that Malaysia is “punching above its weight” on global fixed income indexes, drawing outsized capital allocation given interest rate and yield differentials between Malaysian Government Securities and US Treasuries — a dynamic occurring even as the ringgit has remained notably stable, according to The Star. Speakers at the same event pointed to the broader global shift toward passive investing as a structural tailwind Malaysia is well-positioned to capture with continued policy follow-through.
What Explains the Equity Gap
Analysts point to several possible explanations for the growth-market disconnect: persistent foreign investor caution tied to regional and Middle East-driven geopolitical risk, a valuation overhang from prior years, and sector concentration that leaves broad indices under-exposed to the semiconductor and technology names actually capturing AI-linked investment flows. Whatever the cause, the gap represents either an opportunity for value-focused investors or a warning sign that Malaysia’s headline growth figures are not yet translating into corporate earnings momentum broad enough to move the market.
What to Watch
The second half of 2026 will test whether Malaysia’s fixed income strength and competitiveness gains eventually pull equity valuations upward, or whether the stock market’s caution proves to be the more accurate signal about underlying corporate health. Continued data centre and semiconductor investment, alongside any further IMD-style competitiveness validation, will be key catalysts to track.
Discover more from The Economy
Subscribe to get the latest posts sent to your email.
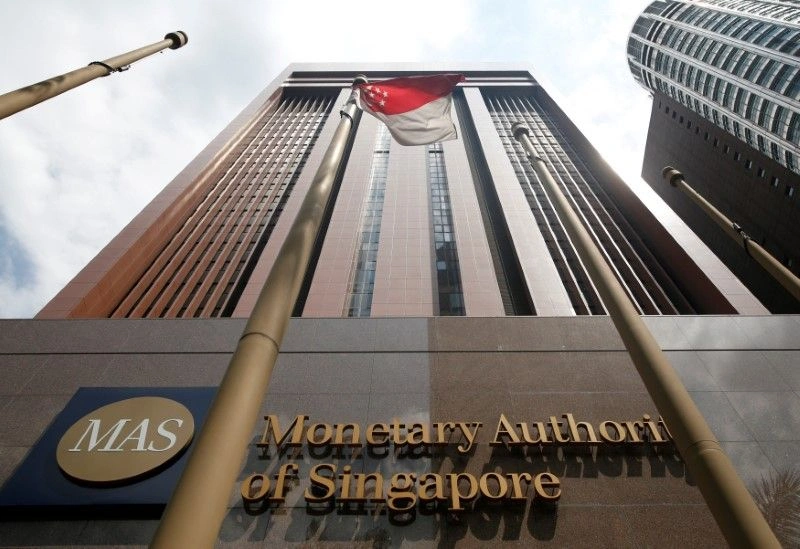
The Monetary Authority of Singapore nudged its exchange-rate-based policy stance slightly tighter in its July review, a modest but notable shift after the city-state’s economy grew a stronger-than-expected 5.7% year-on-year in the second quarter, powered by an AI-driven manufacturing boom that is increasingly reshaping the country’s growth mix.
Growth Beats Expectations Again
Singapore’s economy expanded 5.7% year-on-year in the second quarter of 2026, according to advance estimates from the Ministry of Trade and Industry released 14 July, moderating only slightly from an upwardly revised 6.3% in the first quarter, according to MAS’s own July policy statement. On a quarter-on-quarter seasonally adjusted basis, GDP rose 1.1%, continuing an unbroken run of above-trend expansion. Manufacturing has been the standout performer, posting 12.2% year-on-year growth in the second quarter — up from 8.0% in the first — driven by the electronics and precision engineering clusters riding the global AI capital expenditure wave, according to data reported by Indiplomacy.
The strength has prompted a wave of forecast upgrades. UOB Global Economics and Markets Research lifted its 2026 GDP growth forecast to 4.8% from 4%, while S&P Global Market Intelligence matched that upgrade, and Nomura flagged upside risk to its own 4.6% forecast, according to Xinhua — all comfortably above the Ministry of Trade and Industry’s official 2.0–4.0% guidance range.
MAS Leans Against Rising Core Inflation
The growth surprise has not been without cost. MAS Core Inflation, which excludes accommodation and private transport costs, rose to 1.5% year-on-year in the second quarter, up from 1.2% in the January–February period before the Middle East conflict began, according to the central bank’s own policy statement. Fuel-price surges have pushed up point-to-point transport and non-cooked food inflation, while retail goods prices have climbed on higher import costs and a tobacco tax increase.
In response, MAS increased the slope of the Singapore dollar nominal effective exchange rate (S$NEER) policy band slightly in its July review — a modest tightening move that builds on an April 2026 tightening step, according to the bank’s Macroeconomic Review. Singapore uses its exchange rate, rather than interest rates, as its primary monetary policy tool, managing the currency’s path within an undisclosed band against a basket of trading partner currencies.
The Positive Output Gap Is Widening
Perhaps the most telling technical signal in MAS’s July statement is its acknowledgment that Singapore’s positive output gap — the extent to which the economy is running above its estimated potential — is now forecast to widen further in 2026, rather than narrow as previously expected. That reflects both the stronger-than-anticipated first-half growth data and MAS’s expectation that GDP will be sustained at elevated levels near-term, powered by continued AI-related capital expenditure, a robust construction pipeline, and steady credit-driven expansion in the financial sector.
Singapore’s central bank, MAS, slightly tightened its S$NEER exchange-rate policy band in July 2026 after GDP grew 5.7% year-on-year in Q2, driven by AI-linked manufacturing growth of 12.2%. Core inflation rose to 1.5%, prompting the modest policy shift even as growth forecasts were upgraded to as high as 4.8%.
Why This Matters Beyond Singapore
As a bellwether for Asian trade and technology cycles, Singapore’s data offers one of the clearest real-time signals of how durable the global AI infrastructure buildout has become, even as broader Asian growth forecasts have been trimmed elsewhere in the region due to Middle East-driven energy costs. For global investors, the combination of resilient growth and rising core inflation puts MAS in a position other regional central banks may soon face: managing an AI-driven boom that is proving inflationary in ways that are only loosely connected to traditional demand-side overheating.
What to Watch
MAS’s next scheduled policy review will be closely watched for whether the central bank continues its gradual tightening path or judges that easing global energy costs — following the partial reopening of the Strait of Hormuz — have done enough of the disinflationary work on their own. Singapore’s full second-quarter economic survey, due after the advance estimate, will offer a fuller sectoral breakdown of where the AI-driven strength is concentrated.
Discover more from The Economy
Subscribe to get the latest posts sent to your email.

Indonesia has taken its first concrete legislative step toward building a financial centre intended to compete with Singapore, Hong Kong, and Dubai, as President Prabowo Subianto pushes an ambitious plan to draw foreign capital into Southeast Asia’s largest economy and lift growth toward 8% by the end of his term in 2029.
Parliament Passes Enabling Legislation
Indonesia’s parliament passed the enabling legislation for the new financial hub, laying its legal foundation, according to reporting by the South China Morning Post. The milestone marks the most tangible progress yet on a project analysts say is projected to attract billions of dollars in investment — though they caution that crucial details on tax incentives, investor eligibility requirements, and regulatory safeguards still need to be finalised before the centre can credibly compete with established regional players.
The ambition is unmistakable: a financial centre capable of pulling capital away from Singapore’s deep, established markets, Hong Kong’s China-gateway status, and Dubai’s fast-growing wealth-management ecosystem is a tall order, and observers note that persuading global institutional investors to relocate meaningful operations to a new jurisdiction is a multi-year undertaking that has only just begun in earnest.
Indonesia’s parliament passed enabling legislation in July 2026 for a new financial hub designed to rival Singapore, Hong Kong, and Dubai, as President Prabowo Subianto targets 8% GDP growth by 2029. Singapore remains Indonesia’s top foreign investor at $8.8 billion in H1 2026, ahead of Hong Kong and China.
A Broader Investment Story Already Taking Shape
The financial-hub push arrives alongside signs that Indonesia is already deepening its role as a regional investment destination. Singapore remained Indonesia’s largest foreign investor in the first half of 2026, contributing $8.8 billion, followed by Hong Kong at $7.8 billion, China at $3.9 billion, Japan at $1.9 billion, and the United States at $1.7 billion, according to investment data reported by the New Straits Times. Malaysia ranked fifth, contributing $700 million in the second quarter alone, as Indonesia’s total realised investment reached Rp511.8 trillion.
Indonesian Investment Minister Rosan Roeslani has pointed to regulatory reform — including Government Regulation No. 28, introduced last October, which he said has provided greater licensing certainty — as a key driver of investor interest, while explicitly acknowledging that neighbouring economies are reforming in parallel, requiring Indonesia to keep pace.
Growth Outlook Holds Steady Amid Regional Headwinds
The financial-hub push comes as Indonesia’s broader macroeconomic backdrop remains comparatively resilient. The Asian Development Bank’s July 2026 outlook kept Indonesia’s growth forecast unchanged at 5.2% for both 2026 and 2027, even as the bank lowered its overall developing Asia and Pacific growth projection to 4.9% amid Middle East-driven energy cost pressures. That stability stands in contrast to Malaysia, whose 2026 growth forecast was revised only marginally higher to 2%, according to the same ADB report — even as Maybank Investment Banking Group separately upgraded its own Malaysia forecast more aggressively, to 4.9%, citing strong regional investor interest at July’s Invest ASEAN conference in Singapore, which drew 200 institutional investors managing a combined $23 trillion in assets.
Rice Diplomacy as a Parallel Economic Thread
Indonesia’s regional economic engagement extends beyond high finance. State logistics agency Bulog is continuing negotiations with Malaysia and Singapore over proposed rice export deals, with pricing and commercial terms still under discussion as of mid-July, according to The Star. The talks illustrate the breadth of Indonesia’s economic diplomacy push across ASEAN even as its flagship financial-hub ambitions dominate headlines.
What It Means for Global Investors
For asset managers and multinationals weighing where to locate Southeast Asian operations, Indonesia’s financial-hub legislation is a signal of intent rather than an immediate call to relocate. The real test will come as tax-incentive structures, licensing rules, and investor-protection frameworks are finalised over the coming months — details that will determine whether Jakarta can credibly compete with Singapore’s decades-long regulatory head start, or whether the hub instead becomes a complementary gateway focused on domestic Indonesian capital markets and Belt-and-Road-adjacent regional flows.
Discover more from The Economy
Subscribe to get the latest posts sent to your email.

Nvidia’s H200 Chips Are Finally Reaching China — In Numbers Too Small to Matter Yet

Oil Prices Fall as Strait of Hormuz Reopens: 2026 Update

Malaysia GDP Growth vs Stock Market: The 2026 Disconnect

Singapore MAS Tightens Policy as GDP Growth Hits 5.7%

Fed Holds Rates Under Warsh as Trump Rolls Out New Tariffs

Indonesia Financial Hub 2026: Can It Rival Singapore, Dubai?

Russia Fuel Shortages 2026: Inside a Cracking War Economy

China Politburo July 2026: Stimulus Signals Explained

Andy Burnham, UK Gilts and Mortgages: July 2026 Explainer

Pakistan’s 2026 Monsoon Floods Threaten Fragile Economic Recovery as Inflation Nears 9%

Pakistan Gulf Investment Outflows 2026: Peace Deal Stakes Explained

Canada Trade Diversification 2026: China, Indonesia, UAE Deals Explained

US Forced-Labour Tariffs on 60 Countries: The Hidden Trade Shock of 2026

Global Central Banks 2026: Fed, BoE and BoJ Decisions Could Reshape Markets

Carry Trade Unwind 2026: How the Yen’s Snapback Triggered a Global Margin Call

AI Bubble Warning 2026: Why BIS, IMF and Bank of England Fear a Market Crash

BRICS De‑Dollarization Strategy Takes Shape with $15 Billion Local‑Currency Push

The AI Super Bubble Is Ready to Burst

Russia Bans Diesel Exports 2026: Global Fuel Market Impact Explained

Strait of Hormuz Blockade 2026: Oil Prices Surge 9% as US-Iran Conflict Reignites

Gold Price Forecast 2026: Fed’s July 29 Decision and Record Central Bank Buying Explained

Private Credit Warning: Most BDCs Turn Unprofitable in 2026, Reuters Finds

Bitcoin $150k Milestone Achieved as US Sovereign Crypto Pivot Looms

IMF Cuts Pakistan Growth Forecast, Raises Inflation to 8.4%

Gulf Capital Retreat From Pakistan 2026: UAE Loan Freeze & What It Means

India Economic Rise 2026: How the Subcontinent Toppled Japan

Strait of Hormuz 2026: Why Markets Still Don’t Trust It’s Open

China Housing Market Turnaround: White‑List Model Stabilises Prices
-

 Markets & Finance7 months ago
Top 15 Stocks for Investment in 2026 in PSX: Your Complete Guide to Pakistan’s Best Investment Opportunities
-

 Analysis5 months ago
Johor’s Investment Boom: The Hidden Costs Behind Malaysia’s Most Ambitious Economic Surge
-

 Analysis5 months ago
Top 10 Stocks for Investment in PSX for Quick Returns in 2026
-

 Analysis6 months ago
Brazil’s Rare Earth Race: US, EU, and China Compete for Critical Minerals as Tensions Rise
-

 Banks6 months ago
Best Investments in Pakistan 2026: Top 10 Low-Price Shares and Long-Term Picks for the PSX
-

 Investment7 months ago
Top 10 Mutual Fund Managers in Pakistan for Investment in 2026: A Comprehensive Guide for Optimal Returns
-

 Global Economy7 months ago
15 Most Lucrative Sectors for Investment in Pakistan: A 2025 Data-Driven Analysis
-

 Global Economy7 months ago
Pakistan’s Export Goldmine: 10 Game-Changing Markets Where Pakistani Businesses Are Winning Big in 2025