
Markets & Finance
Bitcoin’s Dollar Trap: The Chart That Exposes the Future of Money


Bitcoin was supposed to challenge the financial establishment. Its increasingly institutionalised market may be revealing just how difficult it is to escape the dollar’s gravitational pull.
On November 5, Bitcoin slipped below $76,000 as a selloff in American technology stocks spilled into cryptocurrency markets. By November 8, the digital asset traded around $75,700—about 40 per cent below its October 2025 record. The decline was unsettling not merely because of its scale, but because of what it suggested about an asset frequently presented as an alternative to conventional finance.
According to Bloomberg’s November 5 market reporting, the cryptocurrency’s latest retreat coincided with a broader flight from risk, including a sharp decline in technology shares. The Bitcoin price chart maintained by CoinGecko showed how far the market had retreated from its previous enthusiasm.
The deeper contradiction lies elsewhere.
Bitcoin was conceived as a system capable of transferring value without dependence on banks. Yet nearly two decades after its introduction, the cryptocurrency’s price is dominated by arguments about Federal Reserve policy, institutional fund flows, dollar liquidity and investors’ willingness to speculate.
The bitcoin dollar chart—the familiar BTC/USD line followed by traders around the world—has become an unintended portrait of this transformation.
Its most revealing feature may not be whether the line moves upward or downward. It is how thoroughly the market’s interpretation of that movement depends on the institutions Bitcoin was supposed to make less important.

The Chart That Measures Everything Except Monetary Independence
At its simplest, a Bitcoin dollar chart measures how many US dollars buyers are willing to exchange for one Bitcoin.
A rising BTC/USD price means Bitcoin has appreciated against the dollar. A falling price means the opposite. This elementary relationship, however, is frequently burdened with conclusions it cannot support.
When Bitcoin rises, enthusiasts often interpret the movement as evidence that confidence in government-issued money is deteriorating. When it falls, critics declare that the cryptocurrency’s monetary ambitions have failed.
Neither conclusion necessarily follows.
Bitcoin can appreciate while the dollar strengthens against other currencies. It can decline during periods of dollar weakness. Its price also responds to investment demand, liquidity, leverage and expectations about future adoption.
An increase from $70,000 to $80,000 would establish that Bitcoin had gained value against the dollar. It would not establish whether the dollar had weakened against the euro, whether inflation expectations had changed, or whether new investors had entered cryptocurrency markets.
That distinction matters because the BTC/USD chart is an exchange-rate record, not a comprehensive measure of monetary confidence.
Financial platforms such as TradingView and Investing.com offer elaborate technical indicators, moving averages and price histories. These can help describe trading behaviour, but they cannot independently explain why a particular movement occurred.
The strongest interpretation requires additional evidence: whether institutional funds are accumulating Bitcoin, whether leveraged traders are being liquidated, how real interest rates are changing and whether investors are using Bitcoin for purposes beyond financial speculation.
There is another limitation to the popular narrative. Pricing an asset in dollars does not, by itself, make that asset economically subordinate to the United States. Gold, oil and numerous internationally traded commodities are conventionally quoted in dollars without losing their independent economic characteristics.
Bitcoin’s dependence is therefore not simply a matter of quotation.
It is a question of market infrastructure, capital allocation and the financial incentives of the institutions increasingly determining who buys and sells it.
Wall Street Has Embraced Bitcoin. But At What Price?
The cryptocurrency’s founding proposition was remarkably ambitious.
In his 2008 white paper, Bitcoin: A Peer-to-Peer Electronic Cash System, the pseudonymous Satoshi Nakamoto proposed a method of transferring digital payments without relying on a trusted financial intermediary.
The design addressed a technological problem: how strangers could establish a shared record of transactions without surrendering control of that record to a central institution.
It did not promise that Bitcoin’s future market price would be immune to financial cycles.
That distinction has become increasingly important.
In January 2024, the US Securities and Exchange Commission approved the listing and trading of spot Bitcoin exchange-traded products. The decision expanded access to Bitcoin through conventional brokerage accounts and regulated securities exchanges.
It also created a powerful new channel through which traditional investment behavior could influence cryptocurrency markets.
The consequences were visible in 2026.
According to research published by 21Shares on November 2, US spot Bitcoin ETFs attracted approximately $6.2 billion in net inflows during the third quarter, following roughly $4.8 billion in outflows during the second.
The same research estimated that longer-term Bitcoin holders reduced their balances by 248,000 coins during the third quarter.
These figures, drawn from industry and market-data providers, suggest something more complex than a simple story of expanding adoption. Institutional demand was rising during that quarter even as substantial amounts of Bitcoin moved away from longer-term holders.
But institutional participation can reverse direction.
On November 3, Bloomberg reported that US-listed Bitcoin funds had experienced approximately $1.04 billion in net withdrawals over two trading sessions.
The contrast is revealing.
Institutional investment can expand the market’s depth, provide access to new investors and potentially reduce some forms of trading friction. It can also bring Bitcoin into the same portfolio-management decisions that govern equities, bonds and other assets.
A fund manager facing redemptions or mounting losses elsewhere may sell Bitcoin because it is liquid—not because the underlying network has deteriorated.
That is the price of financial legitimacy.
As The Atlantic argued in its February 2026 examination of cryptocurrency’s downturn, wider acceptance by traditional finance can increase the industry’s exposure to familiar market vulnerabilities.
The central paradox is that Bitcoin can become easier to own without becoming more independent.
The Federal Reserve Remains an Uninvited Participant
If Bitcoin were already functioning as a widely accepted alternative monetary system, decisions made by the Federal Reserve would presumably exert less influence over its market narrative.
Instead, monetary policy remains a major consideration for cryptocurrency investors.
On October 28, 2026, the Federal Open Market Committee maintained its benchmark interest-rate range at 3.75 to 4 percent. The decision passed by a 10–2 vote, with two policymakers preferring a quarter-point increase.
The significance for Bitcoin lies in the opportunity cost of holding an asset that pays no contractual interest.
When short-term Treasury securities offer attractive yields, investors can receive income while taking substantially less price risk than they would by holding Bitcoin.
Higher real interest rates can therefore make speculative assets less attractive. Lower yields may improve their relative appeal, especially when abundant liquidity encourages investors to seek returns beyond conventional fixed-income markets.
Yet this relationship is not mechanical.
Bitcoin’s history contains periods when it moved alongside risky equities and others when its performance diverged. Regulatory developments, changes in market structure and cryptocurrency-specific shocks can outweigh broad monetary conditions.
Nevertheless, the dependence is increasingly difficult to dismiss.
A Bloomberg analysis of Bitcoin’s integration into institutional finance examined the relationship between cryptocurrency markets, futures pricing, volatility and technology equities. Its analysis found that Bitcoin’s correlation with technology shares had become substantial over some recent measurement periods.
The November market decline offered another illustration, although one episode cannot establish a permanent relationship.
This complicates Bitcoin’s reputation as an inflation hedge.
Inflation can weaken the purchasing power of conventional money, supporting demand for scarce alternatives. But persistent inflation can also produce tighter monetary policy, higher bond yields and reduced appetite for risky investments.
An asset designed to resist monetary expansion can still suffer when central banks fight inflation.
Bitcoin’s fixed supply rules do not shield its market price from changes in the cost of money.
Digital Gold—or an Asset That Behaves Like Technology Stocks?
Bitcoin’s supporters have long emphasized the contrast between its programmed scarcity and the discretionary issuance of government currencies.
The network’s supply is designed to approach a maximum of 21 million coins, creating a predictable issuance schedule that distinguishes it from conventional money.
That scarcity is economically meaningful.
But scarcity alone does not guarantee price stability, purchasing power or enduring demand.
Gold has centuries of historical use as jewelry, a store of wealth and a reserve asset. Bitcoin’s economic history is much shorter, its ownership infrastructure is different, and its price continues to reflect pronounced speculative cycles.
The comparison becomes especially revealing during periods of financial stress.
If an asset is consistently treated as a safe haven, investors would expect it to retain value—or at least provide meaningful diversification—during some episodes of turmoil elsewhere.
Bitcoin has not consistently met that standard.
The Financial Times examined the cryptocurrency market’s structural vulnerabilities during the severe market correction of late 2025, including leveraged trading, declining liquidity and the growing connections between cryptocurrency and traditional financial institutions.
These vulnerabilities help explain why the digital-gold analogy can be misleading when applied indiscriminately.
Bitcoin may serve as a long-term speculative store of value for some investors. It may provide an alternative to unstable national currencies in particular circumstances. Its independence from centralized issuance remains an important technical characteristic.
But the ability to survive over many years is different from the ability to preserve value during a particular financial emergency.
Gold and Bitcoin may occasionally benefit from the same fears about inflation or fiscal credibility. They need not behave alike when investors urgently seek cash.
For policymakers and investors, that difference is more consequential than the familiar argument over which asset deserves the title of digital gold.
The Dollar’s Quiet Victory Inside the Cryptocurrency Economy
Bitcoin’s relationship with the dollar becomes more intriguing when the broader cryptocurrency ecosystem is considered.
The digital-asset industry has produced instruments that sometimes compete with traditional banking services while simultaneously extending the international reach of the American currency.
Stablecoins illustrate this contradiction.
Unlike Bitcoin, most major fiat-backed stablecoins are designed to maintain a stable value relative to an established currency—usually the US dollar.
The International Monetary Fund reported in August 2026 that nearly 99 percent of stablecoins were denominated in dollars.
That is an extraordinary measure of the dollar’s continued influence within a financial ecosystem frequently associated with monetary disruption.
Stablecoins and Bitcoin are fundamentally different instruments. One generally seeks price stability against an existing currency; the other has a market-determined price. Their growth should not be treated as interchangeable evidence of the same economic development.
Nevertheless, their trading and financial infrastructure overlap.
Dollar-backed stablecoins facilitate cryptocurrency-market liquidity and transfers while creating demand for the dollar-denominated assets held in reserve.
Research by the Bank for International Settlements examined how stablecoin demand affects short-term US Treasury markets, identifying an increasingly significant connection between digital finance and government securities.
The implication is striking: a financial system celebrated for challenging traditional intermediaries can generate additional demand for instruments issued by the world’s leading sovereign borrower.
Meanwhile, the dollar’s wider international position remains formidable.
According to the IMF’s September 30, 2026 reserve-currency data, the dollar accounted for 56.70 percent of reported global foreign-exchange reserves in the second quarter of 2026.
That share has declined from historical levels, but the dollar remains the dominant reserve currency.
Bitcoin’s market capitalization does not by itself overturn this structure. Nor does the growth of digital-asset trading demonstrate that businesses are abandoning dollars as the unit in which they price goods, settle obligations or evaluate investment returns.
The distinction is between creating an alternative asset and replacing a monetary system.
Bitcoin has achieved the former. The evidence for the latter remains far less persuasive.
The Emerging-Market Test
The monetary implications become particularly important outside advanced economies.
In countries experiencing high inflation, currency depreciation, restrictions on foreign exchange or weak confidence in financial institutions, digital assets can offer an alternative channel for storing or transferring wealth.
But alternatives differ substantially.
A household seeking protection against local-currency depreciation might prefer a dollar-backed stablecoin over Bitcoin because the stablecoin avoids much of Bitcoin’s immediate price volatility against the dollar.
That choice would not necessarily constitute rejection of the dollar.
It could represent digital dollarization: the adoption of dollar-linked claims through a new technological infrastructure.
An IMF policy paper published in October 2026 warned that foreign-currency stablecoins could accelerate currency substitution and complicate monetary management, particularly where local financial systems are fragile.
The same innovation can produce genuine benefits through improved payments, wider access and greater competition.
But those advantages do not eliminate risks involving reserve quality, redemption rights, market integrity and national monetary sovereignty.
A developing economy that adopts dollar-linked digital tokens more extensively may become technologically innovative while growing more dependent on foreign monetary conditions.
Bitcoin presents a different set of trade-offs. It does not promise stable redemption at one dollar, but its value can fluctuate dramatically.
For households living close to financial insecurity, monetary independence has limited practical value if the asset intended to protect savings suffers a sudden, severe decline.
The question is therefore not whether digital finance can help people escape inefficient institutions. It can, under the right conditions.
The question is whether that escape creates genuine monetary autonomy—or merely changes the technology through which existing monetary power is exercised.
What the Bitcoin Dollar Chart Cannot Tell Us
The greatest weakness of conventional Bitcoin analysis is its tendency to confuse market performance with monetary transformation.
A higher BTC/USD price may indicate rising investor demand. It cannot tell us whether businesses increasingly use Bitcoin to settle ordinary transactions, whether households trust it for recurring expenses, or whether financial systems are becoming less dependent on conventional intermediaries.
Four questions deserve more attention than the next technical resistance level.
First, is Bitcoin becoming more useful beyond investment? Adoption should be evaluated through credible evidence of payments, settlement, savings behavior and financial access—not price appreciation alone.
Second, does Bitcoin provide reliable diversification under stress? Its performance should be examined across different inflation regimes, interest-rate environments, liquidity shocks and geopolitical crises.
Third, who increasingly determines market prices? If institutional funds, leveraged derivatives and large intermediaries account for a growing share of investment activity, the concentration of financial influence matters even when the underlying network remains decentralized.
Fourth, is cryptocurrency adoption reducing dependence on the dollar? The expansion of digital payments may be substantial without producing a corresponding shift away from dollar-denominated financial claims.
These questions expose the limits of technical prediction.
Moving averages, momentum indicators and support levels may help traders interpret recent price behavior. They do not establish why prices moved or guarantee what comes next.
In a November 4 technical assessment, Reuters examined Bitcoin’s repeated declines following periods of consolidation and identified possible downside and recovery scenarios.
Such analysis can describe market probabilities and potential trading levels. It cannot settle Bitcoin’s longer-term economic identity.
A cryptocurrency may be technically innovative without becoming monetary infrastructure. It may appreciate dramatically without becoming a reliable store of purchasing power. And it may gain institutional acceptance without delivering the independence its earliest supporters imagined.
Those are not arguments for dismissing Bitcoin.
They are arguments for judging it by more demanding standards.
The Next Monetary Revolution May Look Surprisingly Familiar
The future of Bitcoin is not reducible to a contest between believers forecasting unlimited appreciation and skeptics predicting collapse.
Several outcomes remain plausible.
Bitcoin may mature into a widely held, high-volatility investment asset with a durable place in institutional portfolios. It may gain broader utility in international payments or as an alternative savings instrument. Its price may remain highly sensitive to global liquidity even as its technological infrastructure continues to develop.
These possibilities are not mutually exclusive.
But the most important transformation could occur elsewhere in digital finance.
Stablecoins, tokenized deposits and other electronic financial instruments may modernize how existing currencies move without fundamentally replacing those currencies.
The BIS analysis of stablecoins and the international monetary system identifies the possibility that dollar-denominated tokens could reinforce existing currency hierarchies rather than overturn them.
That possibility deserves more attention than another speculative Bitcoin price target.
The global financial system may become more digital, more accessible and more technologically decentralized in certain functions while remaining substantially dollar-centered in its pricing, funding and reserve arrangements.
This would represent meaningful innovation.
It would not necessarily represent a monetary revolution.
The Verdict: Bitcoin Has Challenged Money, Not Yet Replaced Its Power Structure
The Bitcoin dollar chart tells a story of extraordinary technological ambition, financial speculation, institutional adaptation and unresolved monetary questions.
It also offers a warning against confusing the market value of an innovation with the political and economic consequences of that innovation.
Bitcoin has survived repeated crashes, regulatory confrontations and predictions of its disappearance. It has attracted investors, inspired new financial products and established a functioning network that no single central bank directly controls.
Those achievements should not be trivialized.
Yet its growing entanglement with conventional finance suggests that the most successful challenge to an institution is not always its replacement.
Sometimes, the institution absorbs the challenge.
Wall Street has learned to package Bitcoin. Investors have learned to trade it alongside other risky assets. Governments have learned to regulate or accommodate parts of its ecosystem. Dollar-backed tokens have demonstrated how digital innovation can extend the influence of established currencies.
The cryptocurrency’s market price may rise again. It may also fall further. Neither outcome would independently determine whether Bitcoin has fulfilled its original economic promise.
The more consequential question is whether Bitcoin can achieve greater practical monetary usefulness without requiring the financial system it challenges to determine its relevance.
Bitcoin has proved that money-like value can exist without a central issuer. Its unfinished revolution is proving that such value can matter without depending so heavily on the institutions it sought to bypass.
Until that changes, the most revealing feature of the Bitcoin dollar chart may be the currency printed beside the price.
Discover more from The Economy
Subscribe to get the latest posts sent to your email.


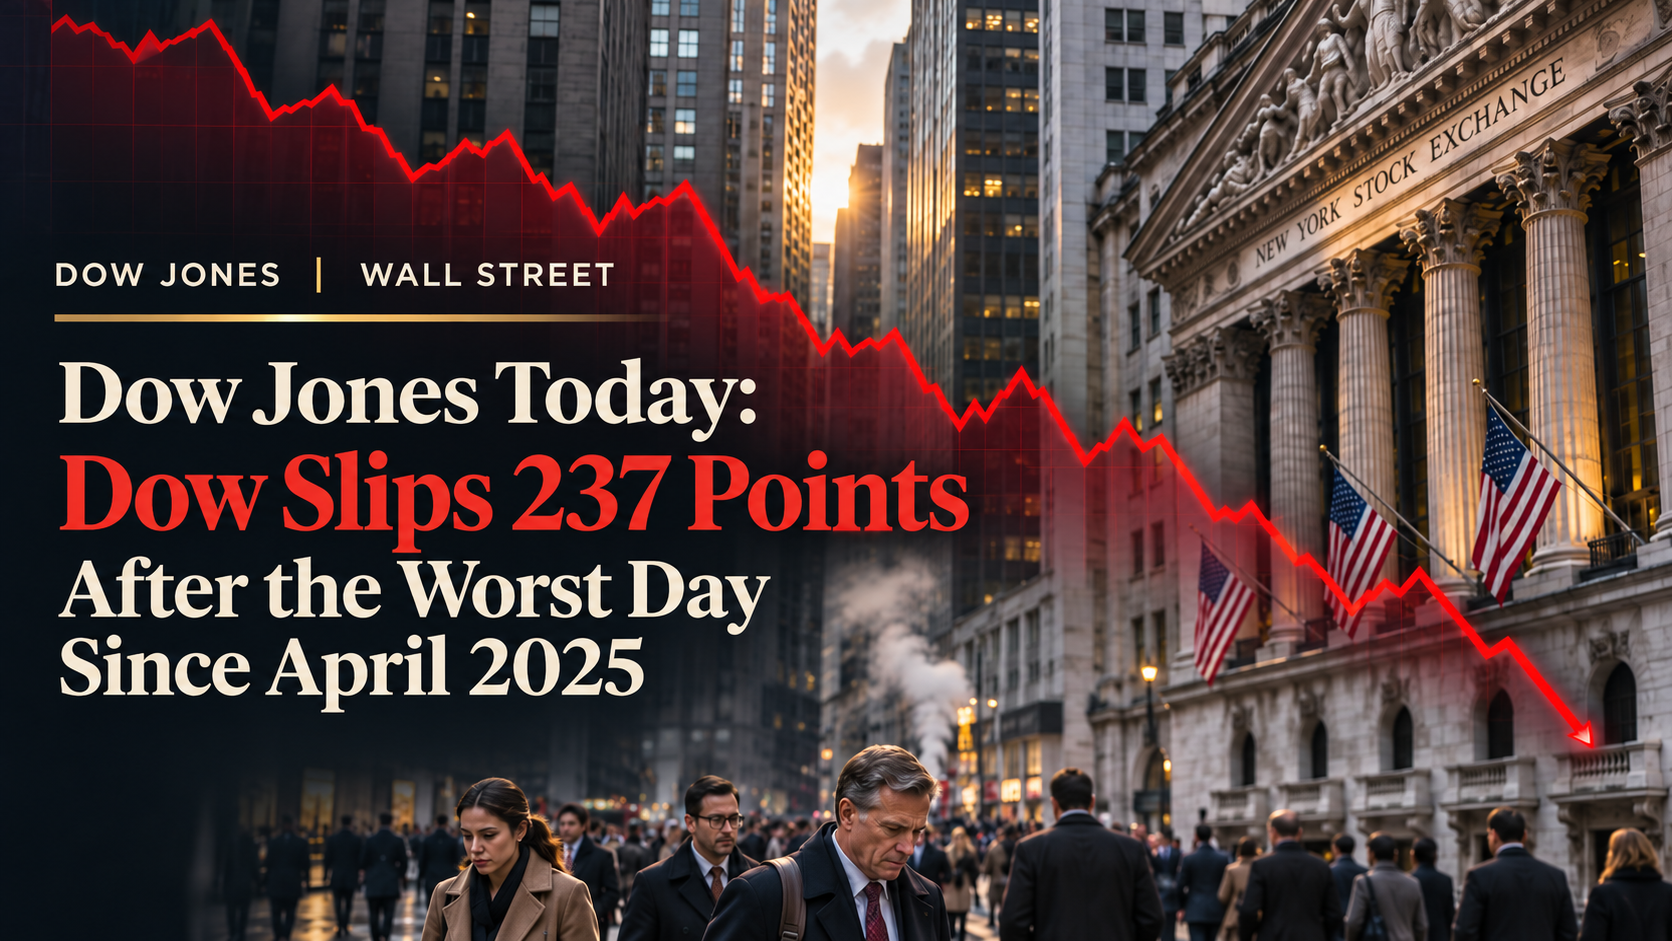
The Dow Jones Industrial Average closed Friday, November 6, 2026, at 51,285.73, down 237.33 points (0.46%). That followed Thursday’s 1,833.06-point (3.4%) plunge to 51,523.06, the worst session for the major averages since April 2025. Over the two days, the Dow lost roughly 3.9%, while the Nasdaq Composite, hit hardest on Thursday, bounced 1.09% on Friday. A much stronger-than-expected October jobs report added a new variable by lifting the odds of a December Fed rate hike.
Where the market stands after Friday’s close
| Index | Thu, Nov 5 | Fri, Nov 6 close | Fri change |
|---|---|---|---|
| Dow Jones Industrial Average | 51,523.06 (−1,833.06, −3.4%) | 51,285.73 | −237.33 (−0.46%) |
| S&P 500 | 7,353.73 (−334.89, −4.4%) | 7,376.86 | +0.31% |
| Nasdaq Composite | 24,315.00 (−1,421.52, −5.5%) | 24,579.42 | +1.09% |
| Russell 2000 | n/a | 2,758.64 | +1.05% |
Sources: CNBC live coverage, Yahoo Finance, TheStreet, Yahoo Finance/Zacks market news.
Calculated from those closes (our arithmetic, not a published figure): from Wednesday’s close to Friday’s, the Dow fell about 3.9%, the S&P 500 about 4.1% and the Nasdaq about 4.5%. The Dow also sits roughly 6.3% below its 52-week high of 54,744.33, per Yahoo Finance’s index page.
What happened on Thursday, November 5
Thursday was a broad rout. All 30 Dow components and all 11 S&P 500 sectors closed lower, according to Zacks via Yahoo Finance. The Nasdaq’s 5.5% drop left it more than 10% below its most recent high, which Wall Street treats as a correction (CNBC).
Reports tie the selling to worries that AI infrastructure could face tighter regulation after Democratic gains in the midterm elections, which triggered profit-taking in technology shares. TheStreet reported that the Nasdaq 100 fell 6.3%, erasing about $2.3 trillion in value, while the S&P 500 lost about $2.8 trillion. Treat the causal story as the market’s leading explanation rather than a proven fact: no one can assign a precise share of the decline to any single trigger.
What happened on Friday, November 6
Friday was a split session. Chip and AI shares rebounded, with Nvidia up 3.9% and AMD up 10.8%, lifting the Nasdaq and S&P 500. The Dow lagged and slipped, with losses in financials, healthcare and consumer services offsetting gains in technology, industrials and consumer goods (Investing.com, Yahoo Finance). The S&P 500 still finished its worst week since June.
Two points deserve attention. First, the Dow’s relative weakness is a reversal: on Thursday the Nasdaq fell hardest, while on Friday the Dow trailed. That is a reminder that a 30-stock average and a tech-heavy index can diverge sharply in both directions. Second, the rebound was narrow. Even with the S&P 500 higher, roughly 182 stocks advanced against 312 decliners at the close, according to one market recap (a lower-authority source, so verify against your terminal before relying on it).
The jobs report that changed the Fed conversation
At 8:30 a.m. ET Friday, the Bureau of Labour Statistics reported that employers added 165,000 jobs in October and unemployment fell to 4.1% from 4.2%. Economists had expected roughly 59,000 to 65,000 jobs (Morningstar, Kiplinger). September payrolls were reported at 60,000, and the trade press noted upward revisions to August and September.
The data matters for stocks because of where the Fed is. Policymakers held the federal funds rate in late October after a September hike, the first in three years, and September inflation data showed prices accelerating. After the report, market-implied odds of a quarter-point hike in December rose to about 80% from 67% (Scotsman Guide). Strong hiring is good news for the economy but a headwind for richly valued growth stocks if it means higher rates for longer. That tension explains why a good jobs number did not produce a clean rally.
One positive offset: the University of Michigan’s preliminary November consumer sentiment reading came in at 51.0, above the 47.5 consensus (CNBC).
Why point losses mislead: how the Dow works
The Dow’s 1,833-point headline sounded dramatic, but the percentage was the better yardstick, and the index’s construction explains why points alone mislead.
- It is price-weighted. The Dow tracks 30 large U.S. companies, and a stock with a higher share price moves the average more than a stock with a lower one, regardless of company size. The S&P 500 and Nasdaq are weighted by market capitalization.
- Points depend on the starting level. A 1,000-point move means far less with the index above 51,000 than it did when the Dow was at 15,000. Use percentages for comparison.
- The divisor adjusts for splits. Stock splits change nominal share prices without changing company value, so the index uses a divisor to keep the average continuous. That makes it risky to say a single company “caused” a point drop.
That is also why the Nasdaq and S&P 500 told a more complete story on Thursday. The Nasdaq carries far more technology and growth exposure, so an AI-driven repricing hit it harder (5.5%) than the Dow (3.4%).
Does the Dow still matter?
Yes, within limits. Its heavier mix of industrial, financial, healthcare and consumer companies cushioned the swings seen in the Nasdaq, as Yahoo Finance noted. But 30 companies cannot represent the whole economy. For a fuller read, pair it with the S&P 500, Nasdaq, small caps, Treasury yields and credit spreads.
What to watch next
- October inflation report (November 10). A hot reading would strengthen the case for a December hike.
- FOMC minutes (November 18) for how divided policymakers were. Two of 12 voters reportedly favored a hike in October.
- November jobs report (December 4).
- Policy signals on AI infrastructure and data-centre permitting, which drove Thursday’s sell-off.
- Breadth and credit. Watch whether weakness spreads to banks, transports and consumer stocks, or whether the sell-off stays contained to technology.
Dates are from Rio Times; confirm against the BLS and Federal Reserve calendars.
FAQ
How much did the Dow fall on November 5, 2026? 1,833.06 points, or about 3.4%, to close at 51,523.06.
Where did the Dow close on November 6, 2026? At 51,285.73, down 237.33 points (0.46%).
Is the Dow the entire stock market? No. It holds 30 large U.S. companies and is price-weighted.
Why use percentage changes instead of points? Percentages scale to the index level, so moves are comparable across years and indexes.
Why did the Nasdaq fall more than the Dow? It holds far more technology and AI-related stocks, which led the sell-off.
Discover more from The Economy
Subscribe to get the latest posts sent to your email.

The November 5 decline was severe. Calling it a systemic crash, however, requires evidence beyond a frightening index percentage.
The November 5 decline was severe. Calling it a systemic crash, however, requires evidence beyond a frightening index percentage. This analysis draws on primary documents and contemporaneous reports available on November 6, 2026; subsequent market movements or policy announcements may change the outlook.
On November 5, 2026, the Dow Jones Industrial Average lost about 3.4%, the S&P 500 declined 4.4% and the Nasdaq Composite dropped 5.5%, according to the Associated Press market recap. Chipmakers and AI infrastructure shares were especially hard hit. Reuters also documented a steep slump in the Philadelphia Semiconductor Index.
These movements demand serious coverage, but the term “stock market crash” has no single universal percentage threshold. A large daily decline can be part of a correction, a panic, a bear market or a crisis. Each description implies something different about duration, economic damage and financial stability. The most useful answer is therefore diagnostic rather than theatrical.
Crash, correction and bear market are not synonyms
A common market convention describes a correction as a decline of at least 10% from a recent high and a bear market as a decline of at least 20%. These are descriptive conventions, not mechanical forecasts of what happens next. A crash usually refers to a rapid, disorderly fall, but usage varies. A systemic financial crisis is more demanding: it implies dysfunction in credit provision, payments or major institutions.
When a single sector falls much more than the broad index, concentration and leverage become important. The NASDAQ can enter correction territory without the entire U.S. financial system being in distress.
What was being repriced?
The November move centred on highly valued AI and technology names. Investors questioned returns on data-centre expansion, financing conditions and political constraints on new construction. Companies with strong current revenue can sell off if expected future cash flows no longer justify their market capitalisation.
The IMF had already highlighted an AI-expectations reassessment as a risk in its October outlook. That does not prove that the IMF predicted a specific trading session; it shows why the underlying vulnerability matters beyond the day’s market narrative.
What would make this a broader financial danger?
Watch high-yield credit spreads, funding rates, banking stress, margin calls and liquidity in government bond markets. A widening spread indicates investors are demanding more compensation for credit risk. Disorderly selling in unrelated assets may indicate attempts to raise cash. But ordinary volatility in equities—even severe volatility—does not itself establish a breakdown of the financial system.
Economic vulnerability also depends on consumers and companies. If share declines cause businesses to cancel capital spending or households to sharply reduce consumption, market turbulence can spill into real activity. If financing and employment remain resilient, a market correction may stay contained.
How to avoid being misled by panic headlines
Always identify the time interval. “Down 5% today” is different from “down 5% from the all-time high.” Distinguish the official close from intraday lows. Check whether quoted returns include dividends or currency translation. Compare equal sessions rather than a U.S. Thursday close with an Asian Friday intraday figure.
The correct response to uncertainty is a decision framework, not a binary bottom call. Investors should consider liquidity needs, diversification, concentration and suitability for their own circumstances. No article can responsibly guarantee that selling or buying immediately after a large decline will be profitable.
What a closer look at the source record shows
The available record supports a useful separation between confirmed developments and interpretation. The first column below identifies the type of evidence; the second explains the analytical use, not an independently measured market statistic.
| Research focus | How it informs this story |
|---|---|
| Confirmed evidence | AP market close |
| Interpretive opportunity | Define crash precisely |
| Secondary question | Credit stress checklist |
| Next verification | Update after each U.S. market close; avoid mixing session-level and cumulative declines. |
The research priority is relevance rather than sheer citation volume. Repeated references to the same press release do not represent independent confirmation, and authoritative data can support a narrower claim than an ambitious headline suggests. Wherever a numerical fact is used, the source date and stated coverage should travel with it.
How to interpret the evidence without overclaiming
A frightening move is not itself a credit failure. A systemic crisis requires more evidence than equity price volatility. Funding spreads, bank conditions and collateral liquidity provide important context. In this article’s subject—the 2026 stock market crash 2026—that distinction prevents superficially precise figures from becoming misleading conclusions. A credible account should explain exactly which evidence supports each inference and what would change the analysis.
Risk management begins before a headline. Time horizon, cash needs and concentration determine an investor’s vulnerability. A universal buy-or-sell instruction ignores personal circumstances. Update after each U.S. market close; avoid mixing session-level and cumulative declines. These checks are important because individual data points can be correct while the story assembled from them is incomplete.
Three specific tests make the coverage stronger:
- Define crash precisely. Ask what the underlying observation actually measures, which population or companies it covers, and how recent it is. A relevant primary document outweighs a popular unsourced claim.
- Credit stress checklist. Compare plausible explanations and resist attributing every market or policy movement to one event. When an observed change has several possible causes, explain which are supported and which remain hypotheses.
- Avoid false predictive certainty. Describe what new fact would falsify the prevailing interpretation. Reporting that cannot be revised in the face of new evidence is advocacy, not analysis.
Distinguishing three kinds of market aftermath
A contained correction. Earnings expectations and risk appetite adjust while banks and credit markets continue functioning. Prices may stabilise after volatile sessions, though the original peak may take time to regain. The confirmation is not a single green trading day; it is a sustained narrowing in funding stress, less forced selling and resilient corporate guidance across sectors.
A wider demand shock. If declining equity values, expensive borrowing and cancelled infrastructure projects cause companies to cut hiring or spending, markets can influence the real economy. Widening credit spreads and weaker employment would matter more than another dramatic intraday quote. Policymakers might face difficult trade-offs if inflation remains elevated at the same time.
A leadership shift. Highly valued AI equities could underperform while cash-generating industrial, consumer or defensive businesses hold up comparatively well. The indexes might stay choppy without a generalised failure of finance. Watch earnings dispersion and sector breadth. Historical labels such as “correction” and “bear market” describe price behaviour; they cannot reliably tell readers when the next sustained advance begins.
A practical research checklist
A reader evaluating this issue should first open the primary sources linked in the article and check their publication dates. Next, identify the specific claim being tested, its units and its geographic or institutional scope. Then compare that evidence with at least one independent account, asking whether the sources are reporting the same underlying data or repeating one another. Finally, distinguish a dated observation from a prediction and note the developments that would demand an update.
For a working editorial desk, this sequence is equally important. A clearly dated article can remain valuable after prices or politics change if its explanations endure and its volatile numbers are identified as snapshots. An article that quietly presents yesterday’s quote as today’s fact, by contrast, loses credibility even when the broader argument is sensible.
A final distinction worth checking
A comparison with past crashes requires more than matching the size of a daily move. The starting valuation, interest-rate setting, banking system, policy response and market plumbing can differ substantially. Two days with identical index losses may have radically different consequences for household wealth and corporate financing. For readers searching for an actionable signal, these structural differences deserve priority over charts suggesting that a historic pattern will automatically recur. Market history is a set of comparisons, not a reliable calendar for the next rebound.
Questions readers are asking
Did U.S. stocks crash on November 5?
They experienced a severe sell-off; whether to call it a crash depends on definition and subsequent developments.
What is a correction?
A commonly used convention is a drop of at least 10% from a recent market high.
Does a crash cause a recession?
Not always. Market losses can affect economic activity, but recession outcomes depend on credit, employment, spending and policy.
What should I check before reacting?
Official close, cumulative drawdown, portfolio concentration, credit conditions and whether the news changed underlying fundamentals.
The judgement
The November 5 decline was severe. Calling it a systemic crash, however, requires evidence beyond a frightening index percentage. The most responsible conclusion is conditional: Update after each U.S. market close; avoid mixing session-level and cumulative declines. The argument should evolve when new source material is published, rather than being defended simply because it made a compelling headline on November 6. For readers, the value is a clearer distinction among what has already happened, what remains uncertain and what developments would actually change the decision.
Discover more from The Economy
Subscribe to get the latest posts sent to your email.

Singapore’s stock market has a different vulnerability from the Nasdaq: banks, dividends, interest margins and the currency policy that shapes returns.
Singapore’s stock market has a different vulnerability from the Nasdaq: banks, dividends, interest margins and the currency policy that shapes returns. This analysis draws on primary documents and contemporaneous reports available on November 6, 2026; subsequent market movements or policy announcements may change the outlook.
Singapore’s Straits Times Index gained 0.5% to 5,296.25 on November 5, according to The Business Times, even as technology shares elsewhere were under pressure. The same session saw diverging performances among DBS, OCBC and UOB. This is a reminder that the STI is not a miniature Nasdaq. Its sector composition, income characteristics and investor base create different drivers.
The Monetary Authority of Singapore’s October 2026 statement kept the Singapore dollar on an appreciating policy path, expecting both core and headline inflation to average 1.5%–2.5% in 2027. The central bank also warned of risks from higher energy prices and a possible slowdown in the AI-driven cycle.
What bank-heavy’ really means
A bank-heavy index reacts to loan growth, deposit costs, net interest margins, provisions and dividend expectations. A strong economy supports credit demand, but margins can compress even when borrowers remain healthy. Conversely, higher interest rates may temporarily help asset yields while increasing deposit competition and credit risk.
DBS, OCBC and UOB cannot be treated as interchangeable. Each has a different business mix and geographic exposure; results and management commentary should drive comparisons. The November 5 session illustrated the point: DBS and OCBC rose modestly while UOB declined, according to the same local report.
Currency policy is an investment variable.
MAS targets the exchange rate rather than a conventional domestic policy interest rate. A gradually appreciating Singapore dollar can restrain imported inflation, particularly relevant when oil and food prices are volatile. But it may also affect translated overseas earnings and the returns of foreign investors.
The relevant calculation is total return in the investor’s base currency: price change, dividends and currency appreciation or depreciation. A headline STI gain in Singapore dollars is not necessarily identical to the outcome for someone financing a portfolio in U.S. dollars, Malaysian ringgit or another currency.
REITs are not simply a bond substitute.
S-REITs offer exposure to property cash flows, but distributions depend on occupancy, rents, debt refinancing and asset values. When funding costs remain high, leverage and upcoming debt maturities matter as much as the headline distribution yield. The distinction becomes sharper in a world where global government bond yields are elevated.
A credible screening process examines interest coverage, weighted average debt maturity, hedging, tenancy concentration and asset location. A high yield may represent a sound income asset—or a warning that investors expect a distribution cut. The yield alone cannot tell the reader which.
The 2027 outlook hinges on earnings quality.
Singapore benefits from finance, logistics, wealth management and high-value manufacturing but is highly exposed to global trade. MAS expects AI-related regional activity to moderate into 2027. That creates both a threat to manufacturing momentum and potential relief from some imported input costs if the cycle cools in an orderly fashion.
The best base case is not that the STI will evade every global sell-off. It is that bank profitability and resilient dividends can provide an alternative source of return. A bearish scenario would combine shrinking margins, credit losses, high refinancing costs and weaker global demand.
What a closer look at the source record shows
The available record supports a useful separation between confirmed developments and interpretation. The first column below identifies the type of evidence; the second explains the analytical use, not an independently measured market statistic.
| Research focus | How it informs this story |
|---|---|
| Confirmed evidence | The Business Times Nov 5 report |
| Interpretive opportunity | Bank margins versus STI return |
| Secondary question | FX-adjusted performance |
| Next verification | Monitor each bank’s margin guidance, REIT refinancing calendars and the next MAS policy update. |
The research priority is relevance rather than sheer citation volume. Repeated references to the same press release do not represent independent confirmation, and authoritative data can support a narrower claim than an ambitious headline suggests. Wherever a numerical fact is used, the source date and stated coverage should travel with it.
How to interpret the evidence without overclaiming
Returns should include dividends and currency. Singapore blue-chip investors often consider income alongside capital appreciation. Sustainable distribution policy and changes in the Singapore dollar can alter the comparison with other markets. In this article’s subject—the Singapore stock market outlook 2027—that distinction prevents superficially precise figures from becoming misleading conclusions. A credible account should explain exactly which evidence supports each inference and what would change the analysis.
Property and banking are economically connected. Financing costs influence both commercial property values and bank lending profitability. They may respond differently, though, because banks and leveraged property trusts have different asset-liability structures. Monitor each bank’s margin guidance, REIT refinancing calendars and the next MAS policy update. These checks are important because individual data points can be correct while the story assembled from them is incomplete.
Three specific tests make the coverage stronger:
- Bank margins versus STI return. Ask what the underlying observation actually measures, which population or companies it covers, and how recent it is. A relevant primary document outweighs a popular unsourced claim.
- FX-adjusted performance. Compare plausible explanations and resist attributing every market or policy movement to one event. When an observed change has several possible causes, explain which are supported and which remain hypotheses.
- REIT debt maturity analysis. Describe what new fact would falsify the prevailing interpretation. Reporting that cannot be revised in the face of new evidence is advocacy, not analysis.
A Singapore investor’s 2027 scenario map
Dividends hold, and margins normalise gently. If credit quality stays strong and loan growth offsets some narrowing in lending margins, the major banks may remain an important source of total return. For income investors, sustainable distribution policies would matter more than the STI’s ability to match the Nasdaq in a technology rally. MAS’s appreciating currency path could also cushion imported price pressure.
Funding costs expose fragile yields. High global yields and softening property rents could pressure highly leveraged REITs; expensive deposits and weak loan demand could test bank profitability. In this scenario, a superficially generous distribution yield would be less attractive when weighed against refinancing risk and possible cuts. Study debt maturities and asset quality rather than chasing the highest published yield.
The index proves resilient but slow. A third outcome is steady dividends with limited capital appreciation as global trade cools and Singapore’s exceptional manufacturing boost fades. That may still suit a long-horizon income mandate, but international investors must account for currency effects. The relevant benchmark is a risk-adjusted, dividend-inclusive return compared with alternatives of similar risk.
A practical research checklist
A reader evaluating this issue should first open the primary sources linked in the article and check their publication dates. Next, identify the specific claim being tested, its units and its geographic or institutional scope. Then compare that evidence with at least one independent account, asking whether the sources are reporting the same underlying data or repeating one another. Finally, distinguish a dated observation from a prediction and note the developments that would demand an update.
For a working editorial desk, this sequence is equally important. A clearly dated article can remain valuable after prices or politics change if its explanations endure and its volatile numbers are identified as snapshots. An article that quietly presents yesterday’s quote as today’s fact, by contrast, loses credibility even when the broader argument is sensible.
A final distinction worth checking
One additional constraint deserves attention: financial-sector concentration can make the benchmark appear stable even while many smaller Singapore-listed businesses experience weaker trading volume. The STI is not a complete measure of the exchange’s breadth. Before labelling Singapore a safe haven, compare advance-decline statistics, dividend coverage and credit trends beyond the three largest lenders. A foreign investor should also calculate returns after currency conversion and any applicable withholding treatment. These checks reveal whether resilience comes from sustainable operating cash flows or merely from limited exposure to the companies currently being sold.
Questions readers are asking
What is the STI?
The Straits Times Index is Singapore’s principal blue-chip equity benchmark, with substantial exposure to banks and other established businesses.
Does MAS set policy like the U.S. Fed?
No. Singapore’s monetary framework primarily manages the Singapore dollar nominal effective exchange-rate policy band.
What matters most for bank stocks?
Net interest margin, loan growth, asset quality, fee income, capital ratios and sustainable dividends.
Are REIT yields guaranteed?
No. Distributions and unit prices fluctuate with financing, leasing and property conditions.
The judgment
Singapore’s stock market has a different vulnerability from the Nasdaq: banks, dividends, interest margins and the currency policy that shapes returns. The most responsible conclusion is conditional: Monitor each bank’s margin guidance, REIT refinancing calendars and the next MAS policy update. The argument should evolve when new source material is published, rather than being defended simply because it made a compelling headline on November 6. For readers, the value is a clearer distinction among what has already happened, what remains uncertain and what developments would actually change the decision.
Discover more from The Economy
Subscribe to get the latest posts sent to your email.

Bitcoin’s Dollar Trap: The Chart That Exposes the Future of Money

Dow Jones Today: Dow Slips 237 Points After the Worst Day Since April 2025

Australia’s AI-Driven Economic Strategy Is Redefining National Resilience

2027 Federal Tax Brackets: New IRS Rates and Standard Deductions Explained

Democrats Won Congress. Can They Fix the U.S. Economy

Stock Market Crash 2026? What the November Rout Actually Tells Us

IMF Global Outlook 2027: The Recovery Is Real, but the Divide Is Growing

World Bank Debt Report 2026: The $9.4 Trillion Burden Behind the Recovery

Singapore Stock Market Outlook 2027: The STI’s Bank-and-Yield Test

Asian Stock Markets: Why the AI Rout Is Dividing the Region

Global Markets Today: The AI Sell-Off Has Become a Test of Liquidity

Global Finance 2027: Debt, Inflation and AI Are Pulling the Economy Apart

Brian Kemp’s Georgia Legacy: Economic Growth, Elections and the Costs of His Policy Choices

Dow Futures vs Dow Jones: What E-mini Contracts Really Tell You Before Wall Street Opens

Social Security Extra $90 Deposit: Who Qualifies for the October 2026 Medicare Rebate?

Gold Price Outlook 2026: The Forces Behind the Forecasts—and What Could Reverse Them

Stock Market Crash in 2026? Warning Signs, Scenarios and a Calm Investor Checklist

US–China Critical Minerals Competition: Why a Trade Deal Cannot Fix Every Supply Risk

US–Iran Conflict in October 2026: Hormuz, Oil Prices and Diplomacy

Anthropic Bans Sustained Abuse of Claude AI Under New Usage Policy Effective November 12, 2026

US–China AI Export Controls in 2026: Chips, Testing Rules and Corporate Risk

SSI November 2026 Payment: Why Benefits Arrive October 30

China’s AI Microdrama Boom: How Beijing Is Reshaping Global Media

Pakistan IMF Programme 2026: Why Bailouts Keep Returning

Jeff Bezos Three-Day Workweek View: What He Really Said

Q3 2026 Earnings Preview: Can Record Profit Expectations Keep Wall Street’s Rally Alive?
Dow Jones Today: Dow Slips 237 Points After the Worst Day Since April 2025
2027 Federal Tax Brackets: New IRS Rates and Standard Deductions Explained
-

 Markets & Finance10 months ago
Top 15 Stocks for Investment in 2026 in PSX: Your Complete Guide to Pakistan’s Best Investment Opportunities
-

 Analysis9 months ago
Johor’s Investment Boom: The Hidden Costs Behind Malaysia’s Most Ambitious Economic Surge
-

 Analysis9 months ago
Top 10 Stocks for Investment in PSX for Quick Returns in 2026
-

 Banks10 months ago
Best Investments in Pakistan 2026: Top 10 Low-Price Shares and Long-Term Picks for the PSX
-

 Analysis9 months ago
Brazil’s Rare Earth Race: US, EU, and China Compete for Critical Minerals as Tensions Rise
-

 Investment10 months ago
Top 10 Mutual Fund Managers in Pakistan for Investment in 2026: A Comprehensive Guide for Optimal Returns
-

 Global Economy11 months ago
15 Most Lucrative Sectors for Investment in Pakistan: A 2025 Data-Driven Analysis
-

 Global Economy11 months ago
Pakistan’s Export Goldmine: 10 Game-Changing Markets Where Pakistani Businesses Are Winning Big in 2025