
Asia
Pakistan’s Growth Outlook Dims: Why the IMF’s Latest Cut to 3.2% Matters for 2026 and Beyond

Pakistan has witnessed many ups and downs in its economic oulook . The latest IMF Cut is an eye-opener for all . This tension crystallized in late January 2026 when the International Monetary Fund, in its closely watched World Economic Outlook Update titled “Global Economy: Steady Amid Divergent Forces,” downgraded Pakistan’s GDP growth projection for the current fiscal year (FY2026, running July 2025–June 2026) from 3.6% to 3.2%. The revision—subtle in numerical terms but significant in trajectory—reflects mounting headwinds that differentiate Pakistan’s recovery from the global economy’s steadier path and regional peers’ stronger rebounds. While the IMF projects world growth at 3.3% in 2026 and 3.2% in 2027, buoyed by artificial intelligence investment and resilient consumer spending in advanced economies, Pakistan’s outlook reveals a nation struggling to translate macroeconomic stabilization into broad-based expansion.
Understanding why the IMF trimmed expectations—and why the gap between government targets and multilateral forecasts persists—requires examining not just Pakistan’s immediate fiscal and monetary constraints, but the deeper structural forces shaping emerging markets in an era of technological divergence, climate vulnerability, and geopolitical realignment.
The IMF’s Revised Numbers: What Changed and Why It Matters
The January 2026 downgrade represents the IMF’s third adjustment to Pakistan’s near-term outlook in six months. In October 2025, the Fund had projected 3.6% growth for FY2026, itself a modest upgrade from earlier 3.4% estimates following Pakistan’s successful completion of a $3 billion Stand-By Arrangement and entry into a new $7 billion Extended Fund Facility program. Now, at 3.2%, the projection sits uncomfortably below both the government’s optimistic 4.2% target and even the World Bank’s more conservative 3.4% estimate for FY2026-27.
The IMF’s medium-term trajectory shows similarly tepid expansion: 3.0% for calendar year 2025, 3.2% for 2026, rising to just 4.1% by 2027. For context, Pakistan averaged 5.5% annual growth during 2003–2007, and even the crisis-prone 2008–2018 decade saw average expansion near 3.8%. The current projections suggest Pakistan will underperform its own historical potential for at least another three years—a sobering reality for a nation of 240 million where demographic dividends demand growth rates closer to 6–7% to absorb new labor market entrants and reduce poverty meaningfully.
What prompted the downward revision? The IMF’s public commentary emphasizes three factors: weaker-than-expected agricultural output following irregular monsoons, slower credit growth to the private sector despite monetary easing, and persistent energy sector circular debt constraining industrial activity. Unpacking these reveals interconnected challenges that stabilization programs alone cannot resolve.
Table 1: Pakistan GDP Growth Projections Comparison (Percent)
| Source | FY2025 | FY2026 | FY2027 |
|---|---|---|---|
| IMF (January 2026) | 3.0 | 3.2 | 4.1 |
| World Bank (December 2025) | 3.0 | 3.4 | — |
| Pakistan Government | 3.5 | 4.2 | 5.0 |
| National Accounts Committee (actual FY2025) | 3.09 | — | — |
The divergence between official targets and multilateral forecasts isn’t mere technocratic disagreement—it reflects fundamentally different assumptions about reform implementation speed and external financing availability. Pakistan’s government builds budgets assuming 4–5% growth to meet revenue targets and debt service obligations; lower actual growth creates fiscal slippage, requiring either spending cuts or higher borrowing, which further constrains growth. This negative feedback loop has characterized Pakistan’s economy for much of the past decade.
Global Backdrop: Divergent Forces and Pakistan’s Positioning
The IMF’s broader January 2026 outlook paints a global economy managing surprising resilience despite headwinds. World growth projections were revised slightly upward—from 3.2% to 3.3% for 2026—driven primarily by what the Fund terms “AI-powered investment momentum” in the United States and parts of Asia. American business investment in data centers, chip manufacturing, and AI infrastructure has exceeded expectations, while consumption remains robust despite elevated interest rates. China’s economy shows tentative stabilization near 4.5% growth as property sector adjustments moderate and manufacturing exports hold steady.
Yet the report’s subtitle—”Steady Amid Divergent Forces”—captures crucial heterogeneity. Advanced economies benefit from productivity-enhancing technologies and deep capital markets that fund innovation; emerging markets face tightening credit conditions, commodity price volatility, and rising debt service costs. Trade policy uncertainty, particularly around U.S. tariff proposals and European Union carbon border adjustments, creates additional turbulence for export-dependent developing nations.
Pakistan sits uncomfortably in this divide. Unlike India, which attracts AI and semiconductor investment as part of global supply chain diversification, or Vietnam and Bangladesh, which have absorbed textile and electronics orders shifting from China, Pakistan struggles to position itself in reconfiguring trade networks. The country’s export basket remains dominated by low-value textiles and agricultural products, vulnerable to both price competition and climate shocks. Meanwhile, import dependence on energy and industrial inputs means Pakistan often grows fastest when its current account deficit widens dangerously—a pattern that has triggered repeated balance-of-payments crises.
The AI boom illustrates this divergence starkly. While Microsoft, Google, and regional champions invest tens of billions in Indian AI research centers and data infrastructure, Pakistan’s tech sector—though talented—lacks the regulatory clarity, digital infrastructure, and access to patient capital needed to participate meaningfully. Energy unreliability alone makes Pakistan an unlikely data center destination. The result: Pakistan watches from the sidelines as technological transformation reshapes competitive advantages globally.
Comparative Analysis: Why Forecasts Diverge
The gap between the government’s 4.2% FY2026 target and the IMF’s 3.2% projection merits deeper examination. Pakistan’s planning ministry bases optimistic scenarios on several assumptions: successful agricultural recovery to 3.5% growth (from 1.1% in FY2025), industrial sector expansion to 4.8% (from 2.8%), and services accelerating to 4.5% (from 3.9%). These assume normal weather, uninterrupted energy supply, and Chinese investment inflows through the China-Pakistan Economic Corridor (CPEC) revival.
The IMF’s skepticism rests on track records. Agriculture depends on monsoon patterns increasingly disrupted by climate change; Pakistan’s water storage capacity—just 30 days versus 120+ in peer countries—offers minimal buffer against rainfall variability. Industry faces structural constraints: the energy circular debt exceeds $2.5 billion and rising, while capacity payments to idle power plants drain fiscal resources without supporting production. Services growth, though relatively resilient, depends partly on remittance-fueled consumption that slows when Gulf employment opportunities contract or exchange rate volatility discourages informal transfers.
Regional comparisons sharpen the picture. India’s economy is projected to grow 6.5% in FY2026, driven by infrastructure investment, digital service exports, and manufacturing diversification. Bangladesh targets 6.0%+ growth as garment exports recover and renewable energy projects expand capacity. Even Sri Lanka, emerging from sovereign default just two years ago, projects 3.5% growth with IMF support. Pakistan’s 3.2% forecast places it in the bottom quartile of South Asian performers—a reversal from the 1990s when it often matched or exceeded regional averages.
What explains Pakistan’s relative underperformance? Three factors stand out. First, debt sustainability concerns constrain fiscal space; Pakistan’s public debt-to-GDP ratio near 75% and external debt service absorbing 35–40% of export earnings leaves minimal room for growth-supporting public investment. Second, political uncertainty—including judicial-political confrontations and civil-military tensions—deters private investment and complicates reform implementation. Third, structural reforms essential for productivity growth—energy market liberalization, export competitiveness restoration, human capital development—advance slowly or stall amid vested interest opposition.
The National Accounts Committee’s data provides a reality check. Actual FY2025 growth of 3.09% undershot both government projections (3.5%) and initial IMF estimates (3.3%), while Q1 FY2026 expansion at 3.71% reflected base effects and agricultural recovery rather than broad-based momentum. Manufacturing output remains below pre-pandemic levels, and construction activity—a bellwether for confidence—stagnates.
Underlying Drivers and Risks: Beyond the Headlines
Pakistan’s growth challenge reflects interlocking constraints that stabilization programs address incompletely. Consider the energy sector paradox. Pakistan has installed generation capacity exceeding peak demand—roughly 42,000 MW versus 30,000 MW peak load. Yet daily power cuts disrupt manufacturing, and circular debt balloons because distribution losses (technical and theft-related) exceed 17%, while tariff levels remain politically difficult to adjust to cost-recovery levels. The government pays $3+ billion annually in capacity payments to independent power producers for electricity not generated or not paid for—a fiscal hemorrhage that crowds out education and infrastructure spending.
Debt dynamics compound constraints. Pakistan’s external debt service obligations average $25 billion annually through 2027, requiring continuous IMF engagement and bilateral rollovers from China, Saudi Arabia, and the UAE to avoid default. This “bailout cycle” channels foreign exchange toward debt service rather than growth-supporting imports like machinery and technology. High domestic interest rates—still around 12% despite recent cuts—reflect both inflation memory and sovereign risk premiums that make private sector borrowing expensive even as the central bank eases policy.
Export competitiveness erosion presents a third binding constraint. Pakistan’s merchandise exports have stagnated near $30 billion for the past decade while Bangladesh’s doubled to $50+ billion and Vietnam’s surged to $350+ billion. Multiple factors explain this: real exchange rate appreciation during boom periods, energy costs that exceed regional competitors, logistics inefficiencies (it takes 21 days to export a container from Karachi versus 8 from Chittagong or 6 from Ho Chi Minh City), and failure to diversify beyond textiles. Pakistan’s share of global apparel exports has declined from 2.1% in 2010 to 1.6% in 2024 despite lower labor costs than China or India.
Climate vulnerability adds to headwinds. Pakistan contributes less than 1% of global emissions but ranks in the top ten most climate-vulnerable nations. The 2022 floods displaced 33 million people and caused $30 billion in damages—roughly 10% of GDP—demonstrating catastrophic downside risks that growth projections often inadequately incorporate. Irregular monsoons, glacial melt unpredictability affecting Indus water flows, and rising heat extremes threaten both agriculture (21% of GDP, 37% of employment) and urban productivity.
Political economy factors cannot be ignored. Pakistan’s reform record reveals a pattern: crises force IMF programs and initial policy adjustments, but as pressure eases, reforms stall or reverse. Energy tariff adjustments get delayed, tax broadening faces pushback from powerful lobbies, and state-owned enterprise losses accumulate. This stop-go pattern prevents the sustained policy credibility needed to attract long-term investment and integrate into global value chains. Recent political polarization—with former Prime Minister Imran Khan’s party excluded from parliament despite popular support—raises governance risks that investors price into their decisions.
Policy Implications and Pathways to Higher Growth
Moving Pakistan’s growth trajectory from the IMF’s 3–4% range toward the 6–7% the country needs requires addressing root causes, not just symptoms. Five policy domains merit prioritization:
Fiscal sustainability beyond austerity. Pakistan needs tax reform that broadens the base (currently only 2.5 million of 240 million citizens file income tax returns) while simplifying compliance. This requires political will to tax agriculture and retail sectors that currently enjoy exemptions. Equally important: phasing out untargeted energy and commodity subsidies that cost 2–3% of GDP annually while benefiting middle and upper classes disproportionately. Redirecting these resources toward targeted social safety nets and growth-supporting infrastructure would improve both equity and efficiency.
Energy sector transformation. Breaking the circular debt cycle demands difficult choices: adjusting tariffs to cost-recovery levels through gradual, pre-announced schedules that allow households and businesses to adapt; renegotiating or retiring expensive capacity payment contracts; investing in distribution infrastructure to reduce losses; and accelerating renewable energy deployment to lower generation costs long-term. The Renewable Energy Policy framework exists but implementation lags due to financing gaps and bureaucratic obstacles. Pakistan’s solar and wind potential could power rapid industrial growth if unlocked.
Export competitiveness revival. This requires moving beyond generic calls for “export-led growth” toward specific interventions: special economic zones with reliable energy and streamlined customs (learning from Bangladesh’s export processing zones or Vietnam’s industrial parks); trade facilitation reforms that cut documentation time and costs; support for moving up value chains in textiles (from yarn to finished garments to design) and diversifying into sectors like light engineering, pharmaceuticals, and IT services where Pakistan has latent comparative advantages.
Human capital and technology adoption. Pakistan’s adult literacy rate near 60% and tertiary enrollment below 15% constrain productivity growth. Investing in education—particularly girls’ secondary education in rural areas—generates high returns but requires sustained funding and teacher quality improvements. Similarly, digital infrastructure gaps (4G coverage reaches only 60% of territory; broadband penetration lags regional peers) limit tech sector growth and agricultural productivity gains from precision farming. Public-private partnerships modeled on India’s digital India initiative or Rwanda’s smart agriculture programs could accelerate progress.
Private investment climate. Pakistan ranks 108th of 190 countries in the World Bank’s Doing Business indicators, reflecting regulatory complexity, contract enforcement delays, and policy unpredictability. Improving this requires not just regulatory simplification but sustained political stability that assures investors reforms won’t reverse. The government’s recent “Special Investment Facilitation Council” mechanism—fast-tracking approvals for strategic projects—shows potential if maintained beyond current political cycles.
These reforms interact synergistically. Fiscal consolidation creates space for infrastructure investment; energy reliability enables export competitiveness; education improvements enhance technology absorption. But sequencing matters: front-loading politically difficult tax and energy reforms builds credibility for subsequent measures, while early wins in trade facilitation or digital services can demonstrate reform dividends to skeptical publics.
Forward Outlook: Scenarios Through 2030
Pakistan’s growth trajectory over the next five years depends on policy choices and external conditions that remain genuinely uncertain. Three scenarios illustrate the range:
Base Case (40% probability): Muddling Through (3–4% annual growth). Pakistan maintains IMF program compliance, avoiding balance-of-payments crisis but advancing structural reforms slowly. Agriculture grows 2.5–3.5% depending on weather; industry expands 3–4% constrained by energy issues; services sustain 4–5% on remittance support. External financing remains available but expensive; political tensions persist without escalating to crisis. By 2030, GDP per capita reaches $1,800 (from $1,500 in 2025), insufficient to exit lower-middle-income status or absorb labor force growth without rising unemployment. This resembles the past decade’s trajectory—stable but stagnant relative to potential and peers.
Upside Case (30% probability): Reform Breakthrough (5–6% annual growth). A political settlement enables sustained reform implementation. Energy circular debt resolution and renewable deployment improve industrial competitiveness; tax reforms increase revenue-to-GDP from 10% to 14%, funding infrastructure; export competitiveness initiatives attract foreign investment in manufacturing; CPEC revival brings Chinese capital for special economic zones; and climate adaptation investments reduce disaster vulnerability. Services including IT exports (currently $3 billion) triple by 2030. GDP per capita reaches $2,200, approaching Vietnam’s current level. This requires not just good policies but political will and external support that Pakistan has struggled to sustain historically.
Downside Case (30% probability): Crisis and Contraction (1–2% annual growth or periods of negative growth). Political instability escalates, deterring investment; a climate disaster or external shock (Gulf recession cutting remittances; U.S.-China trade war disrupting textile orders) triggers balance-of-payments crisis; IMF program breaks down amid reform resistance; and debt restructuring becomes necessary. Growth collapses to 1–2% as import compression and fiscal austerity bite; unemployment rises, spurring social unrest; and capital flight accelerates. This scenario resembles Sri Lanka’s 2022 crisis but potentially with greater geopolitical complications given Pakistan’s nuclear status and regional tensions.
Importantly, these scenarios aren’t predetermined. Pakistan retains agency through policy choices, even as external constraints bind. The IMF’s 3.2% projection likely reflects roughly 60% base case, 25% downside risk, and 15% upside potential—more pessimistic than optimistic given recent track records.
Regional context matters for these scenarios. If India sustains 6–7% growth and Bangladesh 6%, the competitive pressure on Pakistan intensifies; skilled workers migrate, investors compare returns unfavorably, and the political costs of stagnation rise. Conversely, global slowdown or regional instability might lower the bar for “acceptable” performance but wouldn’t reduce absolute development needs.
Conclusion: Broader Lessons for Emerging Markets
Pakistan’s growth challenge—encapsulated in the IMF’s latest downgrade—illustrates a broader emerging markets dilemma in the 2020s. Macroeconomic stabilization, while necessary, proves insufficient for sustainable growth when structural constraints remain unaddressed. Pakistan has achieved relative price stability (inflation declined from 38% to 8%), currency reserves recover to adequate levels (now covering 3+ months of imports), and fiscal deficits narrow (primary surplus of 0.5% of GDP projected). Yet growth disappoints because energy doesn’t flow reliably, exports don’t compete effectively, and investment doesn’t materialize at scale.
This pattern recurs across developing nations: Egypt maintains IMF programs while struggling to exceed 3–4% growth; Kenya achieves fiscal consolidation but sees limited employment creation; and even reform success stories like Senegal or Côte d’Ivoire hit 5–6% growth but worry about sustainability as commodity windfalls fade. The common thread: stabilization addresses symptoms of crisis but doesn’t automatically build the institutional capacity, infrastructure quality, or human capital depth that compound growth requires.
For Pakistan specifically, the IMF’s 3.2% projection should serve as both warning and motivation. Warning: current trajectories won’t generate the prosperity growth or employment absorption Pakistan’s young population needs; social contract strain will intensify if per capita income stagnates while inequality widens. Motivation: the gap between 3% and 6% growth isn’t unbridgeable—regional peers demonstrate feasibility—but closing it demands policy ambition and political courage that have proven elusive.
Back in Karachi’s Saddar district, Asif Mahmood the textile merchant will make his production decisions based not on government targets or IMF projections, but on whether electricity runs 16 hours or 8, whether yarn costs stabilize or spike, and whether orders arrive from European buyers seeking reliable suppliers. Aggregate these individual decisions across millions of firms and households, and they become the reality that forecasts attempt to capture. Pakistan’s growth outlook will brighten when the structural foundations—energy, exports, education, institutions—make optimism rational rather than aspirational. Until then, even the IMF’s cautious 3.2% carries downside risks that stabilization alone cannot eliminate.
The question facing Pakistan’s policymakers isn’t whether 3.2% growth is acceptable—it clearly isn’t for a nation of 240 million with median age 23. The question is whether the political economy can finally align around the sustained, often painful reforms that higher trajectories require. On that, even the most sophisticated econometric models remain honestly uncertain.
Discover more from The Economy
Subscribe to get the latest posts sent to your email.



With the S&P 500 yielding a historically thin 1.2% and trading at a P/E above 31 following its 2025 rally, income-focused investors have been forced to look further afield. Europe and Asia’s blue-chip dividend payers are filling that gap — offering yields two to five times the U.S. benchmark, backed in many cases by decades of uninterrupted payout growth. Here is where the highest-quality income is actually sitting in 2026, and where headline yield is masking real risk.
Why U.S. Yields No Longer Cut It
The math is straightforward. As Sure Dividend notes, the S&P 500 closed out 2025 with a year-to-date total return of nearly 19%, pushing its price-to-earnings ratio above 31 and compressing yields across the board. Even reliable U.S. dividend growers now offer modest current income: NextEra Energy yields just 2.7% (though it is growing its payout at a 6% compound annual rate through 2028), Coca-Cola yields about 2.7%, and Mastercard — despite raising its dividend more than 9,500% since its first payment — yields a mere 0.7%, according to The Motley Fool. For investors who need current income rather than pure growth, that combination of high valuations and low yields has made the U.S. market a difficult place to build an income portfolio in 2026.
Europe: Insurance and Compounders Lead on Yield
European blue chips have emerged as the highest-conviction income allocation for 2026, according to screening data from Dividend Talk, which evaluates stocks on dividend safety, valuation, and long-term growth rather than headline yield alone.
Top European dividend stocks (verified June 17, 2026):
| Stock | Yield | Sector |
|---|---|---|
| Munich Re | 5.17% | Reinsurance |
| ASR Nederland | 5.15% | Insurance |
| Wolters Kluwer | 4.21% | Information services |
| Novo Nordisk | 4.10% | Pharmaceuticals |
| Fuchs Petrolub | — | Specialty lubricants |
| London Stock Exchange Group | — | Financial market infrastructure |
| Halma | — | Safety/health technology |
| RELX | — | Information/analytics |
| SAP | — | Enterprise software |
The critical distinction Dividend Talk draws is between yield and dividend safety. Munich Re, ASR Nederland, Wolters Kluwer, and Novo Nordisk all carry both an above-3.8% yield and a “Safe” or “Very Safe” internal safety rating, alongside multi-decade dividend records — meaning the yield is backed by durable free cash flow rather than a depressed share price masquerading as a bargain. That distinction matters most in the insurance names: Munich Re and ASR Nederland benefit structurally from higher reinsurance pricing following a run of costly global catastrophe years, giving their payouts unusually strong underlying support heading into 2026.
Asia: Banking and Semiconductor Leadership, With a Payout Caveat
Asian dividend stocks offer a different risk-reward profile, combining higher headline yields with more variable payout coverage. According to Analytics Insight’s 2026 Asia screen, DBS Group Holdings stands out with an estimated dividend yield of 5.4% to 6.1% — among the highest of any large-cap regional bank globally — supported by its wealth-management franchise, deep Southeast Asian deposit base, and digital banking scale.
Top Asian dividend stocks for 2026:
| Stock | Yield | Note |
|---|---|---|
| DBS Group Holdings | 5.4%–6.1% | Deep deposit base, wealth management scale |
| TSMC | Lower, growth-oriented | Semiconductor leadership, diversified cash flow |
| ITC | Moderate | Diversified conglomerate, business visibility |
| Anhui Heli | 3.3%–4.47% | Track payout coverage closely |
| Shibusawa Logistics | 3.3%–4.47% | Track payout coverage closely |
| Rheon | 3.3%–4.47% | Track payout coverage closely |
| Japan market payer (top-quartile yield) | ~4.0% | JPY 31/share; payout ratio 40.1% |
The caution flag in Asia sits with the smaller-cap names. Analytics Insight specifically flags that while stocks like Anhui Heli, Shibusawa Logistics, and Rheon offer attractive 3.3%–4.47% yields, investors need to verify free cash flow coverage before committing capital. One unnamed top-quartile Japanese dividend payer illustrates the risk clearly: its payout ratio of 40.1% suggests the dividend is covered by earnings but not comfortably by free cash flow, and its dividend history has been volatile over the past decade — a pattern that can quietly erode a portfolio’s income reliability even when the trailing yield looks attractive on a screener.
Building a 2026 Income Allocation: The Framework
The right approach for 2026 income investors is to treat yield as a starting filter, not a selection criterion. Analytics Insight’s own guidance is explicit: “investors should also consider key metrics such as payout ratio, free cash flow coverage, market position, and dividend consistency before investing” — a standard that immediately separates DBS, TSMC, and ITC (dependable large-cap options with strong business visibility) from the higher-yielding but less-established smaller names.
A practical due-diligence checklist before buying any high-yield stock in 2026:
- Payout ratio relative to earnings AND free cash flow — a dividend covered by earnings but not FCF is a warning sign, not a green light
- Dividend growth streak length — a multi-decade record (Novo Nordisk, RELX, SAP) filters out cyclical one-off high yields
- Sector tailwinds — European insurers are riding a hard reinsurance pricing cycle; Asian banks like DBS benefit from elevated regional rates and wealth inflows
- Currency exposure — unhedged EUR, SGD, and JPY dividend income introduces FX volatility that can offset or amplify the yield advantage over USD alternatives
Final Verdict
For income-focused investors priced out of a 1.2%-yielding, 31x-earnings S&P 500, Europe’s insurance and compounder names — led by Munich Re, ASR Nederland, Wolters Kluwer, and Novo Nordisk — currently offer the best combination of yield and safety available in developed markets. In Asia, DBS Group is the standout large-cap income name, while TSMC and ITC offer lower yields with stronger long-term visibility. The smaller Asian dividend payers can supplement a portfolio’s income but demand active monitoring of payout ratios rather than a buy-and-forget approach. The overarching 2026 lesson: geographic diversification into non-U.S. blue chips isn’t just a currency or growth play anymore — for income investors, it has become close to a necessity.
Discover more from The Economy
Subscribe to get the latest posts sent to your email.
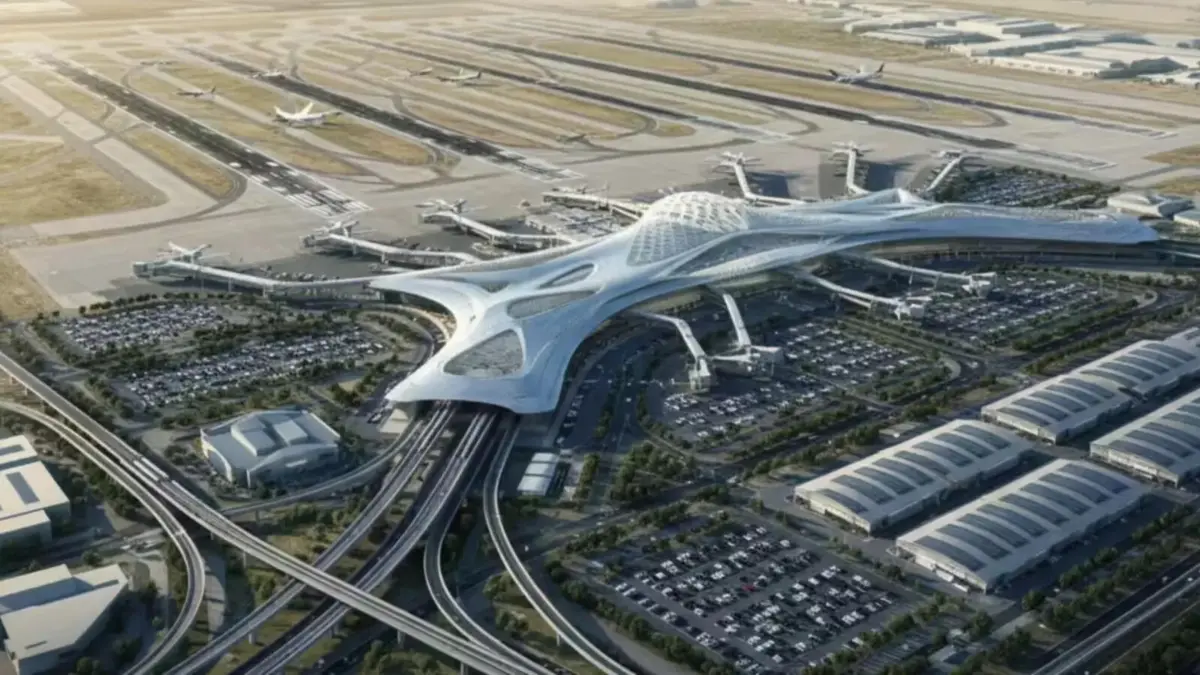
Dubai is in the middle of building what is intended to become the world’s largest airport by capacity — a Dh128 billion ($34.8 billion) expansion of Al Maktoum International Airport at Dubai World Central (DWC), according to Gulf News. When complete, the facility will feature five parallel runways, roughly 400 gates, and the capacity to handle up to 260 million passengers a year — nearly three times the current capacity of Dubai International Airport (DXB), already the world’s second-busiest airport for international traffic, per analysis from K Estates.
Where the project actually stands in 2026
Construction crews have already excavated more than 45 million cubic metres of earth and completed the airport’s second runway, according to MyBayut’s DWC guide. The first phase — a central passenger terminal and four concourses designed to handle 150 million passengers annually — is targeted for completion around 2032, per Khaleej Times. Dubai is set to allocate AED 55 billion worth of expansion contracts by the end of 2026 alone, underscoring the pace at which the project is being financed and built.
The scale of ambition extends beyond aviation infrastructure. DWC is being planned as a self-contained “airport city,” incorporating business, cultural, and residential districts across Dubai South, roughly 35 kilometres from Dubai Marina, according to the same Khaleej Times reporting. All operations currently based at DXB — including Emirates’ long-haul network — are expected to eventually transfer to the new hub.
Part of a much bigger regional aviation build-out
Al Maktoum’s expansion is the largest single project within a broader regional wave of investment: airports across the Middle East, Africa, and South Asia are expected to spend a combined $183 billion on capacity, connectivity, and passenger-experience upgrades, with the UAE and Saudi Arabia leading the push, according to Gulf News. Within the UAE alone, expansion plans extend beyond Dubai to Sharjah and Ras Al Khaimah, with a shared emphasis on AI-enabled operations, IoT systems, and energy-efficient terminal design.
What it means for the region’s real estate and travel markets
The airport build-out is already reshaping property markets nearby. Transactions in Dubai South exceeded AED 15 billion ($4.1 billion) in just the first five months of 2025 — nearly matching the entire AED 16.1 billion recorded across all of 2024 — with analysts forecasting further price appreciation as the airport nears completion, according to K Estates. For travellers and airlines, the eventual payoff is a dramatic increase in regional connectivity capacity at a time when global air travel demand — and airfares — have both been climbing steadily through 2026.
Key takeaways
- Al Maktoum International Airport’s expansion carries a price tag of roughly $34.8 billion (Dh128 billion) and is intended to make it the world’s largest airport by 2050.
- Full build-out capacity: five runways, ~400 gates, up to 260 million passengers annually and 12 million tonnes of cargo.
- Phase one, targeted for around 2032, alone will handle 150 million passengers a year.
- The project has already reshaped Dubai South real estate, with transactions surpassing AED 15 billion in the first five months of 2025.
- It is the anchor project within a broader $183 billion regional airport investment wave across the Middle East, Africa, and South Asia.
FAQ
When will Al Maktoum International Airport be the world’s largest? Full completion is projected around 2050, though the first major phase is targeted for roughly 2032.
How many passengers will Al Maktoum Airport handle? Up to 260 million passengers annually at full capacity, with the first completed phase alone handling 150 million.
Will Emirates move its operations to the new airport? Yes — all Dubai International Airport operations, including Emirates’ long-haul network, are expected to eventually transfer to Al Maktoum International.
Discover more from The Economy
Subscribe to get the latest posts sent to your email.
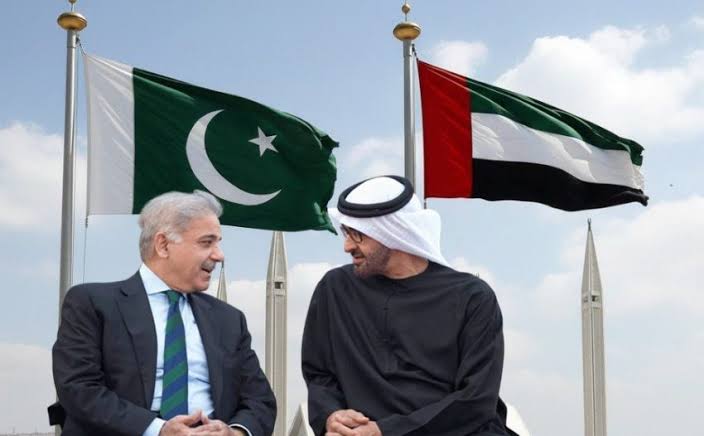
What happened: In early 2026, the United Arab Emirates declined to roll over a $3 billion loan to Pakistan — the first such refusal in seven years. The repayment equalled roughly 18% of Pakistan’s foreign currency reserves, arriving as Islamabad also faced a $1.3 billion bond payment and was waiting on the next IMF tranche.
Why it matters: It’s the clearest sign yet that Gulf sovereign patience with Pakistan’s balance-of-payments cycle is thinning, even as Gulf states simultaneously court China, Saudi Arabia, and each other for capital in a tightening regional liquidity environment.
The Story Nobody’s Connecting
Most coverage of Pakistan’s 2026 external account stress treats the UAE’s loan decision as an isolated liquidity event — a “routine financial transaction,” in the words of Pakistan’s own Ministry of Foreign Affairs. That framing misses the bigger pattern. The same weeks that Abu Dhabi called in its $3 billion, unusual delays began appearing in bank transfers from Saudi Arabia to the UAE itself — friction between the Gulf’s two largest economies, at a moment when both are also managing their own post-war oil price adjustment. (Pakistan & Gulf Economist)
Put those two data points together and a different story emerges: this isn’t just about Pakistan’s creditworthiness. It’s about Gulf capital becoming more selective, more transactional, and less willing to extend informal grace periods across the board — with Pakistan simply the most exposed borrower in the queue.
The Numbers Behind the Pressure
Pakistan’s State Bank held $16.4 billion in reserves as of late March 2026 — enough to cover roughly three months of imports, a threshold economists generally treat as a comfort floor, not a cushion. (Mettis Global News) The UAE’s declined rollover landed at the same time as a looming $1.3 billion international bond payment and dependence on the next $1.2 billion IMF disbursement — a convergence of obligations that left the State Bank with limited room to maneuver beyond import restrictions, rate hikes, or fresh commercial borrowing.
The backdrop matters too. The rupee had been trading in a comparatively narrow 278–282 band before the escalation of the Iran conflict pushed global oil prices higher, squeezing Pakistan’s import bill precisely when its Gulf safety net began to wobble. The KSE-100 benchmark, meanwhile, had already shed around 15% amid the broader pressure. (Mettis Global News)
This is not Pakistan’s first Gulf-dependency cycle. The IMF’s own record shows a now-familiar pattern: staff-level agreements reached in Dubai, UAE pledges of multibillion-dollar investment arriving alongside IMF tranches, and Gulf bridge financing used to stave off sovereign default in periods when reserves cover shrinks toward zero. (Business Standard) What’s different in 2026 is that the bridge itself is showing cracks.
Islamabad’s Official Line vs. the Structural Reality
Pakistan’s government has leaned into a “stability to sustainable growth” narrative around its FY2026–27 federal budget, with the finance minister framing the transition as export-driven rather than reserve-dependent. Business groups have broadly welcomed the budget, and the current account posted a $459 million surplus in May 2026, an improvement attributed to strong remittance inflows. (Business Recorder) The Monetary Policy Committee has held rates steady rather than reaching for emergency tightening, which is itself a signal that the central bank does not yet see the UAE episode as a systemic trigger.
But a current account surplus built substantially on remittances is different from one built on export competitiveness or durable FDI. Pakistan’s trade structure still leans heavily on a narrow set of partners: China supplies over a quarter of its imports and a meaningful share of its exports, the UAE is both a top export destination and its second-largest import source, and Gulf states collectively remain the primary channel for both remittances and emergency liquidity. (Wikipedia — Economy of Pakistan) That concentration is precisely what makes a single Gulf lender’s changed appetite so consequential.
Why the Oil Backdrop Compounds the Risk
None of this is happening in a vacuum. The IMF’s own July 2026 commentary noted that global oil markets “absorbed the war shock” from the Iran conflict, but cautioned that buffers — spare production capacity, strategic reserves, shipping insurance capacity — are running low. (IMF Blog) For an oil-importing, reserve-constrained economy like Pakistan, a second energy price shock without deeper buffers would land directly on the same reserves the UAE loan was meant to protect.
What to Watch Next
- Whether Saudi Arabia steps in as an alternative bridge lender, or whether the Riyadh–Abu Dhabi transfer friction signals a broader Gulf liquidity tightening that limits everyone’s appetite to backstop Pakistan.
- The pace and size of the next IMF tranche, and whether Fund conditionality shifts to demand deeper reserve buffers given the UAE precedent.
- Whether China increases its role as lender of last resort, deepening Pakistan’s dependency in exactly the direction Gulf financing was historically meant to offset.
Discover more from The Economy
Subscribe to get the latest posts sent to your email.

Stock Market Crash 2026? How the Trump $5,000 Dividend Impacts Global Inflation

Tax-to-GDP Ratio Explained: Global Benchmarks, Fiscal Sovereignty & 2026 Insights

Trade Deficit & Terms of Trade Explained: Global Impact, Real-World Examples, and 2026 Insights

Supply vs Demand Shocks Explained: Market Equilibrium, Inflation Risks & Policy Responses in 2026

Microeconomics vs. Macroeconomics Explained: Key Differences, Interdependence & Global Impact

Devaluation vs Depreciation: Clear Differences, Causes, and Economic Impact

Purchasing Power Parity (PPP) Explained: Global Rankings, Living Standards & Why Nominal Exchange Rates Mislead in 2026

Remittances 2026: Global Trends, Household Resilience & Economic Lifeline for Developing Nations

Stagflation Explained: Causes, Global Impact & 2026 Economic Outlook

Understanding Foreign Exchange Reserves: Key Purposes and Global Impact

The Business of Gaming and Tech: How Global Economies Are Driven by Digital Consumerism

Crypto Daily Outlook: Bitcoin, Altcoins, and the Future of Decentralized Finance

Anthony Scaramucci’s Crypto Prediction: Why MicroStrategy’s Move Is Bitcoin’s “iPhone Moment”

Best Dividend Stocks 2026: European & Asian Blue Chips

State Farm’s $5B Dividend 2026: Who Qualifies & Payout Dates

US-China Relations in Q3 2026: Trade Tariffs and Supply Chain Risks

Gold’s Wild 2026: From a Record $5,600 Peak to a 24% Crash and Back Toward $4,500

Oil Surges as Strait of Hormuz Traffic Collapses Again

The Rocket That Won’t Quit: Inside SpaceX’s Falcon 9 Launch Machine

Bank of England Set to Hold Rates Through Year-End, Reuters Poll Shows

SpaceX Starship Flight 14: First Orbital Attempt & Starlink V3 Launch Explained

The 2026 Crypto Regulatory Shift: What It Means for Institutional Investors

Top 30 Stocks for Investment in PSX for Massive ROI in 2026

AI Chip Stocks 2026: The Best Semiconductor Investments Beyond Marvell

Retail Earnings Week: What Home Depot, Target & Walmart Reveal

AI-Powered Training: The Next Multi-Billion Dollar Ecosystem in Fitness

Russia’s Black Sea Oil Exports Fall for a Fifth Straight Week

Tween Back-to-School Trends 2026: What’s Driving the $85B Season
-

 Markets & Finance8 months ago
Top 15 Stocks for Investment in 2026 in PSX: Your Complete Guide to Pakistan’s Best Investment Opportunities
-

 Analysis7 months ago
Johor’s Investment Boom: The Hidden Costs Behind Malaysia’s Most Ambitious Economic Surge
-

 Analysis7 months ago
Top 10 Stocks for Investment in PSX for Quick Returns in 2026
-

 Analysis7 months ago
Brazil’s Rare Earth Race: US, EU, and China Compete for Critical Minerals as Tensions Rise
-

 Banks8 months ago
Best Investments in Pakistan 2026: Top 10 Low-Price Shares and Long-Term Picks for the PSX
-

 Investment8 months ago
Top 10 Mutual Fund Managers in Pakistan for Investment in 2026: A Comprehensive Guide for Optimal Returns
-

 Global Economy9 months ago
15 Most Lucrative Sectors for Investment in Pakistan: A 2025 Data-Driven Analysis
-

 Global Economy9 months ago
Pakistan’s Export Goldmine: 10 Game-Changing Markets Where Pakistani Businesses Are Winning Big in 2025