
Markets & Finance
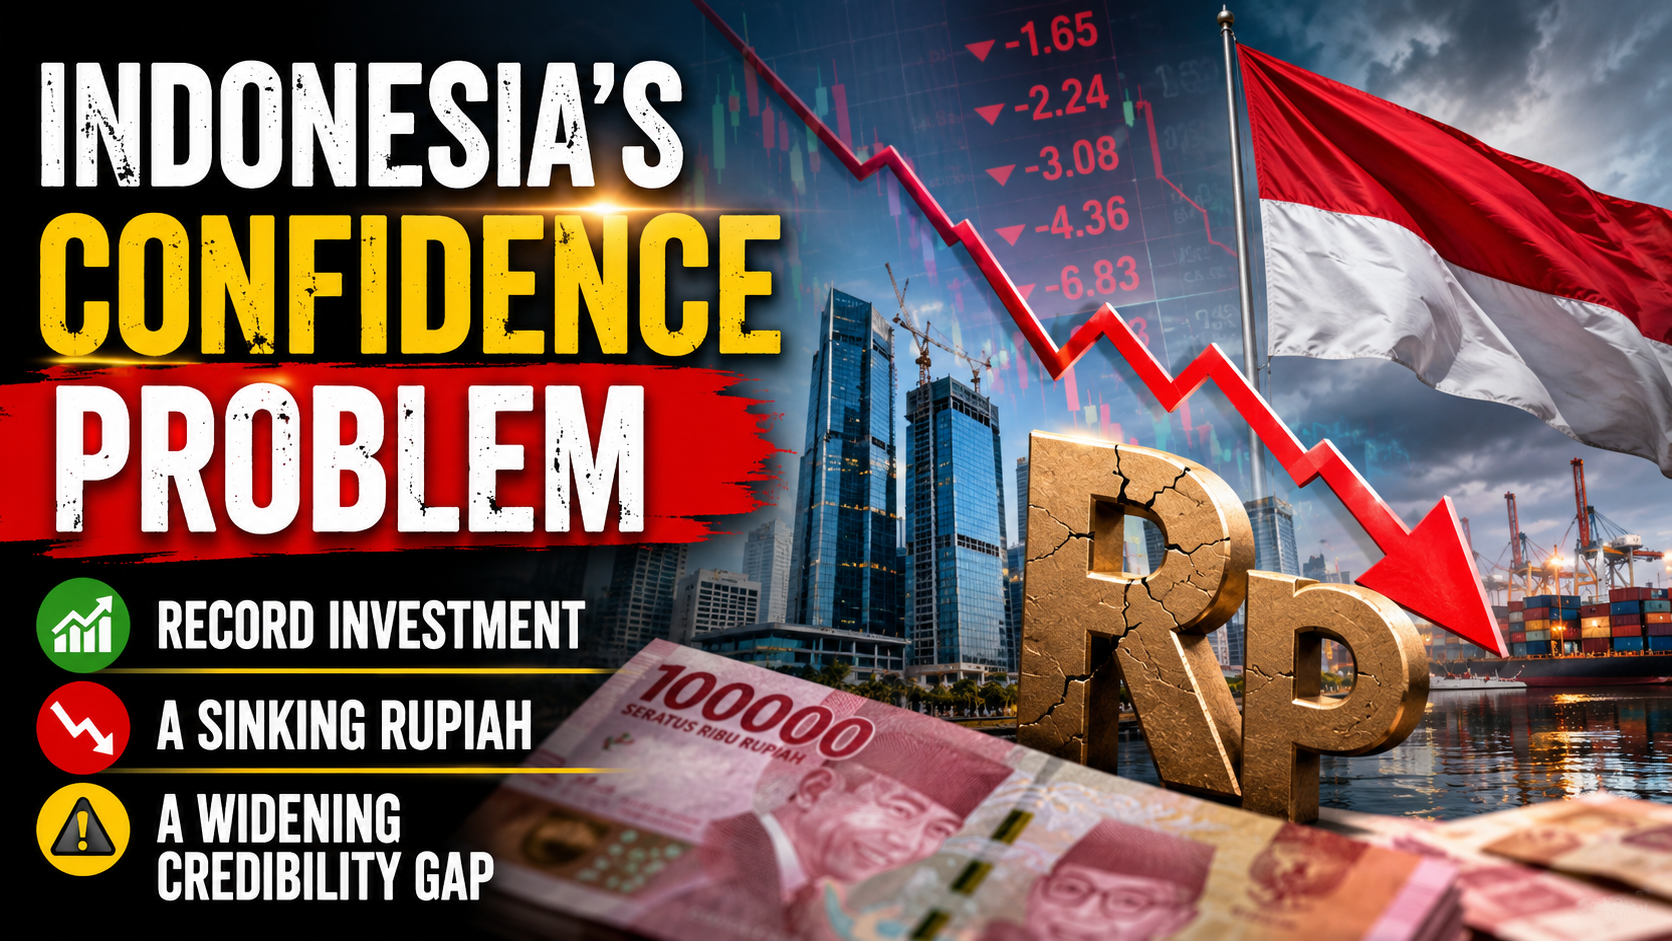
Indonesia’s Confidence Problem: Record Investment, a Sinking Rupiah, and a Widening Credibility Gap

Introduction
Indonesia’s economic story in mid-2026 is one of genuine contradiction. On one hand, the government posted a record Rp1,010.6 trillion ($56.1 billion) in realized investment for the first half of the year, up 7.2% from a year earlier and on pace to hit its full-year target (Antara News). On the other, the rupiah has been sliding toward Rp18,000 per US dollar, the state budget deficit has widened, and a growing chorus of domestic commentators is warning that Indonesia risks permanently losing what one Jakarta Post analysis called “the vital game of investor confidence” (The Jakarta Post).
The Investment Numbers Look Genuinely Strong
Indonesia’s Investment and Downstreaming Minister Rosan Roeslani reported that first-half 2026 investment realization reached 49.5% of the government’s full-year target of Rp2,041.3 trillion, creating 1.44 million jobs — a 15% increase in job creation compared to the first half of 2025 (Antara News). Domestic and foreign investment remained almost perfectly balanced, with foreign direct investment reaching Rp507.6 trillion (50.2% of the total) against Rp502.9 trillion in domestic investment (Antara News). Notably, investment outside the country’s most populous island, Java, exceeded inflows into Java itself for the first time in this dataset — Rp507.8 trillion versus Rp502.8 trillion — supporting the government’s long-standing goal of more balanced regional development (Antara News).
Singapore remained by far Indonesia’s largest source of foreign capital at $8.8 billion, followed by Hong Kong ($7.6 billion), China ($3.9 billion), Japan ($1.9 billion) and the United States ($1.7 billion) — together accounting for roughly 77.8% of all foreign direct investment into the country (Antara News). Second-quarter investment specifically rose 7.1% year-on-year to Rp511.8 trillion, with Minister Roeslani noting that investor commitment to Indonesia has held up despite significant “geopolitical and geoeconomic challenges” globally (The Jakarta Post).
But the Pace Is Slowing, and the Currency Is Under Pressure
Despite the record absolute figures, the Jakarta Post notes that investment growth in 2026 has been running at a distinctly slower pace than the country achieved in recent prior years, even as it remains on track to hit the annual target (The Jakarta Post). Meanwhile Bank Indonesia has had to actively respond to renewed rupiah weakness, attributing the currency’s slide toward Rp18,000 per dollar to hawkish signals from Federal Reserve officials and broader movements in the US dollar index (Samuel Sekuritas Daily Economic Insights). The state budget deficit reached Rp196.5 trillion in the first half of 2026, equivalent to 0.76% of GDP (Samuel Sekuritas Daily Economic Insights).
There has been some relief more recently: a 27.4% surge in second-quarter foreign direct investment helped strengthen the rupiah, with USD/IDR trading around 17,990 in mid-July as softer US inflation data reduced the odds of a near-term Fed hike (TMGM). Even so, the US dollar has retained broad support from escalating Middle East geopolitical tensions, keeping the rupiah’s recovery fragile rather than decisive (TMGM).
Why Growth Forecasts Keep Getting Trimmed
International lenders have grown more cautious about Indonesia’s growth trajectory for 2026. The OECD has held its outlook at 4.7% year-on-year — a clear deterioration from 2025’s realized 5.1% growth — with most major lending institutions clustering around the 5.0% threshold, implying a loss of momentum after Indonesia posted 5.61% growth in the first quarter of 2026 alone (Indonesia Investments). The deceleration is attributed to a softening labor market, weakening consumer confidence, and contracting retail sales in the second quarter (Indonesia Investments). High global oil prices are compounding the pressure on the government’s fiscal balance, since Indonesia continues to subsidize a significant portion of domestically sold fuel — a policy that transmits global energy volatility directly into the state budget rather than shielding consumers from it entirely (Indonesia Investments).
The Deeper Warning: A Confidence Problem, Not Just a Cyclical One
The most pointed recent critique comes from domestic commentary rather than foreign analysts. A Jakarta Post opinion piece published July 20, 2026 argues Indonesia must halt what it describes as erratic policymaking and institutional erosion before the country permanently damages its standing in the “vital game of investor confidence,” framing the rupiah’s weakness and shifting global market conditions as symptoms of a deeper credibility issue rather than purely external shocks (The Jakarta Post). That framing matters for how the strong headline investment numbers should be read: capital is still arriving, but the terms on which it arrives, and the confidence with which it stays, are visibly more fragile than the raw totals suggest.
Strategic Bright Spots
Not every recent development points toward strain. India secured access to Indonesian critical minerals through several major agreements signed during Prime Minister Narendra Modi’s visit to Jakarta, part of a broader push by Indonesia to leverage its resource base for deeper strategic partnerships (Samuel Sekuritas Daily Economic Insights). Indonesia is also pursuing energy independence through B50 biodiesel and compressed natural gas development, aimed explicitly at reducing reliance on imported LPG — a structural move that, if successful, would reduce exactly the kind of imported-energy vulnerability now straining the budget (Samuel Sekuritas Daily Economic Insights).
Key Takeaways
- Indonesia posted a record Rp1,010.6 trillion ($56.1 billion) in H1 2026 investment, up 7.2% year-on-year, with foreign and domestic capital nearly evenly split.
- The rupiah has weakened toward Rp18,000 per dollar on hawkish Fed signals, though a Q2 FDI surge has since provided partial relief.
- International lenders have trimmed Indonesia’s 2026 growth outlook to around 4.7–5.0%, down from 5.1% realized growth in 2025.
- The H1 2026 budget deficit reached 0.76% of GDP, pressured by continued fuel subsidies amid high global oil prices.
- Domestic commentary increasingly frames Indonesia’s challenge as a credibility and policymaking issue, not merely a cyclical external shock.
Sources: Antara News, The Jakarta Post — Investment Growth, The Jakarta Post — Confidence Game, Samuel Sekuritas Daily Economic Insights, Indonesia Investments, TMGM
Discover more from The Economy
Subscribe to get the latest posts sent to your email.



Why does Pakistan struggle to tax retail, property and agriculture? Explore evidence, fiscal trade-offs and fairer reform choices for FY2026–27.
Key Takeaways
- The FY2026–27 budget sets an FBR federal tax-revenue target of Rs15.264 trillion, an estimate rather than an actual collection.
- Agricultural income taxation is substantially a provincial matter, while federal income and sales taxes involve other jurisdictions and rules.
- An effective reform must distinguish workers who cannot avoid withholding from economic activity that is poorly documented; the tax burden is not identical across sectors.
- The World Bank’s 2025 tax-reform announcement reported 1.5 million new taxpayers supported through revenue-system reform, a programme result requiring ongoing scrutiny.
A schoolteacher’s salary is visible every month. Many transactions in farming, wholesale trade or property, by contrast, can be harder for authorities to observe and value accurately. That difference lies at the heart of the Pakistan tax net problem. The federal government budgeted Rs15.264 trillion in FBR revenue for FY2026–27, according to the official budget book. Yet debates about higher taxes often focus on people whose incomes are already documented.
The issue is not that every farmer or shopkeeper pays nothing. They can face sales taxes, input taxes, withholding taxes, provincial levies and indirect price burdens. The real policy question is whether profitable income and economic activity are taxed consistently and fairly, without turning registration into an administrative punishment for small businesses.
How narrow is the Pakistan tax net, and what does narrow mean?
A narrow tax base means too much revenue comes from a limited range of identifiable people, transactions or imports while other income is harder to measure and collect from. The 2026–27 federal budget expects Rs15.264 trillion in FBR taxes, with gross federal taxes and other receipts also supporting provincial transfers. The target describes planned collections, not proof the base has broadened.
| Area | Typical enforcement difficulty | Sensible reform direction |
|---|---|---|
| Salaries | Regular payroll records | Accurate withholding and fair rates |
| Retail trade | Cash receipts and fragmented records | Simple digital invoicing |
| Agricultural income | Provincial rules; farm income variability | Comparable records and provincial enforcement |
| Property | Valuation and transaction transparency | Credible valuations and verified records |
| Professional services | Mixed cash and account receipts | Third-party matching with due process |
The World Bank’s June 2025 tax-project update described data and administration improvements that had helped add 1.5 million taxpayers. The number should not be mistaken for 1.5 million consistently paying high taxes every year. Registration, active filing and actual liabilities are different steps.
A fair scorecard would report tax collected per sector after refunds, number of active returns, audit adjustments upheld on appeal and compliance costs paid by honest firms.
Why is agricultural income tax such a difficult issue?
Under Pakistan’s constitutional distribution of tax powers, provincial governments hold the main responsibility for taxing agricultural income. That makes coordination essential: a federal speech cannot itself ensure consistent agricultural-income enforcement in Punjab, Sindh, Khyber Pakhtunkhwa and Balochistan.
Agriculture is not one homogeneous business. A small tenant farmer exposed to crop failure is very different from a large, highly profitable farming enterprise with irrigation assets and multiple income streams. Rules should protect small producers while making substantial taxable profits harder to conceal.
The Pakistan Economic Survey 2025–26 reported agriculture at 23.44% of GDP in FY26. That economic significance is one reason the sector receives attention in reform discussions, but GDP share does not equal the share of people liable for agricultural income tax. Production value contains wages, inputs and costs; it is not identical to taxable net income.
A credible system requires usable land and crop records, transparent treatment of losses, protection against arbitrary assessment and data-sharing between federal and provincial agencies.
Why is Pakistan’s tax net considered narrow?
Large parts of economic activity are difficult to document or enforce against consistently, while payroll and formal transactions are easier to tax. A narrow base can make governments rely heavily on withholding and indirect taxes. It does not mean every farmer, shopkeeper or property owner pays zero taxes.
Why do cash-heavy retail markets remain hard to measure?
A retailer’s taxable profit is not equal to the cash that passes through the till. Shopkeepers pay rent, salaries, electricity and suppliers. Yet transactions without receipts can make it difficult to verify sales, input credits or profit. Complex filing rules can also discourage small shops from formalising.
Take a shop that records Rs1 million in monthly sales with Rs850,000 in legitimate goods and operating costs. Its gross-to-net calculation depends on inventory, returns and allowable expenses. Taxing total sales at an inappropriate profit rate would penalise thin-margin businesses; ignoring sales entirely would reward noncompliance. Accurate documentation allows both better assessment and fairer treatment.
The October 2026 IMF statement urges risk-based audits, digital invoicing and greater use of third-party data. Such systems can catch evasion while reducing arbitrary inspections, but only if data quality, appeal rights and taxpayer support are taken seriously.
Small retailers should receive genuinely simple registration and a chance to correct mistakes. Without that, digital tools become a new administrative barrier rather than a way to build trust.
What makes property tax and transaction tax so confusing?
Property sits at the intersection of federal taxes on specified income or transactions and provincial or local charges on ownership, transfer and registration. A headline that one federal provision has been abolished does not tell a buyer the complete cost of a transfer. Valuation differences between market prices and official records create obvious opportunities for understatement or disputes.
The Finance Act 2026 source should be consulted for federal provisions, while relevant provincial departments determine many transfer and property charges. A transaction may also face different rules according to purchase date, seller status and the type of property.
A reform with credibility would align valuations with observable evidence, keep an audit trail of major transfers and publish straightforward fee calculators. More transparency can improve revenue and reduce the bargaining power of unofficial intermediaries.
Tax policy should not be designed exclusively around reducing transaction costs for investors. It should also ask whether land and property rules support affordable housing, productive construction and efficient urban development.
Worked example: broadening the base without lifting payroll rates
Suppose a government needs Rs100 billion in additional annual revenue. One approach is to add that entire amount to an already compliant payroll base. Another is to collect Rs20 billion each from five previously under-documented groups through verified liabilities and lawful compliance. The total is the same, but the incidence is different. This is an illustrative allocation, not an estimate of evasion or the yield available in Pakistan.
To assess a real proposal, subtract the cost of collection and the compliance burden. If a scheme raises Rs100 billion but imposes Rs30 billion of administrative cost on firms, its economic payoff differs sharply from one raising the same tax with simple records and fewer disputes.
Fairness requires enforcement and appeal
A powerful institution can easily produce impressive audit notices. The harder task is to issue correct assessments, give taxpayers a reasonable response period and resolve appeals promptly. Digital enforcement should be measurable by collections sustained after appeal, not notices dispatched.
Which reforms should come first?
First, align federal and provincial definitions where legally possible, while respecting constitutional powers. Second, simplify filing for microbusinesses and identify fraudulent registrations through proportionate checks. Third, publish clear property valuation methods and reduce unofficial discretion. Fourth, link tax collection to visible public services and publish an independent assessment of whether exemptions produce jobs or investment.
The World Bank revenue project targets better data systems, transparent reporting and a broader base. The IMF reform recommendations of October 2026 also emphasise a simpler, fairer tax system. The policy challenge is to prevent digitalisation from becoming merely more aggressive surveillance of people already visible in databases.
Trust matters. Citizens are more likely to comply when powerful businesses and politically connected incomes face the same law, refunds arrive, and public money is accounted for. Durable revenue reform is as much an institutional project as a tax-rate decision.
What This Means for You
Salaried worker: Compare effective taxes, not only headline rates. Understand what payroll withholding covers and why broadening the base could reduce pressure for repeated rate increases in the future.
Shopkeeper: Keep separate business accounts, save invoices and learn the current rules for your category and jurisdiction. Good records can protect you from both underpayment penalties and arbitrary overassessment.
Farmer: Agricultural-income rules differ by province. Document yields, sales, rent and genuine expenses, and seek province-specific guidance before assuming federal salaried tax tables apply.
Property buyer: Obtain itemised federal and provincial tax estimates with a date and valuation basis; do not rely on an online claim that a property transaction is ‘tax-free’.
What to Watch Next
- 26 October 2026: The State Bank monetary-policy decision and any revision to its inflation assessment; verify any schedule change with the SBP.
- Early November 2026, exact release date to be confirmed: Pakistan Bureau of Statistics October inflation and merchandise-trade releases.
- Late October–November 2026, date not yet confirmed: Any IMF Executive Board announcement on the October staff-level agreement; staff agreement is not Board approval.
- Throughout FY2026–27: Updated SBP monthly balance-of-payments and remittance statistics; compare cumulative results rather than one month alone.
Frequently Asked Questions
Why is Pakistan’s tax net considered narrow?
Large parts of economic activity are difficult to document or enforce against consistently, while payroll and formal transactions are easier to tax. A narrow base can make governments rely heavily on withholding and indirect taxes. It does not mean every farmer, shopkeeper or property owner pays zero taxes.
Is agricultural income tax federal or provincial in Pakistan?
Agricultural income taxation largely falls under provincial jurisdiction, so rules and implementation differ across provinces. Federal income-tax provisions do not automatically substitute for provincial agricultural-income legislation. Farmers should verify applicable provincial rules and exemptions rather than rely on a national generalisation.
Does being registered with FBR mean a person paid income tax?
No. Registration, filing a return, declaring taxable income and paying an assessed amount are different steps. A person may file lawfully with no final income-tax liability. Evaluating tax reform requires more than counting newly registered taxpayers.
How can digital invoicing improve tax collection?
Digital records can make sales and input claims more verifiable, helping authorities target fraud and reducing manual disputes. But systems need simple onboarding, affordable equipment, safe data handling and a fair appeal process. Otherwise small compliant businesses may face disproportionate costs.
What is the federal FBR tax target for FY2026–27?
The official federal Budget in Brief provides an FBR tax-revenue budget estimate of Rs15.264 trillion for FY2026–27. This is a target set in the budget, not the amount ultimately collected. Actual fiscal reports should be checked as the year progresses.
Pakistan cannot permanently finance a modern state by repeatedly demanding more from the easiest pay packets to identify. Broadening the base must mean lawful, predictable taxation of real economic capacity, paired with stronger public accountability.
Discover more from The Economy
Subscribe to get the latest posts sent to your email.

Is the KSE-100 rally sustainable in 2026? Compare valuations, interest rates and earnings to make better investing decisions. Read the latest analysis.
Key Takeaways
- The Pakistan Stock Exchange data portal displayed the KSE-100 at 166,419.71 on 16 October 2026, below its displayed 52-week high of 191,032.73; see the exchange data.
- The State Bank had a 11.5% policy rate after its September 2026 meeting; interest rates affect both equity valuations and competing deposit returns.
- A high index level says little about value without corporate profits, dividends, debt and index concentration.
- A dividend, capital gain and inflation-adjusted return are different concepts; investors should calculate all three where applicable.
Investors love a round number on a screen. But an index nearing or exceeding a previous landmark is not automatically a bargain. The KSE-100 index 2026 stood at 166,419.71 on 16 October, according to the Pakistan Stock Exchange data portal, below a displayed 52-week high above 191,000. That is a useful reminder that even a market with strong long-term hopes can experience substantial corrections.
The question is whether company earnings and cash flows justify prices. Lower interest rates can help share valuations, while higher oil costs, energy arrears or political volatility can quickly damage them. This guide gives ordinary Pakistani investors a framework for separating a durable business improvement from an expensive narrative.
Where does the KSE-100 index 2026 stand?
The PSX data portal showed the KSE-100 closing at 166,419.71 on Friday, 16 October 2026, a modest gain on that day. It also displayed a 52-week high of 191,032.73 and a 52-week low of 144,119.44. Those are dated exchange readings, not a current live quote after the cutoff.
| Exchange measure | Value | Context |
|---|---|---|
| KSE-100 close | 166,419.71 | 16 October 2026 |
| Displayed 52-week high | 191,032.73 | PSX portal as of same date |
| Displayed 52-week low | 144,119.44 | PSX portal as of same date |
| Distance below displayed high | About 12.9% | Author calculation |
The distance from the high is an arithmetic comparison, not a prediction of the next move. Index levels are also weighted toward larger companies. A few heavily weighted banks, energy names or other blue chips can push the headline up while many smaller shares go nowhere.
Check the index construction
Read the latest PSX methodology and company disclosures before relying on a chart. Corporate actions, dividends and index revisions matter. A price-return series and total-return series can tell different stories because cash distributions can be a material part of investment results.
Why do interest rates move stock valuations?
A share price represents investors’ willingness to pay today for uncertain future profits. When government securities and deposits offer attractive yields, an investor demands stronger expected returns before taking the additional risk of equities. When interest rates fall, that comparison can become more favourable to stocks. It is a tendency, not an iron rule.
The State Bank’s September 2026 rate information showed a policy rate of 11.5%. Banks with government securities exposure may benefit or suffer from rate changes in different ways, while businesses financed through floating-rate borrowing may receive relief with a lag.
The October IMF assessment called for continued monetary discipline amid renewed energy and inflation risks. A trader betting on aggressive rate cuts should examine whether inflation makes that assumption unrealistic. A simple market narrative is often less reliable than the joint movement of policy rates, bond yields and corporate earnings.
What do company valuations tell you that an index cannot?
Start with price-to-earnings, dividend yield, debt and free cash flow. A company trading at Rs200 per share and earning Rs20 annually has an implied price-to-earnings ratio of 10, assuming the earnings figure and share count are correctly defined. That is not a buy signal by itself: earnings may be temporary or expected to collapse.
| Metric | Illustrative calculation | What to ask |
|---|---|---|
| P/E ratio | Rs200 price ÷ Rs20 EPS = 10× | Are earnings repeatable? |
| Dividend yield | Rs12 dividend ÷ Rs200 = 6% | Can cash flow support it? |
| Debt burden | Compare interest and operating cash flow | Can it refinance safely? |
| Margin trend | Net profit ÷ sales | Is pricing power improving? |
The example is fictional. Readers should use current audited or reviewed company statements for actual investments. A firm can look cheap on reported earnings while consuming cash and building debt. An exporter may report higher rupee profits partly because of currency conversion rather than higher production.
Investors also need governance checks. Examine related-party transactions, auditor qualifications, overdue receivables and dividend history. Those details often reveal more than repeated claims that Pakistan’s market is ‘under-owned’.
Which sectors are most exposed to macroeconomic shocks?
Banks, fertilisers, energy companies, cement producers and exporters react differently to inflation and interest rates. A bank can earn spreads on loans and securities but face credit risk if clients struggle. A cement producer can benefit from construction activity while being hurt by expensive fuel. Exporters receive foreign currency but may buy imported inputs.
The PBS trade statistics for September 2026 showed a cumulative $10.768 billion goods deficit in July–September, highlighting continued import sensitivity. A renewed oil-price shock could feed fuel costs and inflation, change rate expectations, and weaken consumption at home.
A sensible sector view asks which costs move immediately and which earnings respond later. For example, a company selling a regulated product may not be able to pass fuel increases to customers quickly. A debt-heavy firm with short-term loans may feel higher rates before a peer financed mostly by equity.
Broad market enthusiasm often hides these very different risk profiles. The portfolio challenge is to hold businesses whose risks are understandable rather than buy every share that recently rose.
Worked example: how can a 12% gain fail to beat inflation?
Imagine an investor buys Rs100,000 of shares and sells a year later for Rs112,000, before dealing costs, dividends or tax. Nominal capital gain is 12%. If the relevant consumer basket rises 10.3%, the exact real gain is (1.12 ÷ 1.103) − 1, or approximately 1.54%. The inflation assumption uses the PBS September 2026 year-on-year reading for illustration, not a forecast for the investor’s holding period.
Suppose commissions and taxes absorb another Rs2,000 of the proceeds. The real result is smaller. A dividend can improve the picture, but it may be subject to different taxation and does not make capital losses disappear.
This is why comparing a nominal index chart with an inflation chart is useful but not enough. The investor’s purchase date, security selection, cash flows, costs and taxes determine the realised outcome.
What would make a rally durable?
For a sustainable improvement, listed firms need growing earnings from better demand and productivity, not only lower discount rates. Government finances must remain credible enough to avoid squeezing private credit. Energy costs should not repeatedly create unplanned losses for industrial companies. And the market needs reliable disclosure so investors can price risk rationally.
The World Bank’s FY2026–35 Pakistan framework stresses productive investment and the business environment. Those reforms could create a broader base of profitable listed and unlisted firms over time. The Finance Ministry’s FY26 debt review shows why debt and interest costs remain material macro constraints.
A prudent investor avoids the idea that index records prove future returns. Build an asset allocation based on emergency savings, investment horizon, diversification and the possibility of a 20% or larger drawdown. A market that recovers sharply can still be too risky for money needed next month.
What This Means for You
First-time investor: Learn the difference between a broker account, a CDC holding and an index fund before transferring large sums. Start with money you can leave invested and do not borrow to chase a market move.
Dividend investor: Compare dividend yield with earnings quality, tax treatment and sustainability. An unusually high yield can signal a falling share price or uncertain payout.
Retiree: Match cash needs with liquid and lower-risk assets. Equity exposure should reflect the ability to tolerate loss, not a neighbour’s reported gains.
Business owner: Follow stock valuations as a window into financing conditions, but base expansion decisions on demand and project cash flow rather than index excitement.
What to Watch Next
- 26 October 2026: The State Bank monetary-policy decision and any revision to its inflation assessment; verify any schedule change with the SBP.
- Early November 2026, exact release date to be confirmed: Pakistan Bureau of Statistics October inflation and merchandise-trade releases.
- Late October–November 2026, date not yet confirmed: Any IMF Executive Board announcement on the October staff-level agreement; staff agreement is not Board approval.
- Throughout FY2026–27: Updated SBP monthly balance-of-payments and remittance statistics; compare cumulative results rather than one month alone.
Frequently Asked Questions
What was the KSE-100 index level on 16 October 2026?
The Pakistan Stock Exchange data portal displayed a KSE-100 close of 166,419.71 on 16 October 2026. The same display showed a 52-week range from 144,119.44 to 191,032.73. Prices change each trading session, so use the exchange for a later quote.
Is Pakistan’s stock market at a record high in October 2026?
Not on the 16 October data cited here. The KSE-100 was below its displayed 52-week high. Headlines about records must specify the date, index and whether the discussion refers to price, total return or a past milestone.
Is the KSE-100 a good investment in 2026?
There is no universal answer. The index offers exposure to listed Pakistani companies but also carries volatility, governance, currency and sector-concentration risk. Assess earnings, valuation, dividends and your investment horizon. Do not interpret recent index gains as a guarantee of future returns.
How do interest rates affect the Pakistan Stock Exchange?
Higher rates make deposits and bonds more competitive against shares and may raise corporate borrowing costs. Lower rates can help valuations and firms financed with debt. The actual result varies by sector and depends on inflation, credit quality and profits.
What is the difference between KSE-100 and a total-return index?
A price index mainly captures price movements under its calculation rules, whereas a total-return approach also accounts for reinvested cash distributions. Before comparing a stock portfolio with an index, check how the benchmark handles dividends and corporate actions.
The Bottom Line
The KSE-100’s level is a headline. The investment case is the price paid for repeatable profits after adjusting for risk. That distinction matters most when enthusiasm is high and markets have already shown they can fall sharply.
Discover more from The Economy
Subscribe to get the latest posts sent to your email.

The diplomatic dispute between the United States and Iran has direct consequences for energy markets, commercial shipping and household costs around the world. A proposal to reopen the Strait of Hormuz could reduce pressure if implemented, but an offer is not the same as an agreement, and an agreement is not the same as vessels returning safely to normal routes.
On October 18, Reuters reported Iran’s reiteration of a conditional proposal for reopening the waterway and continuing negotiations. The report described unresolved differences between the parties. Readers should treat the proposed timeline as a diplomatic claim contingent on acceptance and implementation, not an accomplished reopening.
Why Hormuz matters
The Strait of Hormuz links the Persian Gulf with wider maritime trade routes. Disruption can affect flows of crude oil, refined products and other cargo, while insurance and freight costs can rise even for shipments that are still moving. The economic impact depends on the duration of disruption, the ability of producers to reroute exports and the availability of substitute supplies.
One of the most common mistakes in energy reporting is to assume that every barrel of oil diverted or released immediately replaces the same amount of diesel, gasoline or jet fuel. Refining configuration, product inventories and transport capacity affect what consumers can actually buy.
Diplomatic offers contain conditions
A reopening proposal needs examination of who controls access, what sanctions might change, how hostilities would pause and what verification arrangements exist. According to Reuters, Iran’s October proposal was tied to a list of conditions and the United States had not accepted them in full. That explains why a headline about talks should not be framed as a completed peace agreement.
The nuclear issue introduces another dimension. Differences over uranium enrichment and security assurances affect trust and sequencing. Analysts should distinguish confirmed public statements from unattributed negotiating leaks and describe any remaining uncertainties.
Oil prices transmit the conflict globally
Higher oil prices alter transport costs, manufacturing costs and inflation expectations. Reuters coverage of Gulf markets illustrates how markets can react differently to the same regional tensions: some exporters may benefit from elevated prices while importers and financial markets face stronger pressures.
For airlines, higher jet fuel prices can feed into fares with a lag. For farms and supermarkets, diesel and fertilizer expenses can affect the food supply chain. For governments, imported energy may widen trade deficits and complicate efforts to reduce inflation.
Why a ceasefire would not end every economic problem
Even a verified de-escalation would leave practical questions about ship insurance, port operations, damaged infrastructure and commercial confidence. Companies may require weeks or months to restore normal schedules and rebuild inventory. Markets can anticipate a diplomatic breakthrough faster than logistics systems can deliver one.
The IMF’s October outlook identifies conflict escalation and energy effects among global downside risks. Those risks have especially uneven effects across countries.
Three scenarios to watch
In a negotiated reopening, shipping traffic and risk premiums could gradually ease, subject to verification. In a prolonged stalemate, supply chains may continue operating under elevated costs and uncertainty. In an escalation, disruptions could spread or intensify, adding inflationary pressure and financial volatility. None is guaranteed; each depends on military and diplomatic decisions that can change rapidly.
Readers should follow official government statements, shipping data and independently reported market developments. Avoid live-timing claims based on rumors and separate scheduled negotiations from signed agreements.
How to assess the actual shipping recovery
One useful sign of reopening would be sustained increases in verified commercial transits, not merely a single vessel passage. Analysts would also watch marine-insurance premiums, freight rates, tanker queues, port congestion and the ability of importers to receive cargo on time. Some vessels may need new clearances or voyage plans. Others may remain unwilling to transit despite a diplomatic announcement. Price movements can anticipate these changes, but forecasts of normal shipping should be tested against operational data. A reopening is most meaningful when it is safe, repeatable and commercially viable—not just diplomatically declared.
Frequently asked questions
Has the Strait of Hormuz fully reopened?
The cited October 18 report described a conditional proposal and unresolved negotiations, not a verified full reopening.
Why does the conflict affect food prices?
Fuel, freight and fertilizer costs move through production and distribution chains, potentially raising consumer prices later.
Can energy prices fall quickly after a deal?
Market prices may respond rapidly, but physical supply and retail prices can adjust more slowly.
Discover more from The Economy
Subscribe to get the latest posts sent to your email.

AI Investment Boom 2026–2027: Can Pakistan Capture the Upside?

Global Economy 2026–2027: What Slower Growth Means for Pakistan

Why Global Inflation Is Rising Again in 2026, and What It Means for Pakistan

Raast Pakistan 2026: Digital Payments, Fintech

Pakistan Real Estate Tax 2026: What Buyers, Sellers and Investors Must Check

SME Finance Pakistan 2026: Why Small Businesses Still Struggle for Credit

Pakistan IMF Programme 2026: Why Bailouts Keep Returning

Agri-Tech Pakistan 2026: Where Farming Innovation Could Actually Pay

Pakistan Tax Net: Why Agriculture, Retail and Property Are So Hard to Tax

KSE-100 Index 2026: Is Pakistan’s Stock-Market Recovery Sustainable?

Pakistan IT Exports 2026: What Would It Take to Reach $10 Billion?

Pakistan AI Policy 2025: Can It Raise Productivity and Create Jobs?

Pakistan Remittances 2026: How Overseas Workers Support the Economy

Can Pakistan Reach $34 Billion in Exports? The Real Barriers and Fastest Fixes

Crude Oil & Petroleum Market Analysis: OPEC+ Decisions and Price Forecasts

World’s Largest Economies: Ranking the Top Global Powers

Pakistan Economy 2026: Inside the SBP’s Balancing Act

Asian Stock Markets 2026: Japan, China, Pakistan & More

Silver Price Today: Why the Xi-Trump AI Standoff Is Fueling a Safe-Haven Rally

SpaceX IPO 2026: History’s Biggest Stock Debut?

Algorithmic Dogfights: Why the U.S. and China Must Establish Rules of Engagement for Autonomous Air Power

Oil Prices 2026: Inside the Hormuz Crisis That Won’t End

Top US Convenience Store Chains: Store Counts, EV Charging, and Sales Trends

Who Is Shivon Zilis? The Neuralink Executive at the Center of the Musk–OpenAI Trial

Business Insurance: What Coverage You Actually Need and What It Costs in 2026

Global Economic Outlook 2026: 7 Forces Reshaping Markets, Trade and Business

Corporate America Faces a New Debt Test as US Borrowing Costs Surge

Is AI a Stock Bubble in 2026? What the Data Shows
-

 Markets & Finance10 months ago
Top 15 Stocks for Investment in 2026 in PSX: Your Complete Guide to Pakistan’s Best Investment Opportunities
-

 Analysis8 months ago
Johor’s Investment Boom: The Hidden Costs Behind Malaysia’s Most Ambitious Economic Surge
-

 Analysis8 months ago
Top 10 Stocks for Investment in PSX for Quick Returns in 2026
-

 Banks9 months ago
Best Investments in Pakistan 2026: Top 10 Low-Price Shares and Long-Term Picks for the PSX
-

 Analysis9 months ago
Brazil’s Rare Earth Race: US, EU, and China Compete for Critical Minerals as Tensions Rise
-

 Investment9 months ago
Top 10 Mutual Fund Managers in Pakistan for Investment in 2026: A Comprehensive Guide for Optimal Returns
-

 Global Economy10 months ago
15 Most Lucrative Sectors for Investment in Pakistan: A 2025 Data-Driven Analysis
-

 Global Economy10 months ago
Pakistan’s Export Goldmine: 10 Game-Changing Markets Where Pakistani Businesses Are Winning Big in 2025