
Business
US Jobs Report July 2026: Why Weak Payrolls Sent the Dow to a Record High
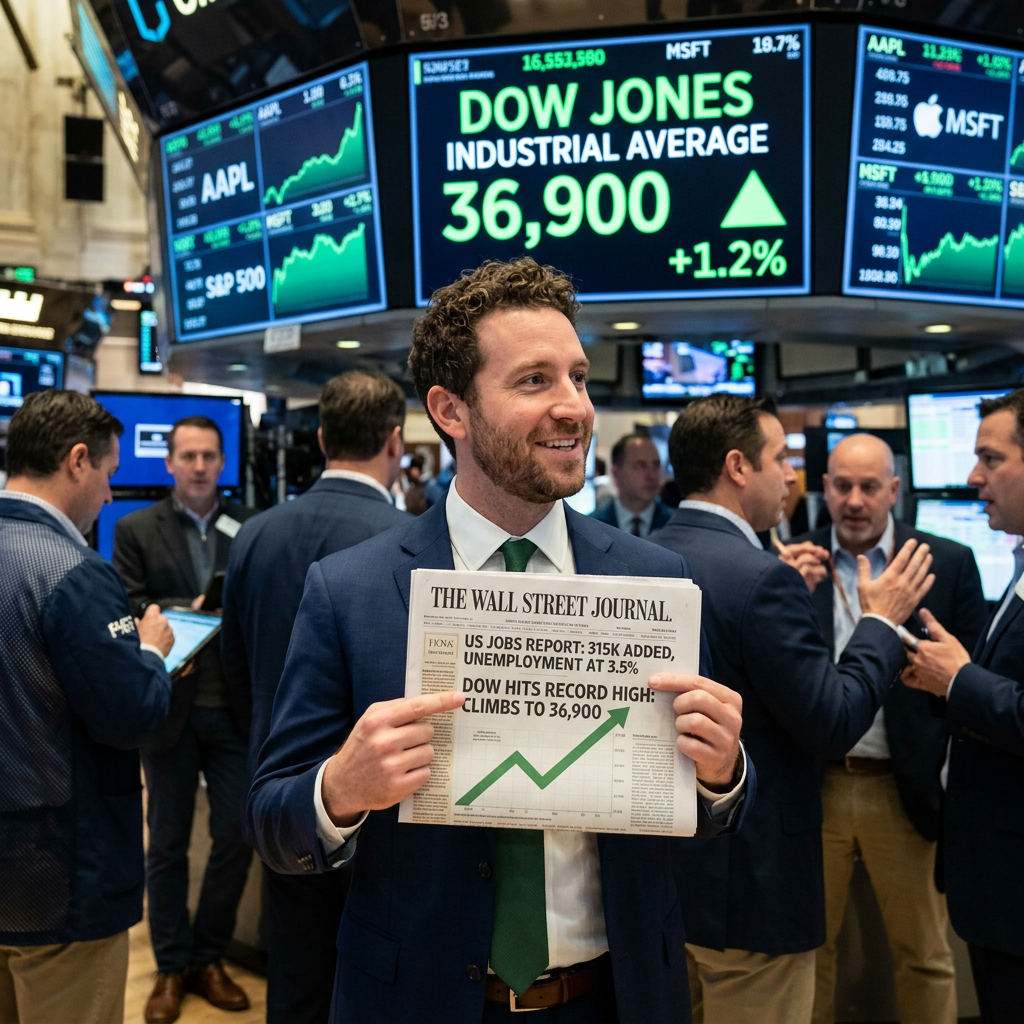
The US economy added just 57,000 jobs in June, roughly half the number economists had forecast, and Wall Street’s reaction was almost perfectly inverted from what the headline number would suggest. The Dow Jones Industrial Average surged nearly 600 points to a record close of 52,900.07, even as the weak print signaled a cooling labor market, because investors read it as evidence the Federal Reserve has less reason to keep policy tight, according to Google Finance’s market wrap.
A Fed Chair Asking Markets to Watch the Data, Not Him
The rally happened against a specific backdrop: Federal Reserve Chairman Kevin Warsh has been urging Wall Street to look to incoming economic data to map the path for interest rates rather than to the central bank for forward guidance, a shift in communication style noted by Yahoo Finance. That framing matters because it puts the weak jobs report, rather than any Fed statement, in the driver’s seat for rate expectations heading into the July 30 policy decision.
Warsh had separately told the market that inflation risks have come down substantially, comments that had already lifted sentiment earlier in the week, per Bloomberg’s coverage of the prior session. The combination of easing inflation rhetoric and a soft jobs number gives the Fed cover to hold rates steady, or even consider cuts, without appearing to react to political pressure or market demands.
A Market Split Down the Middle
The reaction split sharply by sector. The S&P 500 was essentially flat, while the tech-heavy Nasdaq Composite fell 0.8%, dragged down by a second consecutive day of semiconductor selling that saw the VanEck Semiconductor ETF drop 4.5%, according to CNBC’s live markets desk. Tesla shares sank as much as 7.3% despite reporting second-quarter delivery and production levels that beat Wall Street expectations, a reminder that in the current environment, even strong operating results are being overshadowed by broader positioning shifts out of AI-adjacent names.
Meanwhile, defensive and rate-sensitive sectors caught a bid. The Communication Services Select Sector SPDR gained 2.4% and the Financials Select Sector SPDR added 2.2%, according to Zacks’ daily market summary, a rotation pattern consistent with investors repositioning toward sectors that benefit from lower borrowing costs and away from the crowded AI trade that has dominated 2026 returns so far.
Oil, Gold, and the Lingering Iran War Effect
The jobs report landed alongside an easing of a separate inflation risk. WTI crude futures fell nearly 2% to just above $68 a barrel, down almost 20% over the prior two weeks, as markets priced in signs that indirect talks between the US and Iran were progressing positively, according to Schwab’s market open report. That decline matters directly for the Fed’s calculus: falling energy prices reduce one of the clearest channels through which the Iran conflict has been pushing inflation higher across the global economy since the Strait of Hormuz disruption began in late February.
At the same time, gold rose after the cooler-than-expected jobs data, and Bitcoin climbed more than 2% to surpass $61,000, buoyed by renewed accumulation from long-term holders and institutional buyers, Google Finance’s market summary noted. The simultaneous rally in equities, gold, and crypto is an unusual combination that reflects a market betting on looser monetary policy across every asset class at once, even as the underlying economic signal, a half-strength jobs report, is not obviously bullish news.
What the July 30 Decision Now Hinges On
Markets enter the July 30 Federal Open Market Committee meeting with a genuinely two-sided setup. On one hand, a labor market adding jobs at half the expected pace historically justifies rate cuts. On the other, the Iran-driven energy shock has already pushed inflation forecasts higher across nearly every advanced economy this year, and Warsh’s own commentary suggests the Fed wants to avoid being seen as reactive to a single data point. The Federal Open Market Committee minutes due July 8 will offer the clearest signal yet of how divided the committee is on this question, with markets closed Friday, July 3, for the Independence Day holiday, resuming trading Monday.
For now, the record Dow close alongside a weak jobs report captures a market more focused on the Fed’s next move than on the underlying health of hiring. That combination, cooling employment growth paired with equity records, is precisely the kind of divergence that tends to persist until a policy decision forces a reconciliation between the two signals.
Discover more from The Economy
Subscribe to get the latest posts sent to your email.


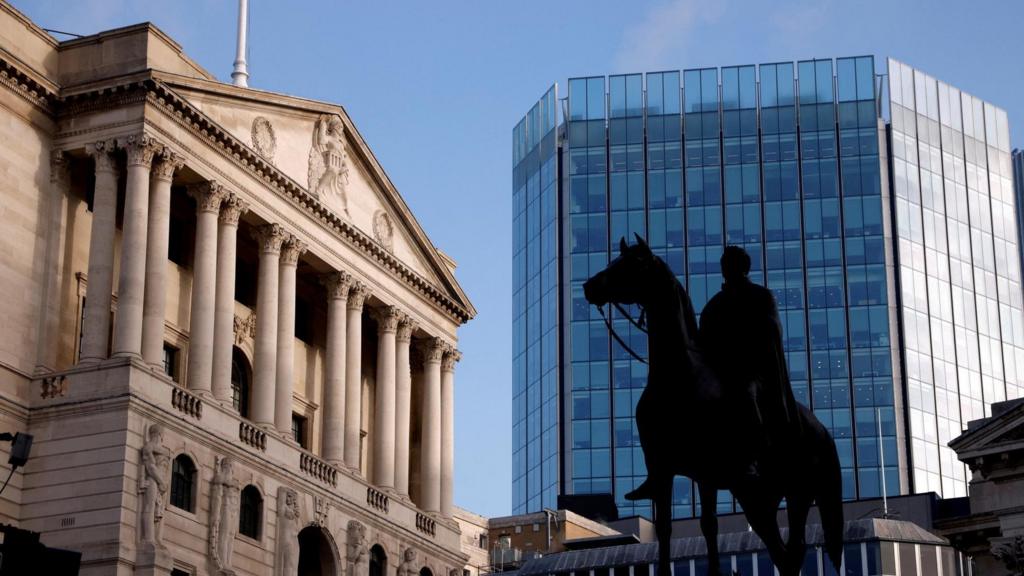
The United Kingdom is heading into a second consecutive year of what economists at RSM UK are calling “stagflation-lite,” a combination of sluggish growth and rising inflation driven by an energy shock that traces directly back to the closure of the Strait of Hormuz. Bank of England Governor Andrew Bailey has said market pricing for two rate cuts this year looked reasonable before the Iran war lifted inflation risks, a shift in tone that now has traders debating whether the next move is a cut, a hold, or an outright hike, according to the Credit Protection Association’s business briefing.
Growth That Keeps Disappointing
The headline numbers tell a story of an economy losing momentum even before the latest shock fully lands. UK GDP grew just 0.1% at the end of 2025, revised down from an initial 0.2% estimate, and while first-quarter 2026 growth came in stronger at 0.6%, GDP then fell 0.1% in April, according to the Office for National Statistics data cited by CPA. Real household disposable income fell 0.8% in the first quarter as rising prices and higher taxes squeezed consumers, and business confidence data from the Institute of Directors showed its sentiment index falling to minus 61 in June from minus 53 in May, the lowest revenue expectations reading of the year.
RSM UK’s economic outlook frames the underlying trajectory starkly: GDP growth of just 1.0% this year, down from 1.4% in 2025, with inflation trending back toward 4%, “another dose of ‘stagflation-lite,'” the firm wrote in its assessment, per RSM UK. The firm’s base case sees inflation averaging 3.1% in 2026 and peaking around 3.5%, though it warns the risks are larger than usual given how heavily the outlook depends on developments in the Middle East.
The Energy Shock’s Direct Line to Household Bills
The mechanics of the inflation threat are unusually direct this time. A 13% rise in the energy price cap in July, combined with higher motor fuel costs and pass-through effects into food and supply chains, is expected to push inflation back toward 3.5% by year end, RSM UK’s analysis found. Oil prices, which had briefly dipped, rose to an average of over $100 a barrel within 30 days of the Iran conflict’s outbreak, though RSM UK notes the closure of the Strait of Hormuz represents the largest oil supply shock in history, and energy markets have so far reacted with relative calm, with oil now around $79 a barrel, well below the post-Ukraine invasion peaks.
That calm may not last. High global oil stocks have provided a buffer, but these are being run down at a record rate and could reach critical levels by September if the June peace deal between the US and Iran proves fragile, according to RSM UK’s forecast. KPMG UK’s separate economic outlook adds that the disruption to oil and gas supplies has already put upward pressure on energy prices, with headline inflation expected to rise from the third quarter onward as the spike gradually feeds through, per KPMG UK.
A Central Bank Caught Between Two Mandates
The Bank of England’s Monetary Policy Committee held its base rate at 3.75% through the first half of 2026, pausing a cutting cycle that had brought borrowing costs down from a 16-year high, according to NewsNow’s aggregated coverage of the situation. The next MPC decision falls on July 30, and while a base rate rise isn’t off the table, most analysts expect the committee to use the meeting to assess how durable the US-Iran peace deal proves before committing to any directional shift, according to mortgage-market analysis from Tembo Money.
The labor market complicates the calculus further. Unemployment has risen to around 5.1% to 5.2% as slower growth and higher employer National Insurance contributions weigh on hiring, even as pay growth cools from recent highs, easing the case for further rate cuts while simultaneously pressuring real household incomes, per NewsNow’s summary. KPMG UK’s modeling suggests that if the Middle East disruption proves short-lived and both oil and gas prices decline before summer’s end, inflation could still fall from a September peak toward the Bank’s 2% target by the second quarter of 2027, but that scenario now looks less certain than it did in the spring.
Politics Compounds the Uncertainty
Economic uncertainty is being amplified by domestic political developments. RSM UK’s outlook specifically flags the prospect of a change in Prime Minister as adding headwinds through higher borrowing costs and gilt yield pressure, noting that gilt yields are likely to remain elevated regardless of what the Bank of England does with the policy rate, given the UK’s particular sensitivity to inflation surprises and its unresolved political landscape. Hospitality businesses have separately renewed calls for a VAT cut, with almost a quarter of venues reportedly operating at a loss even before the latest energy price increases take effect, according to CPA’s reporting.
RSM UK’s own assessment of the year ahead captures the mood succinctly: the economy has grown at an average of just 1.2% through two turbulent years, and while early signs suggest that resilience will hold, the firm’s base case remains slower growth paired with rising inflation, not recession, but with a bigger-than-usual health warning attached to that call.
Discover more from The Economy
Subscribe to get the latest posts sent to your email.
The global billionaire population grew by 13.1% over the past year to reach 3,302 individuals, with their collective wealth climbing 25% — nearly two and a half times faster than the 10.8% growth in average personal wealth recorded across the broader global population, according to the UBS Global Wealth Report 2026. The gap between those two figures, both drawn from the same 56-market dataset, has become the report’s most closely scrutinized finding, offering the clearest documented evidence yet that the artificial intelligence boom is concentrating wealth gains at a scale and speed rarely seen outside wartime economies.
The report’s seventeenth edition draws on data covering markets that together account for more than 92% of global wealth, according to UBS’s own report summary, giving it a scope few private-sector wealth surveys can match. What it found beneath the aggregate numbers is a story of two very different economies moving in opposite directions simultaneously.
The AI Wealth Machine, By the Numbers
The United States remains home to more than 1,000 billionaires — nearly double China‘s count of 562 — while India holds third place globally with 211 billionaires among a population exceeding 1.4 billion, according to reporting from Spear’s. But the most striking single data point in the report may be South Korea‘s trajectory: the country’s billionaire count nearly doubled, rising from 31 in 2025 to 52 in 2026, driven in large part by the country’s booming semiconductor and AI microchip industries. South Korea’s overall billionaire net worth doubled across the same period — evidence that existing fortunes, not just newly minted ones, expanded sharply on AI-linked equity gains.
Paul Donovan, chief economist at UBS Global Wealth Management, noted that while AI has been one factor behind rising ultra-high-net-worth fortunes, wealth creation reflects a mix of productivity, investment risk-taking, and — at moments of structural upheaval — simple positioning advantage. That framing implicitly acknowledges what critics of the AI wealth boom have argued more bluntly: that early ownership of AI-exposed equities, rather than broad-based productivity gains, explains much of the divergence documented in this year’s report.
Median Wealth Tells a Starkly Different Story
The headline growth figures obscure a more troubling pattern once the data is disaggregated by measure. UBS reported that median wealth — a statistic that better reflects the experience of a typical household than mean averages skewed by billionaire fortunes — actually declined across the majority of countries tracked in the survey, even as average wealth climbed, according to Quartz’s analysis of the report. UBS described the divergence as clear evidence of widening global wealth inequality.
The report’s wealth pyramid data reinforces this picture. The share of adults globally holding less than $10,000 in net assets has continued to shrink, now standing at just over 41% — technically progress, but one driven substantially by asset price inflation among those already holding some wealth, rather than genuine income growth among the poorest segment of the population. Meanwhile, roughly 1.5% of adults in the UBS sample now hold more than $1 million in net assets, with nearly one million new dollar-millionaires added globally over the course of 2025, at a pace of roughly 2,680 people per day.
The United States accounted for close to half of that increase on its own, adding more than 440,000 new millionaires — a rate exceeding 1,200 per day. The United Kingdom added more than 43,000, while France, Spain, Japan, and India each added more than 30,000 new millionaires over the same period.
Where the New Fortunes Are Concentrated
The sectoral breakdown of billionaire wealth growth clarifies exactly how directly the AI boom is driving these gains. Billionaires invested in technology saw their wealth increase by 23.8% in the preceding period covered by UBS’s related Billionaire Ambitions data, while consumer and retail sector wealth growth slowed to just 5.3% as European luxury brands lost ground to Chinese competitors. Industrial wealth, boosted substantially by AI-adjacent infrastructure investment, posted the fastest growth of any sector at 27.1%, reaching $1.7 trillion in aggregate value, with more than a quarter of that growth attributable to newly minted billionaires rather than appreciation of existing fortunes.
Six US technology billionaires alone saw their combined wealth grow by $171 billion, tied directly to AI-driven growth at their respective companies, according to prior UBS reporting reviewed alongside this year’s data. In China, tech billionaires connected to the country’s AI industry likewise saw outsized wealth surges even as the broader Chinese economy continued grappling with a property-sector slowdown and softer consumer spending — illustrating how narrowly concentrated AI-linked wealth creation has become, even within individual national economies.
The Generational Wealth Transfer Compounds the Divide
UBS’s data also captures an accelerating intergenerational wealth transfer that is reinforcing, rather than offsetting, the inequality trend. As the Baby Boomer generation passes on accumulated fortunes, estimates cited alongside the report suggest roughly $90 trillion will change hands globally over the next two decades. Within the current billionaire cohort specifically, newly counted heirs inherited a combined $150.8 billion in the latest reporting period — for the first time exceeding the $140.7 billion in combined fortunes created by self-made new billionaires over the same window, according to data compiled in UBS’s related Billionaire Ambitions research.
That inversion — inherited wealth outpacing newly created wealth among incoming billionaires — marks a meaningful shift in how global fortunes are being replenished, suggesting that even as AI creates genuinely new pools of capital at the top of the distribution, the mechanism reinforcing overall wealth concentration is increasingly inheritance rather than entrepreneurship.
What the Divergence Means Going Forward
The UBS findings arrive at a moment when policymakers across major economies are already grappling with how to tax, regulate, or otherwise respond to AI-driven wealth concentration without stifling the investment that is genuinely driving productivity gains in select sectors. The report does not offer policy prescriptions, but the data itself — 25% billionaire wealth growth against declining median wealth in most tracked countries — provides the clearest empirical anchor yet for a debate that has, until now, relied heavily on anecdote and individual company valuations rather than systematic, cross-country measurement.
For markets and policymakers alike, the report’s central finding functions as a warning that the AI boom’s benefits, however transformative for productivity in aggregate, are not yet reaching the median household in most of the world’s major economies — a gap that is likely to shape political and regulatory responses to artificial intelligence for years beyond the current market cycle.
Discover more from The Economy
Subscribe to get the latest posts sent to your email.

The Bank of England has, for the first time, publicly questioned whether its existing rulebook can contain the risks posed by autonomous artificial intelligence agents operating inside financial markets — a question that Singapore‘s Monetary Authority of Singapore (MAS) effectively answered months earlier with a formal agentic-AI risk toolkit built alongside two dozen banks and insurers. The contrast between a major Western regulator now sketching hypothetical “kill switches” and an Asian regulator already operationalizing agentic-AI governance illustrates how unevenly the world’s financial supervisors are adapting to the same technological shift.
Sarah Breeden, the Bank of England’s deputy governor for financial stability, told the European Central Bank’s Sintra forum that the financial system is evolving toward one that “operates more autonomously, at scale and speed,” and that relying on a human in the loop for every AI agent action is no longer realistic, according to the Bank of England’s published speech text. Her remarks mark a departure from the Bank’s long-standing position that existing, technology-agnostic frameworks were sufficient to supervise AI-driven finance.
What the Bank of England Is Actually Proposing
Breeden’s speech outlined a set of “mitigants” under active study rather than confirmed policy: market-wide circuit breakers or kill switches capable of halting trading if faulty AI models trigger a correlated meltdown, and “enhanced recovery” arrangements that would allow one bank to take over another’s core functions during a crisis. The Bank, working alongside Germany’s Bundesbank and the Bank for International Settlements, is running simulations of scenarios in which AI trading agents — trained on similar data and reacting to identical market signals — execute the same trades simultaneously, amplifying volatility precisely when markets are least able to absorb it.
The scale of the exposure is not hypothetical. A Cambridge Centre for Alternative Finance survey cited by Breeden found that 52% of finance firms are already deploying agentic AI in some capacity, according to coverage from Banking Exchange. Breeden also noted that AI capability, which doubled roughly every seven months in 2019, is now doubling closer to every four months — an acceleration she described as already exceeding policymakers’ expectations.
Unlike generative tools that respond to individual prompts, agentic AI is designed to complete multi-step tasks with limited human intervention — executing trades, initiating payments, and interacting with counterparty systems without requiring approval at each step. That autonomy is precisely what concerns the Bank: existing frameworks were built around human decision points that agentic systems are designed to bypass.
Singapore’s Head Start: Project MindForge
While London debates hypothetical guardrails, Singapore‘s MAS has already moved from consultation to implementation. In March 2026, MAS announced the conclusion of phase two of Project MindForge, publishing an AI Risk Management Toolkit developed in collaboration with a consortium of 24 banks, insurers, and capital markets firms, according to MAS’s official release. The toolkit’s centerpiece is an AI Risk Management Operationalisation Handbook that gives financial institutions practical guidance for managing risk across traditional AI, generative AI, and emerging agentic AI systems.
Notably, Singapore’s underlying supervisory guidelines — first proposed in a November 2025 consultation — explicitly instruct financial institutions to build human override and kill-switch capability directly into agentic systems from the outset, rather than retrofitting them after a crisis has demonstrated the need. Kenneth Gay, MAS’s Chief FinTech Officer, framed the toolkit’s release as a step toward ensuring the responsible adoption of AI across the industry, according to MAS’s release.
This is a materially different regulatory posture than the one described by Breeden. Where the Bank of England is still exploring whether guardrails are needed, MAS has already codified expectations around AI inventories, materiality-based risk assessments, board-level accountability, and lifecycle controls covering autonomous decision loops. The consultation period for MAS’s underlying guidelines closed on January 31, 2026, with institutions expected to comply within a 12-month transition window — placing full enforcement around early 2027, well ahead of any comparable UK framework currently under discussion.
Why the Divergence Matters for Global Capital Flows
The regulatory gap between Singapore and the UK is not merely academic. As global banks and asset managers build cross-border agentic AI systems — trading desks that operate across London, Singapore, and New York simultaneously — inconsistent supervisory expectations create genuine compliance friction. A trading agent built to Singapore’s MindForge standard, with embedded override capability and documented lifecycle controls, may already satisfy requirements that the Bank of England has not yet finalized, giving institutions with Singapore operations a practical head start in demonstrating AI governance maturity to global regulators.
This dynamic reinforces Singapore’s broader ambition to position itself as Asia’s trusted node for AI-era financial infrastructure. MAS has pursued a parallel, integration-led approach to tokenized finance through initiatives such as Project Guardian and the Global Layer One framework, a public-private collaboration involving the Bank of England, the Banque de France, and major global commercial banks. The convergence of these initiatives — agentic AI governance on one track, tokenized settlement infrastructure on another — suggests Singapore is deliberately building the regulatory scaffolding for a financial system in which autonomous agents and digital money coexist as standard infrastructure rather than experimental technology.
The Stakes for Financial Stability
Breeden’s own framing of the risk is instructive: the goal, she said, is ensuring that the next “technology surprise” does not become a test of financial stability. The Bank’s Financial Policy Committee is due to publish an updated assessment of AI-related financial stability risk on July 7, with Breeden noting that AI infrastructure investment, historically funded through large technology companies’ cash flows and equity, is increasingly reliant on debt financing in newer and more complex structures — a shift the Bank has already flagged as increasing the potential financial stability consequences of any sharp correction in AI-related asset prices.
For regulators everywhere, the practical question is no longer whether agentic AI will operate inside core financial infrastructure — the Cambridge survey data suggests that threshold has already been crossed — but whether supervisory frameworks, kill switches, and recovery protocols can be built and tested before the next AI-driven market stress event arrives rather than after it.
Discover more from The Economy
Subscribe to get the latest posts sent to your email.

Russia Raised VAT to 22% to Pay for the War. It Still Isn’t Enough

Six Straight Quarters of Falling Prices: Inside China’s Deflation Trap

Canada Missed Its CUSMA Deadline. Now Its Economy Is “On Pause”

UK Stagflation 2026: Why the Bank of England May Hike Rates, Not Cut Them

Chipmakers Just Lost 6.7% in Two Days: Inside the Great AI Trade Rotation

AI Bubble Risk 2026: BIS Warns Private Credit Could Trigger Financial Crisis

US Jobs Report July 2026: Why Weak Payrolls Sent the Dow to a Record High

The Top 10 Economic Research Institutes in the World

Singapore GDP Grew 6% in Q1 2026 — Why Forecasts Stay Cautious

IMF Cuts Pakistan Growth Forecast, Raises Inflation to 8.4%

Malaysia GDP Growth Slows as Strait of Hormuz Crisis Drags On

Indonesia’s 150-Million-Barrel Russian Oil Deal Explained

Russia’s Sanctioned Oil Giants Regain 57% Export Share via Shadow Fleet

UBS Report: Billionaire Wealth Up 25% on AI Boom as Median Wealth Falls

PwC China Partner Payouts Cut Amid Evergrande Audit Fraud

Investors Pile Into Bullish Dollar Bets as ‘US Exceptionalism’ Trade Returns

Broadcom Market Value Loss: Revenue Forecast Disappoints

Nasdaq Tumbles 4% as Chip and Memory Stocks Sink: A $1.2 Trillion Wipeout

How to Fix Pakistan’s Debt Economy: A Structural Blueprint

Japan’s Nikkei Scales Record Peak as AI Shares Track US Chip Rally

Grinding the Already Ground: Pakistan’s Inflation Crisis

JPMorgan Cuts Anthropic AI Access in Hong Kong

Democrats Draw a Red Line Around Military AI — And the Pentagon Is Already Pushing Back

Smash Capital Leads $200M Funding for Allen Control Systems

New Investment Super-Cycle: AI, Green Energy & Re-Shoring

Middle East Conflict Oil Prices: The $4 Surge Explained

Xponential Fitness Franchise Lawsuit: The $3.97M Judgment

The End of the Chatbot: Why OpenAI is Tearing Up Its Most Successful Product
-

 Markets & Finance6 months ago
Top 15 Stocks for Investment in 2026 in PSX: Your Complete Guide to Pakistan’s Best Investment Opportunities
-

 Analysis4 months ago
Top 10 Stocks for Investment in PSX for Quick Returns in 2026
-

 Analysis5 months ago
Brazil’s Rare Earth Race: US, EU, and China Compete for Critical Minerals as Tensions Rise
-

 Analysis4 months ago
Johor’s Investment Boom: The Hidden Costs Behind Malaysia’s Most Ambitious Economic Surge
-

 Banks6 months ago
Best Investments in Pakistan 2026: Top 10 Low-Price Shares and Long-Term Picks for the PSX
-

 Investment6 months ago
Top 10 Mutual Fund Managers in Pakistan for Investment in 2026: A Comprehensive Guide for Optimal Returns
-

 Global Economy6 months ago
15 Most Lucrative Sectors for Investment in Pakistan: A 2025 Data-Driven Analysis
-

 Global Economy6 months ago
Pakistan’s Export Goldmine: 10 Game-Changing Markets Where Pakistani Businesses Are Winning Big in 2025