
Oil Markets
Russia’s Sanctioned Oil Giants Regain 57% Export Share via Shadow Fleet

Russia‘s two largest, US-sanctioned oil producers have clawed back control of the majority of the country’s crude export trade, restoring their combined share to 57% in the first half of May 2026 after a sharp decline earlier in the year — a recovery that underscores the limits of Western sanctions enforcement even as the Middle East conflict reshapes global energy flows in Moscow’s favor.
According to the Kyiv School of Economics Institute‘s Russian Oil Tracker, sanctioned producers Rosneft, Lukoil, Gazpromneft, and Surgutneftegaz had seen their combined export share collapse to just 4-8% in the January-to-March period, only to rebound sharply as sanctioned “shadow fleet” tankers and previously idle vessels returned to commercial service, according to KSE Institute’s May 2026 tracker. The reversal illustrates a pattern that has recurred throughout the sanctions era: enforcement gaps open, capital and logistics networks adapt, and market share flows back toward sanctioned entities within a matter of months.
The Shadow Fleet’s Growing Dominance
The scale of Russia’s reliance on unconventional shipping infrastructure has reached a new high. KSE Institute estimates that 192 shadow fleet tankers carrying crude and refined products left Russian ports or engaged in ship-to-ship transfers in April 2026 alone, with 92% of those vessels older than 15 years — aging tonnage increasingly steered toward sanctions-evasion routes as newer, compliant vessels avoid the reputational and insurance risk of handling Russian crude.
The share of Russian seaborne oil transported by explicitly sanctioned tankers rose from 15% in July 2025 to 31% by April 2026, according to KSE data, while the corresponding share carried specifically by US-designated vessels reached 26% over the same window — driven, according to the tracker, by previously idle tankers returning to active commercial rotation. As of May 21, six major sanctioning jurisdictions — the US, UK, EU, Australia, Canada, and New Zealand — had jointly designated 651 unique oil tankers, yet the fleet supporting Russian exports has continued to expand around those designations rather than shrink beneath them.
Separately, monthly analysis from the Centre for Research on Energy and Clean Air (CREA) found that in April 2026, over half — 54% — of Russia’s seaborne oil moved via sanctioned shadow tankers, up sharply from 48% in March, with sanctioned vessels responsible for the highest share of Russian fossil fuel exports on record, according to CREA’s April 2026 monthly tracker.
Revenue Keeps Climbing Despite the Sanctions Architecture
The financial consequence of this logistics resilience is a fossil fuel export revenue stream that has continued growing even as enforcement pressure has, on paper, intensified. Russia’s fossil fuel export revenues rose 2% month-on-month to €726 million per day in May 2026, according to CREA’s most recent analysis, despite export volumes remaining broadly flat. Crude oil export revenues specifically grew 1% to €362 million per day, with volumes up 8% — evidence that Russia is finding new efficiencies in its export logistics even as the headline sanctions regime tightens.
KSE Institute’s revenue modeling, updated in light of the Middle East conflict, now projects that Russia’s total oil revenue could climb from $158 billion in 2025 to $208 billion in 2026 under a base-case scenario assuming current price caps and a conflict lasting up to three months. Under an adverse scenario involving weak sanctions enforcement, that figure could reach $214 billion — meaning even the coalition’s most pessimistic enforcement scenario still implies rising, not falling, Russian oil revenue for the year.
Pricing dynamics tell a related story. Russia’s benchmark Urals crude rose 19% month-on-month in April 2026 to $112.30 per barrel — more than double the $44.10 EU and UK price cap that took effect on February 1, 2026 — before easing 12% in May to $82.02 per barrel, still nearly double the cap, according to CREA’s tracking data. The price cap, designed explicitly to constrain Russian per-barrel revenue while keeping global oil supply flowing, has functioned as a floor for insurance and freight compliance rather than an effective revenue ceiling during periods of tight global supply.
Third-Country Refineries Remain a Persistent Loophole
Refineries in India, Türkiye, Brunei, and Georgia running on Russian crude exported €641 million worth of oil products to sanctioning countries in May 2026 alone, according to CREA, including shipments to the EU, Australia, the US, and New Zealand — jurisdictions that have formally banned direct imports of Russian crude but continue receiving refined products derived from that same crude once it has passed through a third-country refinery. Georgia’s Kulevi refinery has run entirely on Russian crude for months without receiving a single shipment of non-Russian oil, despite its operating company publicly stating an intent to diversify — and despite narrowly avoiding inclusion on the EU’s sanctions list in March.
The EU closed one version of this loophole through its 18th sanctions package in January 2026, banning oil products refined from Russian crude in third countries from entering the bloc, according to analysis from the Center for European Policy Analysis (CEPA). Yet the persistence of flows through Kulevi and similar facilities illustrates how quickly new evasion routes emerge once established ones are formally closed — a pattern sanctions researchers describe as a continuous cat-and-mouse dynamic rather than a one-time enforcement fix.
What the Data Means for the Broader Sanctions Debate
Since Russia’s full-scale invasion of Ukraine, sanctions imposed by the UK, US, and EU are estimated to have denied Russia access to more than $450 billion, according to CEPA’s analysis — a substantial figure that nonetheless coexists with the reality that Russia’s oil exports since February 2022 have generated more than $800 billion in revenue through April 2026, according to CREA data cited in the same CEPA report. Those two figures, both accurate, capture the fundamental tension at the heart of Western sanctions policy: meaningful financial damage has been inflicted, but Russia’s core oil revenue engine has continued operating at a scale sufficient to sustain its war economy.
For markets and policymakers tracking global oil supply through the remainder of 2026, the practical implication is that Russian barrels — whether transported via shadow fleet, laundered through third-country refineries, or shipped directly by re-empowered sanctioned majors — remain a structurally embedded part of global crude supply, with enforcement gaps proving durable enough that even renewed sanctions packages have thus far failed to meaningfully compress Russia’s oil-derived war financing.
Discover more from The Economy
Subscribe to get the latest posts sent to your email.


Brent crude oil futures surged past $95 a barrel in late June 2026, touching $97.40 intraday, after OPEC+ announced a surprise extension of its production curbs through the end of September. The alliance, led by Saudi Arabia and Russia, had been expected to begin a gradual unwinding of the additional 800,000 barrels per day (bpd) of “voluntary adjustments” from July. Instead, it doubled down, citing “fragile demand sentiment, monetary uncertainty, and the need to ensure a stable and predictable supply environment” (OPEC Press Release, 26 June 2026). The decision has reignited the crude oil price rally June 2026, propelling the market toward the psychologically critical $100 threshold and reviving fears of energy‑driven inflation.
OPEC+ Quota Extension: The Mechanics
The current production restraint is layered. The baseline production targets, agreed in November 2024, collectively curb output by 2 million bpd relative to October 2022 baselines. On top of this, the “voluntary adjustments” of 1.6 million bpd, announced by Saudi Arabia, Russia, Iraq, UAE, Kuwait, Kazakhstan, Algeria, and Oman, were extended multiple times and were scheduled to taper starting July 2026. The June decision defers that taper to October, with a caveat that the unwinding will be gradual and “data dependent.” In practice, the group is keeping 3.6 million bpd—roughly 3.5% of global supply—off the market.
Saudi Arabia’s energy minister, Prince Abdulaziz bin Salman, framed the move as preemptive. “We see demand growth projections that are solid, but we also see inventory builds in some products. We do not want to risk a repeat of the 2025 mini‑glut that punished prices. Discipline is the watchword,” he said at the press conference (Saudi Press Agency, June 2026). Behind the scenes, Riyadh needs an average oil price above $85 to fund its Vision 2030 megaprojects, and Moscow requires revenue to sustain its military operations. Both have a clear incentive to err on the side of tightness.
Global Demand: Jet Fuel and Petrochemicals Drive Growth
The International Energy Agency’s June Oil Market Report projects global oil demand will rise by 1.8 million bpd in 2026 to a record 105.2 million bpd (IEA OMR, June 2026). The main engines are jet fuel and petrochemicals. Air travel has now fully recovered to above 2019 levels, with Asia‑Pacific passenger numbers 12% higher. The summer travel season in the Northern Hemisphere is proving exceptionally strong, with US airlines reporting record bookings and European airports setting new daily traffic records. Petrochemical demand, driven by new crackers in China and India, is absorbing more naphtha and LPG.
On the supply side, non‑OPEC+ growth is led by the United States, Brazil, Guyana, and Canada, adding a combined 1.4 million bpd. US production reached a new high of 14.2 million bpd in May, but the growth rate has halved from 2024’s blistering pace as the most productive Permian Basin acreage matures and consolidation reduces the number of active rigs (EIA Short‑Term Energy Outlook, June 2026). Brazil’s pre‑salt fields and Guyana’s Stabroek block continue to ramp up, but they cannot fully offset the OPEC+ cuts. The net global supply‑demand balance is in a deficit of approximately 500,000 bpd in Q3, drawing down global inventories.
The Energy Inflation Outlook
The oil price rally is already feeding into consumer prices. US regular gasoline has averaged $3.92 per gallon in June, up 15% from a year ago, and is on track to breach the politically sensitive $4 mark before the July 4th holiday. The euro area harmonized index of consumer prices for energy rose 4.1% year‑on‑year in May, erasing some of the disinflation progress of 2025. Central banks, which had been hoping for a benign energy backdrop to allow rate cuts, now face a renewed headache. The Fed’s June Summary of Economic Projections showed that several participants revised their inflation forecasts up by 0.2 percentage points, explicitly citing “higher‑than‑assumed energy prices” (Federal Reserve, June 2026 SEP).
For businesses, transportation and raw‑material costs are rising again. Airlines, which hedged fuel heavily when prices were lower in early 2025, are seeing those hedges roll off, exposing them to spot prices. Shipping companies are imposing emergency fuel surcharges, adding to the cost of goods in transit. The FAO food price index (see Article 17) is also elevated, creating a compound inflation shock that hits low‑ and middle‑income consumers hardest.
Geopolitical Dimensions and SPR Depletion
The Biden administration, facing mid‑term elections in November 2026, has limited options. The Strategic Petroleum Reserve, drained by a record 180 million‑barrel release in 2022 and subsequent smaller releases, now holds just 340 million barrels, near a 40‑year low. Refilling it has been slow due to price‑sensitivity triggers and Congressional appropriations. White House Press Secretary Karine Jean‑Pierre reiterated that “all options are on the table,” but another massive SPR release would deplete it to levels that compromise emergency readiness. Diplomatically, the US has urged OPEC+ to increase supply, but the administration’s strained relationship with Saudi Arabia, particularly after the EV tariff dispute and the Kingdom’s BRICS engagement, has blunted US leverage (Reuters, June 2026).
Investment Implications
The energy sector is the standout trade of 2026. The S&P 500 Energy Index has returned 28% year‑to‑date, outperforming tech. Upstream companies with low decline rates and strong shareholder‑return programs—ExxonMobil, Chevron, ConocoPhillips, and EOG Resources—are attracting value and momentum flows. Oilfield services firms are also benefitting from a belated increase in global upstream capital expenditure, which the IEA estimates will reach $600 billion this year. However, long‑term investors remain cautious: the cyclical nature of oil, the accelerating energy transition, and the risk of an economic slowdown that craters demand create a volatile path. The consensus price target for Brent in Q4 is $100, but a break above $105 could trigger demand destruction and a policy response that caps the upside. For now, the balance of risks points to a tight market and elevated energy inflation through the summer.
Discover more from The Economy
Subscribe to get the latest posts sent to your email.
From Blue Owl’s fund freeze to FSB warnings and Jamie Dimon’s alarm, private credit is facing its first downturn stress test. We map the risks, the defaults, and what comes next.For more than a decade, private credit expanded in the gaps that post-2008 bank regulation created, growing from roughly $2 trillion in assets in 2020 to over $3 trillion by the end of 2025. Pension funds, insurance companies, and increasingly retail investors poured capital into what appeared to be a superior alternative to public bond markets — higher yields, lower volatility, and steady returns uncorrelated to listed equity swings. In 2026, the reckoning has begun.
A series of defaults, fund freezes, and fraud allegations in late 2025 and early 2026 has raised serious questions about how transparent, liquid, and stable this market really is. Blue Owl, one of the largest private credit managers, froze withdrawals from one of its retail funds in February 2026. Tricolor Holdings, a subprime auto lender, ran into funding difficulties in late 2024. First Brands, an auto parts supplier, allegedly pledged identical assets as collateral to multiple lenders simultaneously — a fraud that surfaced in early 2025. Each episode, individually containable; collectively, they outline a market entering its first genuine stress test.
The Scale and the Opacity
The Financial Stability Board, the G20’s global financial watchdog, published a landmark report in May 2026 warning that private credit’s complexity, leverage, and interconnectedness could amplify stress in adverse scenarios. The FSB estimated total private credit assets at $1.5 to $2 trillion — though industry survey-based estimates, incorporating broader definitions, place the market closer to $3.5 trillion according to the Alternative Credit Council.
The discrepancy between these figures is itself telling. Private credit lacks standardized, transparent data and is characterised by opaque valuation practices — a problem the FSB explicitly flagged, calling on national regulators to close data gaps and harmonise definitions. Unlike public bonds, private credit pricing is never continuously tested by live market transactions. It is instead set by fund managers through models that may not reflect true market clearing levels.
The FSB’s statistics showed $220 billion of drawn and undrawn credit lines from banks to private credit funds — but noted that commercial data suggested the actual figure could be twice as large. European banks alone reported significant direct exposures: Barclays disclosed $20 billion; Deutsche Bank approximately $30 billion, or 2% of its total loan book; BNP Paribas $25 billion, or 3% of its book.
The Structural Vulnerabilities
Several interconnected pressures are building simultaneously. First, the “true” default rate. While headline default rates in private credit have remained below 2%, once selective defaults and liability management exercises are included, the effective rate approaches 5%. This gap between reported and actual impairment is a function of private credit’s structural discretion: fund managers can renegotiate terms, extend maturities, and avoid triggering formal defaults in ways that public bond markets cannot accommodate.
Second, payment-in-kind interest usage has risen notably in recent years, with public Business Development Companies now receiving an average of 8% of investment income via PIK — meaning borrowers are paying interest not in cash but by issuing additional debt, compounding their principal while preserving short-term liquidity. This signals cash flow stress without formal default recognition.
Third, the retail investor experiment is untested. After extensive lobbying, US regulators gave private credit managers approval to sell to the roughly $13 trillion defined contribution market — exposing a new class of investors to an illiquid asset class that lacks the daily pricing and redemption mechanisms they are accustomed to. The combination of redemption promises and illiquid underlying assets is precisely what caused structural problems in real estate investment trusts during the 2022 rate shock.
The Dimon Warning and Senate Scrutiny
JPMorgan CEO Jamie Dimon’s April letter to shareholders was unusually blunt. Credit standards have been “modestly weakening pretty much across the board”, Dimon wrote, with increasingly aggressive assumptions about future performance underlying loan underwriting. Senator Jack Reed of Rhode Island wrote to Treasury Secretary Scott Bessent in March urging a prompt review of whether risks building in credit markets could become systemic.
The National Association of Insurance Commissioners adopted new reporting requirements in March, specifically targeting the estimated $1 trillion in private credit assets held in insurance pools. Increasing transparency around how insurers manage these portfolios was identified as a key regulatory priority for state-level oversight.
Is This 2008 in Slow Motion?
The comparison to the pre-crisis structured credit market is irresistible and imperfect. Both expanded rapidly, operated with limited transparency, and became increasingly interconnected. But private credit is generally less leveraged and less complex than the CDO-squared structures of 2007. Its investor base relies predominantly on long-term capital rather than short-term funding markets. And the formal banking system, while exposed through revolving credit facilities and strategic partnerships, has larger capital buffers than it did eighteen years ago.
The more likely outcome is not a sudden collapse but a prolonged credit tightening — what some analysts describe as a quiet suppression of business lending that could constrain investment and economic growth for years without triggering a dramatic market event. Less cinematic than a financial crisis. Potentially just as damaging.
Discover more from The Economy
Subscribe to get the latest posts sent to your email.
In the autumn of 1956, British Prime Minister Anthony Eden received a phone call that ended an empire. The military operation in Egypt had succeeded. The Suez Canal was under Anglo-French control. And Washington told London to stop.
The United States, alarmed by Soviet threats of intervention and unwilling to see its Cold War allies destabilize the Middle East, forced Britain and France to withdraw. Within a decade, the British Empire was in managed retreat. The pound sterling—for over a century the world’s reserve currency—began its long slide. It took thirty years for the cycle to complete: George Soros finally drove the final stake through the Bank of England in 1992.
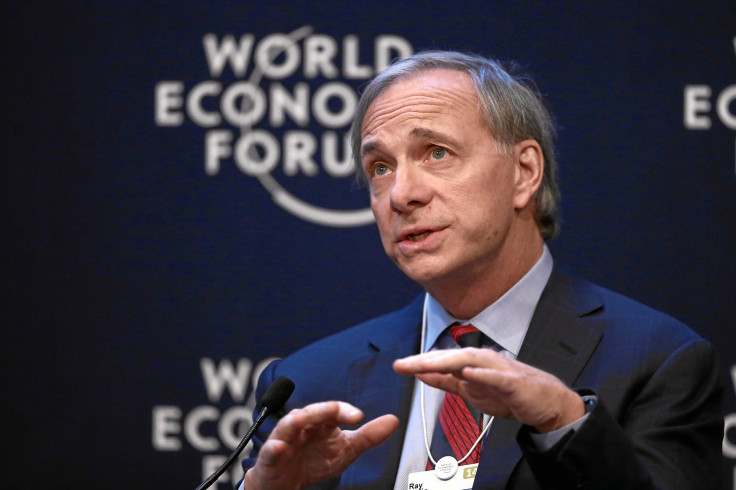
Ray Dalio did not write that history as a lesson about Britain. He wrote it as a warning about the United States in March 2026. And this week, Fortune published his most comprehensive articulation yet of why he believes America has just lived through its own version of that afternoon.
The Hormuz Parallel
The Bridgewater Associates founder has spent decades mapping what he calls the Big Debt Cycle—the rise and fall of reserve-currency empires over five centuries of financial history. The pattern, he argues, is consistent across cases: a dominant power overextends militarily over a critical trade route, suffers a loss of geopolitical face despite tactical success, and watches allies and creditors quietly recalibrate their confidence.
The 2026 U.S.-led bombing campaign against Iran fits that template, Dalio contends. The strikes degraded Iranian military capacity but did not topple the regime. The Strait of Hormuz—through which roughly a fifth of the world’s daily oil supply moves—was disrupted for weeks, sending energy prices surging and triggering a global inflation shock. Negotiations produced a stalemate rather than a decisive resolution.
“It all comes down to who controls the Strait of Hormuz,” Dalio wrote on X. The motivational asymmetry, he argued, was stark: for Iran’s leadership, the conflict was existential. For American voters, it was gas prices and midterm politics.
The Debt Foundation Is Already Cracked
What makes Dalio’s warning more than historical analogy is the fiscal backdrop against which the Hormuz crisis played out. U.S. federal debt crossed $39 trillion on March 18, 2026, with the latest trillion accumulating in record time—driven by tax reductions that eroded revenues and war expenditures that accelerated spending. All three major credit ratings agencies have now downgraded U.S. sovereign debt: S&P in 2011, Fitch in 2023, and Moody’s in May 2025.
The dollar’s share of global foreign exchange reserves has fallen to 56.9%, its lowest level since 1995 and down from a peak of 72% in 2001. Capital and technology spending by the top five U.S. mega-cap technology companies now represent roughly 30% of the entire S&P 500—a concentration of financial weight last seen half a century ago.
NVIDIA alone has surpassed a $5 trillion market capitalization, making it worth more than the entire GDP of most nations. Microsoft, Alphabet, Amazon, and Meta are projected to spend between $660 billion and $700 billion on AI infrastructure in 2026 alone. Dalio sees this as a dangerous divergence: financial markets increasingly levitating above an economy where households are under acute pressure, real wages have declined because of energy shock, and consumption—which accounts for 67% of U.S. GDP—faces structural headwinds.
The Dollar Isn’t Collapsing—Yet
Dalio is careful about what he is and is not claiming. Britain’s sterling did not collapse at Suez. It bled for three decades before the final break. The dollar today is still, as Wall Street analysts say, the “cleanest dirty shirt” in the global monetary wardrobe. No alternative reserve currency exists at anything close to the scale that would be required to replace it.
But the trajectory, Dalio argues, is what matters—not the current position. He draws a direct structural comparison: allies stopped deferring to London after Suez; creditors quietly reassessed British debt; the currency’s global role eroded steadily even as the British economy remained functional and respected. The analogy, he acknowledges, has limits. He frames this as contingent possibility, not inevitability.
Asian leaders Dalio has spoken with recently—he described spending a month in Asia, including ten days in China, in early 2026—have reached a collective conclusion that the U.S. can no longer credibly project military force across multiple theaters simultaneously. “It’s clear that the United States cannot fight a war,” he told Bloomberg Television in early June, citing public unwillingness to absorb casualties. He flagged Taiwan as the most acute potential flashpoint, noting that Beijing could trigger a global market crash by signaling a semiconductor blockade without firing a single shot.
What to Watch—and What to Hold
Dalio is not prescribing specific trades, but the historical pattern points in a consistent direction. In prior empire-transition periods, the indicators to monitor are: allies and creditors losing confidence, erosion of reserve currency status, selling of sovereign debt assets, and currency weakness—especially against gold.
Gold has already tracked that roadmap. Prices surged approximately 60% in the twelve months through March 2026. Goldman Sachs has revised its year-end 2026 gold price target to $4,900 per troy ounce—down from an earlier $5,400 forecast, reflecting the expectation that the Fed will not cut rates this year—but remains constructive on the long-term outlook.
“People don’t have, typically, an adequate amount of gold in their portfolio,” Dalio told CNBC in a February 2025 interview. “When bad times come, gold is a very effective diversifier.”
Dalio has identified the window between the 2026 U.S. midterm elections and the 2028 presidential election as a period of particular vulnerability, when debt pressures and intensifying political conflict over taxes and spending will converge. The outcome is not predetermined. Empires do extend their lives through what Dalio calls “life-extending” measures: prudent debt management, inflation control, and national unity. But with U.S. interest payments alone projected to exceed $1 trillion annually, those measures feel increasingly aspirational.
Discover more from The Economy
Subscribe to get the latest posts sent to your email.

Malaysia GDP Growth Slows as Strait of Hormuz Crisis Drags On

Indonesia’s 150-Million-Barrel Russian Oil Deal Explained

Russia’s Sanctioned Oil Giants Regain 57% Export Share via Shadow Fleet

UBS Report: Billionaire Wealth Up 25% on AI Boom as Median Wealth Falls

Private Credit Warning: Most BDCs Turn Unprofitable in 2026, Reuters Finds

Bank of England AI Kill Switch vs Singapore MAS Agentic AI Rules

China Hedge Funds Warn Global AI Stocks Are a ‘Super Bubble’

JPMorgan Warns AI Cyberattacks Could Trigger Next Banking Crisis

The Biggest Monetary Policy Shift Since the Financial Crisis May Already Be Underway

The $2 Trillion Shadow: Private Credit’s Quiet Crisis and What It Means for Global Markets

Climate Change Is No Longer a Future Risk to Finance. It Has Arrived.

$109 Trillion and Counting: How the World’s Sovereign Debt Crisis Is Being Built in Plain Sight

South Korea’s Won Slides to Its Weakest Since Lehman: Asia market impact

Japan’s $2.3 Trillion Bet: Takaichi’s AI-Semiconductor Moonshot and the Fiscal Tightrope It Requires

PwC China Partner Payouts Cut Amid Evergrande Audit Fraud

Investors Pile Into Bullish Dollar Bets as ‘US Exceptionalism’ Trade Returns

Broadcom Market Value Loss: Revenue Forecast Disappoints

Here’s How Much It’ll Cost You to Be Part of SpaceX’s Record-Breaking $75 Billion IPO

Nasdaq Tumbles 4% as Chip and Memory Stocks Sink: A $1.2 Trillion Wipeout

Japan’s Nikkei Scales Record Peak as AI Shares Track US Chip Rally

How to Fix Pakistan’s Debt Economy: A Structural Blueprint

Grinding the Already Ground: Pakistan’s Inflation Crisis

Smash Capital Leads $200M Funding for Allen Control Systems

Democrats Draw a Red Line Around Military AI — And the Pentagon Is Already Pushing Back

JPMorgan Cuts Anthropic AI Access in Hong Kong

New Investment Super-Cycle: AI, Green Energy & Re-Shoring

Middle East Conflict Oil Prices: The $4 Surge Explained

Xponential Fitness Franchise Lawsuit: The $3.97M Judgment
-

 Markets & Finance6 months ago
Top 15 Stocks for Investment in 2026 in PSX: Your Complete Guide to Pakistan’s Best Investment Opportunities
-

 Analysis4 months ago
Top 10 Stocks for Investment in PSX for Quick Returns in 2026
-

 Analysis5 months ago
Brazil’s Rare Earth Race: US, EU, and China Compete for Critical Minerals as Tensions Rise
-

 Analysis4 months ago
Johor’s Investment Boom: The Hidden Costs Behind Malaysia’s Most Ambitious Economic Surge
-

 Banks6 months ago
Best Investments in Pakistan 2026: Top 10 Low-Price Shares and Long-Term Picks for the PSX
-

 Investment6 months ago
Top 10 Mutual Fund Managers in Pakistan for Investment in 2026: A Comprehensive Guide for Optimal Returns
-

 Global Economy6 months ago
15 Most Lucrative Sectors for Investment in Pakistan: A 2025 Data-Driven Analysis
-

 Global Economy6 months ago
Pakistan’s Export Goldmine: 10 Game-Changing Markets Where Pakistani Businesses Are Winning Big in 2025