
Banks
Pakistan’s Most Reliable Export Is Its People: Remittances Hit $41.6 Billion, Overtaking Total Exports


Introduction
For the first time in the country’s history, money sent home by Pakistan’s overseas workers has exceeded the value of everything Pakistan actually sells abroad. Remittances hit a record $41.6 billion in the fiscal year ending June 30, 2026, according to State Bank of Pakistan data — surpassing total merchandise exports for the same period and cementing a structural shift that economists are increasingly uneasy about (VOI World/State Bank of Pakistan).
The Numbers Behind the Milestone
Remittance inflows rose 8.6% year-on-year in FY26, up from $38.3 billion in FY25 (VOI World). Some reporting puts the full 11-month figure even higher at $38 billion before the final month was tallied, with May 2026 alone contributing $4.25 billion — an amount roughly equal to what the entire country spends on imports in a single month (Express Tribune). A separate Express Tribune report puts the full FY26 total even higher, at $41.58 billion, an increase of nearly $3.29 billion over the prior year, delivered “without structured educational, training or welfare support” for the overseas workforce generating it (Express Tribune — Remittances Without Structured Support).
Saudi Arabia remained the single largest source of remittances in June 2026 at $829.6 million, followed by the UAE ($792.3 million), the United Kingdom ($514.9 million) and the United States ($296.8 million), with Italy and Oman each contributing more than $100 million (VOI World). That geographic concentration matters: a substantial share of Pakistan’s remittance base originates from the Gulf, leaving the country’s external account exposed to labor market reforms, economic cycles and geopolitical developments concentrated in a single, currently volatile region (Business Recorder Editorial).
Exports Have Been Stuck for Years
The remittance surge stands in sharp contrast to Pakistan’s export performance, which has shown little sustained dynamism despite years of concessional financing, preferential tariff regimes and subsidized energy for exporters (Business Recorder Editorial). The textile sector — long considered the backbone of Pakistan’s export economy — has been stuck in a $15–18 billion annual range for years, even as a handful of forward-thinking textile groups have managed to grow exports and diversify product lines under the exact same operating conditions others cite as prohibitive (Express Tribune). Separately reported nine-month data for the fiscal year showed exports contracting 5.8% to $23.3 billion even as imports rose nearly 8% to $46.8 billion, widening the trade gap further (Minute Mirror).
Over the three fiscal years from 2023 to 2025, Pakistan received $95.8 billion in remittances compared with $91 billion in merchandise exports — a gap that reflects, according to Business Recorder analysis, a deliberate policy orientation that has effectively institutionalized remittances as the default tool for stabilizing the current account rather than addressing the underlying export weakness (Business Recorder Opinion).
The Dutch Disease Warning
Independent economists have begun explicitly framing this pattern as a precursor to Dutch disease — the phenomenon where a large, easy source of foreign currency inflow reduces the pressure and incentive to build a competitive tradeable export sector (Business Recorder Opinion). The policy dimension is not incidental: under IMF program conditions, a long-standing subsidy that had encouraged banks to actively mobilize remittance transfers was withdrawn in the 2026 Budget, contributing to a temporary slowdown in inflows during the early months of the fiscal year before the government released Rs30 billion from its contingency fund to help revive momentum (Business Recorder Opinion).
A Business Recorder editorial published in July 2026 was blunt about the implication: Pakistan’s overseas workers have effectively become the country’s “most reliable export,” with its own people functioning as its largest export commodity — a framing the editorial explicitly calls an unsustainable foundation for long-term development strategy (Business Recorder Editorial).
The Silver Linings
The remittance boom has provided genuine macroeconomic stabilization. Total liquid foreign reserves crossed $23.98 billion as of early July 2026, including $18.47 billion held by the State Bank of Pakistan itself, with the rupee holding relatively steady around Rs278 per dollar in the interbank market (Express Tribune — Remittances Without Structured Support). Inflation has also been easing, and large-scale manufacturing showed signs of recovery with 5.9% growth in earlier-reported data, while agricultural lending rose 14.4% during July–February, extending credit access to farmers (Minute Mirror). Separately, Pakistan has reportedly repaid roughly Rs4,722 billion in debt ahead of schedule and posted a historic milestone in IT sector exports, suggesting pockets of genuine structural improvement exist alongside the broader export stagnation (Radio Pakistan).
Why This Matters Beyond Pakistan
Pakistan’s experience is a useful case study for other remittance-dependent emerging economies navigating IMF program conditions. The core tension — using a reliable, low-effort capital inflow to paper over a harder structural problem in the tradeable goods sector — is not unique to Pakistan, but few economies illustrate the scale of the imbalance as starkly as a country where remittances now formally exceed total exports.
Key Takeaways
- Pakistan’s FY26 remittances hit a record $41.6 billion, surpassing total merchandise exports for the first time in the country’s history.
- Saudi Arabia and the UAE remain the largest single sources, concentrating external account risk in the Gulf region.
- Textile exports have been stuck between $15–18 billion annually for years despite sustained government support.
- Economists are increasingly framing the remittance-export imbalance as a Dutch disease risk rather than a stabilization success story.
- Reserves have strengthened to nearly $24 billion and the rupee has stabilized, but the underlying export competitiveness problem remains unresolved.
Sources: VOI World, Express Tribune — Remittances Dwarf Exports, Express Tribune — Remittances Without Structured Support, Business Recorder Opinion, Business Recorder Editorial, Minute Mirror, Radio Pakistan
Discover more from The Economy
Subscribe to get the latest posts sent to your email.


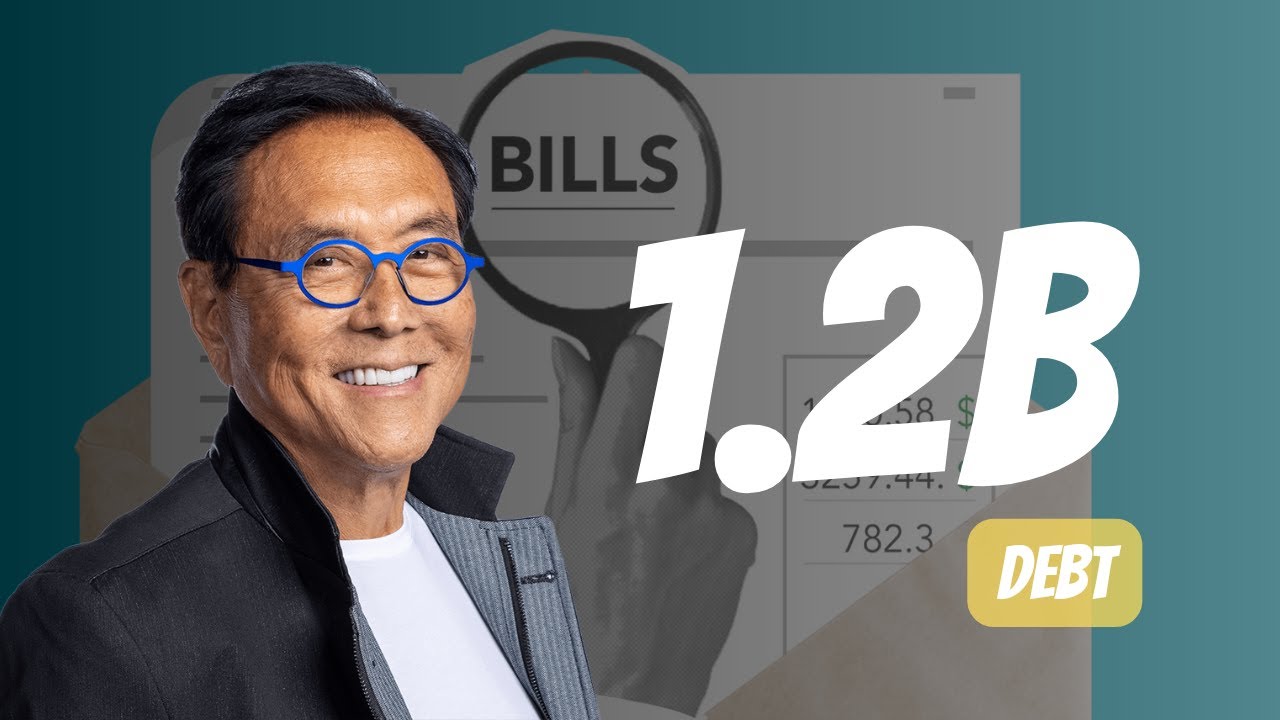
A disclosure putting Robert Kiyosaki’s real-estate-linked debt at $1.2 billion has renewed scrutiny of the “Rich Dad Poor Dad” author’s leveraged investing philosophy, but the figure needs context: it represents financing tied to roughly 1,500 apartment units, not personal liability, with Kiyosaki’s own equity stake estimated by Vanity Fair at just $30–60 million. The debt story lands alongside Kiyosaki’s continued bullish public calls on silver (targeting $200/oz from a recent level near $85) and Bitcoin, both framed as hedges against what he calls an unsustainable US debt and currency picture.
Kiyosaki’s Balance Sheet vs. Asset Predictions
| Metric | Figure | Context |
|---|---|---|
| Reported total real-estate-linked debt | $1.2 billion | Financing roughly 1,500 apartment units (non-recourse, asset-backed structure) |
| Kiyosaki’s personal equity stake (est.) | $30–60 million | Per Vanity Fair, as relayed by his former wife/business partner Kim Kiyosaki |
| Silver spot price (recent) | ~$85/oz | As of Kiyosaki’s public commentary, mid-2026 |
| Kiyosaki’s long-term silver target | $200/oz | Public statements, 2026 |
| Bitcoin price at time of debt disclosure | ~$77,476 | Early September 2026 |
| Bitcoin 2026 year-to-date low point (July) | -33% YTD | Before August recovery |
| Bitcoin YTD performance after August rebound | -10.91% YTD | Trimmed from -33% low |
| US spot Bitcoin ETF inflows (August 2026) | $3.5 billion | Strongest monthly inflow since July 2025 |
| Kiyosaki’s cited US national debt figure | ~$39 trillion | Public commentary basis for currency-devaluation thesis |
| Kiyosaki’s 2024 Bitcoin prediction ($350,000 by Aug. 25, 2024) | Did not materialize | Disclosed as a prediction, not a guarantee, per his own framing |
Sources: Hokanews and COINOTAG (Sept. 1–2, 2026), CoinCentral and Pluang (May 2026), Yahoo Finance (Nov. 2025, cited for prior-year price-target context).
Deep Dive: Separating the Debt Headline From the Investment Thesis
What the $1.2 Billion Debt Figure Actually Represents
The headline number is attention-grabbing, but the underlying structure matters more than the total. According to reporting that traces back to comments from Kim Kiyosaki — Robert’s former wife and long-time business partner — the $1.2 billion in liabilities sits against a portfolio of approximately 1,500 apartment units, and represents financing secured by those income-generating properties rather than unsecured personal debt. Vanity Fair separately estimated Kiyosaki’s own equity share of the underlying real estate at a considerably smaller $30 million to $60 million.
This distinction is central to understanding Kiyosaki’s own stated investment philosophy, which has for decades drawn a sharp line between what he calls “productive” debt — borrowing secured by cash-flowing assets that can service the loan through rental income — and consumer debt used to finance depreciating purchases. Whether or not one agrees with the framework, the reporting is consistent that the $1.2 billion is not money Kiyosaki personally owes in full, and the properties themselves generate rental income that is structured to service the debt.
The Risk the Structure Doesn’t Eliminate
Asset-backed, non-recourse-style borrowing can preserve liquidity and let an investor retain ownership of underlying properties without needing to sell assets to raise cash — a genuine advantage of the approach in a rising or stable property market. But the structure does not eliminate risk: heavy leverage of this kind exposes the investor to higher financing costs when rates rise and to potential impairment if property performance (occupancy, rents, or valuations) softens. A $1.2 billion debt load against a $30–60 million personal equity stake implies substantial leverage — a structure that amplifies both potential returns and potential losses if the underlying 1,500-unit portfolio’s performance were to deteriorate.
The Silver Thesis: A Decades-Old Position, Not a New Trade
Kiyosaki has repeatedly emphasized that his silver position dates back to 1965, when he began accumulating the metal at age 18, at a time when it traded for pennies per ounce. With spot silver recently trading near $85 an ounce, he has set a long-term target of $200, framing the metal as both a monetary hedge against currency devaluation and a bet on industrial demand. He is not alone in flagging silver as undervalued: multiple market commentators have pointed to depleted CME warehouse inventories and rising industrial consumption (driven substantially by solar panel and electronics manufacturing) as structural supports for higher prices, independent of Kiyosaki’s own commentary.
The Bitcoin Thesis, and a Track Record Worth Weighing Honestly
Kiyosaki has for years ranked among Bitcoin’s most vocal price bulls, and it’s worth being direct about his track record on specific price calls: a June 2024 prediction that Bitcoin would reach $350,000 by August 25 of that year did not materialize, a point he has acknowledged while maintaining that the level would eventually be reached — a framing that treats missed timelines as a delay rather than an invalidation of the underlying thesis. Bitcoin’s own 2026 trading history adds relevant context for anyone weighing his current calls: the asset fell roughly 33% year-to-date by July under tight monetary conditions before a V-shaped August recovery trimmed that loss to roughly 11%, a rebound that coincided with $3.5 billion in US spot Bitcoin ETF inflows for the month — the strongest since July 2025.
The Macro Thesis Tying It Together
Kiyosaki’s public framing consistently returns to the same structural argument: roughly $39 trillion in US national debt, combined with what he describes as ongoing dollar devaluation dating back to 1974 (a reference to the post-Bretton Woods fiat currency era), creates conditions he believes will culminate in a broader economic reckoning. He has also flagged fragility in baby boomer retirement portfolios — heavily concentrated in traditional stocks and bonds — as a systemic vulnerability if his broader crash thesis were to play out. It’s worth noting plainly that this crash-timing call is not new; Kiyosaki has made similar warnings across multiple years, and mainstream forecasters, per available reporting, largely continue to project moderate rather than crisis-level economic conditions, even while acknowledging genuine risks around sovereign debt levels and geopolitical tensions.
Reading Leverage as a Philosophy, Not Just a Number
Perhaps the more durable, transferable lesson from the Kiyosaki debt story — independent of whether his specific silver or Bitcoin price targets prove accurate — is the framework itself: asset-backed leverage against cash-flowing real estate is a genuinely different risk profile than unsecured personal debt, but “different” does not mean “risk-free.” Investors evaluating any leveraged real estate strategy, their own or a public figure’s, should look past the headline debt total to the underlying loan-to-value ratios, income coverage, and personal-versus-asset-level liability structure before drawing conclusions about how exposed the equity holder actually is.
Actionable Takeaways for Investors
- Separate headline debt figures from personal liability exposure in any leveraged real estate story. A $1.2 billion portfolio-level debt figure against a $30–60 million personal equity stake tells you about leverage ratio, not about what the individual investor stands to lose in an absolute-dollar sense.
- Track CME silver inventory levels as an independent check on the undervaluation thesis. This is a verifiable, non-Kiyosaki-specific data point that multiple analysts have cited separately from his commentary.
- Weigh any specific price target against the forecaster’s own disclosed track record. Kiyosaki’s 2024 Bitcoin call that did not materialize by its stated deadline is public, documented context worth factoring into how much weight to place on his current $200 silver target or ongoing Bitcoin bullishness.
- Distinguish asset-backed leverage from consumer debt when evaluating your own portfolio’s risk. The productive-versus-consumer debt framework Kiyosaki popularizes is a genuinely useful mental model, applicable well beyond his specific real estate holdings.
- Monitor Bitcoin ETF flow data as a more immediate sentiment gauge than any single commentator’s price target. The $3.5 billion August 2026 inflow figure is a concrete, trackable data point that offers a more current read on institutional positioning than any individual’s long-term price call.
Frequently Asked Questions
How much debt does Robert Kiyosaki actually have?
Reporting places Kiyosaki’s total real-estate-linked debt at approximately $1.2 billion, financing roughly 1,500 apartment units, but this is asset-backed portfolio debt rather than personal liability — his own equity stake in the underlying properties is estimated at $30 million to $60 million by Vanity Fair.
What is Robert Kiyosaki’s silver price prediction for 2026?
Kiyosaki has set a long-term target of $200 per ounce for silver, up from a recent trading level near $85, framing the metal as both a currency-devaluation hedge and an industrial-demand play, consistent with a position he says he began building in 1965.
Did Robert Kiyosaki’s past Bitcoin price predictions come true?
Not always — a June 2024 prediction that Bitcoin would reach $350,000 by August 25, 2024 did not materialize, a target he has acknowledged missed its timeline while maintaining he believes the price level will eventually be reached.
Why does Robert Kiyosaki think a global economic crash is coming?
Kiyosaki attributes his crash prediction to roughly $39 trillion in US national debt combined with dollar devaluation he traces to 1974, along with what he views as fragile baby boomer retirement portfolios overexposed to traditional financial assets — though mainstream economic forecasters generally project moderate rather than crisis-level growth.
Discover more from The Economy
Subscribe to get the latest posts sent to your email.
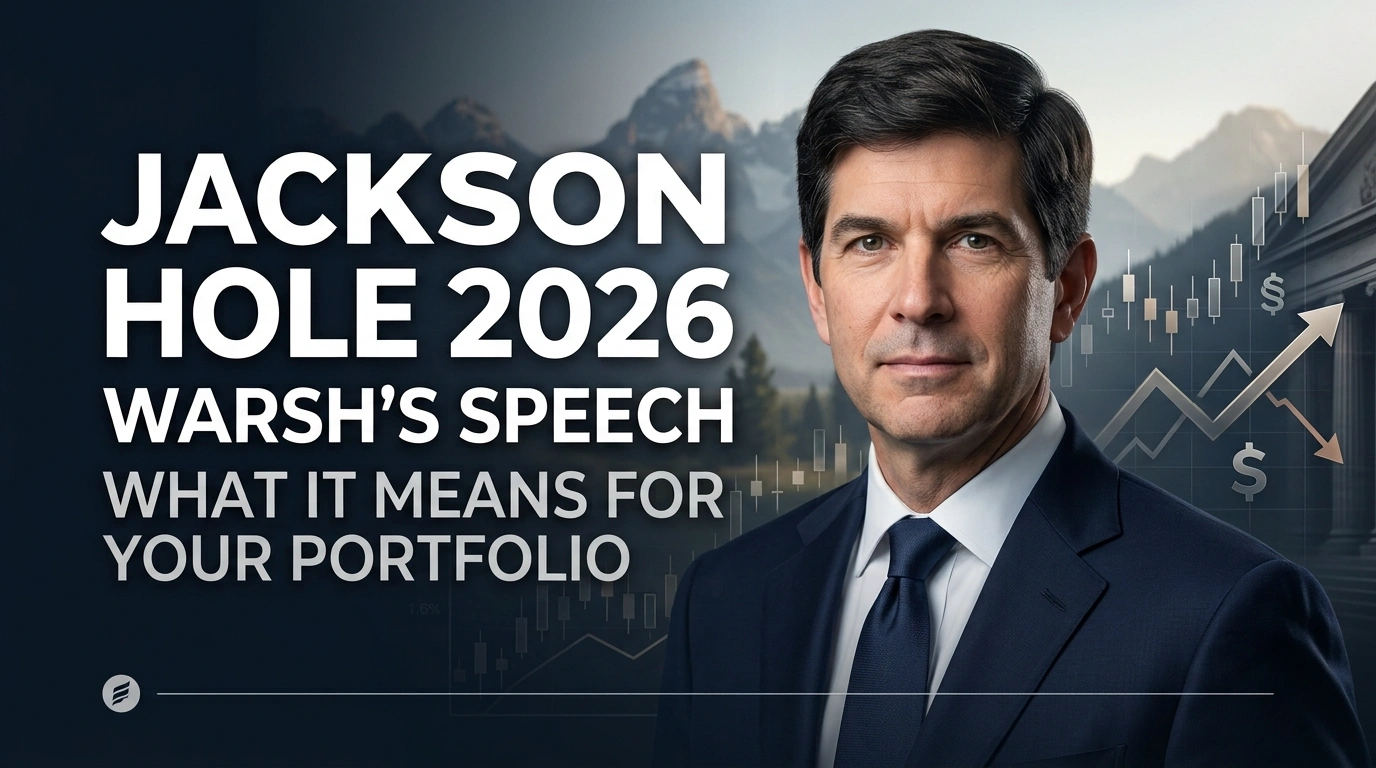
Fed Chair Kevin Warsh delivered his first Jackson Hole keynote as inflation sits at 3.4% and September rate-cut odds hang in the balance. Here’s how to position your portfolio.
Key Takeaways
- Fed Chair Kevin Warsh delivered his first Jackson Hole keynote on Friday, August 28, 2026 — just three weeks before the critical September 16 FOMC meeting.
- The 2026 symposium theme is “Financial Innovation: Implications for Payments and Policy,” covering CBDCs, stablecoins, and real-time payment systems — though markets are focused almost entirely on rate signaling.
- Inflation remains stubbornly above target at 3.4%, while growth shows signs of cracking under trade tensions and geopolitical uncertainty.
- Markets were pricing roughly one-in-three odds of a rate move heading into the speech, with elevated Treasury yields near 5.5% reflecting sticky-inflation and fiscal-deficit concerns.
- Warsh has a track record of withholding forward guidance, so investors should prepare for scenarios where the speech offers limited new signal rather than a clear policy pivot.
Why Jackson Hole Still Moves Markets
Since 1978, the Federal Reserve Bank of Kansas City’s Economic Policy Symposium in Jackson Hole, Wyoming has evolved from a niche academic gathering into one of the most consequential events on the global financial calendar. The keynote address — traditionally delivered by the sitting Fed Chair — has historically preceded major monetary policy shifts. Jerome Powell’s 2022 warning that fighting inflation would “bring some pain to households and businesses” wiped 3.37% off the S&P 500 in a single session; his 2024 line that “the time has come for policy to adjust” sent stocks up 1.15% and preceded a rate cut the following month.
This year’s stakes are especially high because it’s Kevin Warsh’s first Jackson Hole address as Fed Chair, having succeeded Jerome Powell in May 2026. Markets are still calibrating his communication style, which adds an extra layer of uncertainty on top of the usual rate-path guessing game.
The Setup: Inflation vs. Growth Tension
Heading into the speech, the macro backdrop was genuinely split:
- Inflation sits at 3.4%, well above the Fed’s 2% target, complicating any case for near-term easing.
- Growth signals are weakening under the combined weight of trade tensions and geopolitical uncertainty.
- The FOMC itself is divided: roughly half the committee penciled in rate hikes for 2026 at Warsh’s first meeting as Chair in June, while three regional Fed presidents dissented in favor of immediate tightening at the July meeting.
- Treasury yields remain elevated near 5.5%, reflecting both sticky inflation expectations and ongoing fiscal-deficit concerns — a combination that keeps pressure on borrowing costs across the economy.
This is an unusually contentious setup. Markets were pricing roughly one-in-three odds of a rate move at the September 16 FOMC meeting heading into Warsh’s remarks, making his choice of language — not any explicit policy announcement — the key event risk for the trading session.

How Traders Decode Fed-Speak
Because Fed chairs rarely commit to explicit forward guidance at Jackson Hole, professional traders parse language patterns for directional signal:
Hawkish phrases to watch for:
- “Restrictive”
- “Vigilant”
- “Inflation remains sticky”
- “Risks are two-sided”
- “Premature to consider rate cuts”
Dovish phrases to watch for:
- “Progress on inflation”
- “Patient approach”
- “Financial conditions restrictive” (used to justify easing)
- “Growth concerns”
- “Labor market cooling”
A related, more subtle signal: which topic gets more airtime. A Chair who dwells on inflation is typically signaling rates stay elevated; a Chair who dwells on labor-market softness is typically laying groundwork for cuts. Historically, expected volatility in major currency pairs (EUR/USD, GBP/USD, USD/JPY) runs 50–150 pips in the two hours following the speech — a useful benchmark for gauging how much the market ultimately reacts.
The Payments & Financial Innovation Angle
Beyond rate signaling, this year’s symposium theme — “Financial Innovation: Implications for Payments and Policy” — points to substantive discussion of:
- Central Bank Digital Currencies (CBDCs) and the Fed’s digital dollar plans
- Stablecoin and crypto regulation, and how fintech innovation affects monetary policy transmission
- Real-time payment systems and the ongoing shift from traditional banking rails to instant settlement
For investors tracking the broader fintech and payments sector — including the PayPal-Stripe deal collapse and semiconductor supply chains powering digital payment infrastructure — Warsh’s framing on CBDCs and stablecoin oversight carries direct read-through for regulatory risk across the payments industry.
What This Means for Your Portfolio
If the Tone Skews Hawkish
- Rate-sensitive sectors (real estate, small-cap growth stocks, long-duration bonds) face continued headwinds.
- Financials and banks may benefit from a higher-for-longer rate environment supporting net interest margins.
- The U.S. dollar typically strengthens on hawkish signaling, pressuring commodity prices and emerging-market assets.
If the Tone Skews Dovish
- Growth and technology stocks typically outperform as discount rates on future cash flows decline.
- Bond prices rise (yields fall), benefiting existing fixed-income holdings.
- Gold and other non-yielding assets often catch a bid as real rates decline.
If Warsh Offers Limited New Guidance (The Likely Base Case)
Given Warsh’s track record of letting economic data speak for itself rather than pre-committing to a path, investors should have a plan for a low-signal outcome — historically, the average Jackson Hole keynote day moves the S&P 500 just -0.12%, with only two of the last eight keynote days producing moves greater than 2%. In other words, dramatic Jackson Hole reactions are the exception, not the rule.
Actionable Takeaways for Investors
- Don’t overweight a single speech in your portfolio construction. History shows most Jackson Hole keynotes are non-events for markets; position for the base case of limited new guidance rather than a dramatic pivot.
- Watch the September 16 FOMC meeting as the more decisive catalyst, particularly given the currently split committee outlook between hawks and doves.
- Maintain portfolio diversification across rate-sensitive and rate-resilient assets — a barbell of duration-sensitive bonds and cash-flow-generative equities can hedge against either a hawkish or dovish surprise.
- Track yield curve movement in the days following the speech as a real-time gauge of how the market is actually pricing the September decision, rather than relying solely on headline commentary.
- Consider real assets (gold, TIPS) as a partial hedge given persistent above-target inflation, regardless of the near-term rate path.
This article is for informational and educational purposes only and does not constitute financial or investment advice. Federal Reserve policy and market conditions change rapidly; consult a licensed financial advisor before making investment decisions.
Frequently Asked Questions
What is the Jackson Hole Symposium and why does it matter for investors? The Jackson Hole Economic Policy Symposium is an annual gathering of central bankers and economists hosted by the Federal Reserve Bank of Kansas City, where the Fed Chair’s keynote address has historically preceded major U.S. monetary policy shifts, making it closely watched by equity, bond, and currency traders each August.
Will the Fed cut interest rates in September 2026? As of the Jackson Hole speech, markets were pricing roughly one-in-three odds of a rate move at the September 16 FOMC meeting, with the committee itself split between members favoring further tightening and those anticipating cuts — the outcome remains genuinely uncertain and will depend on incoming inflation and labor-market data.
How should I position my portfolio around a Fed Chair speech? Most financial professionals recommend against making major portfolio changes based on speculation ahead of a single speech, since historical data shows the average Jackson Hole keynote produces only modest market moves; instead, maintain diversification across rate-sensitive and rate-resilient assets and adjust incrementally as actual policy decisions are confirmed.
Discover more from The Economy
Subscribe to get the latest posts sent to your email.
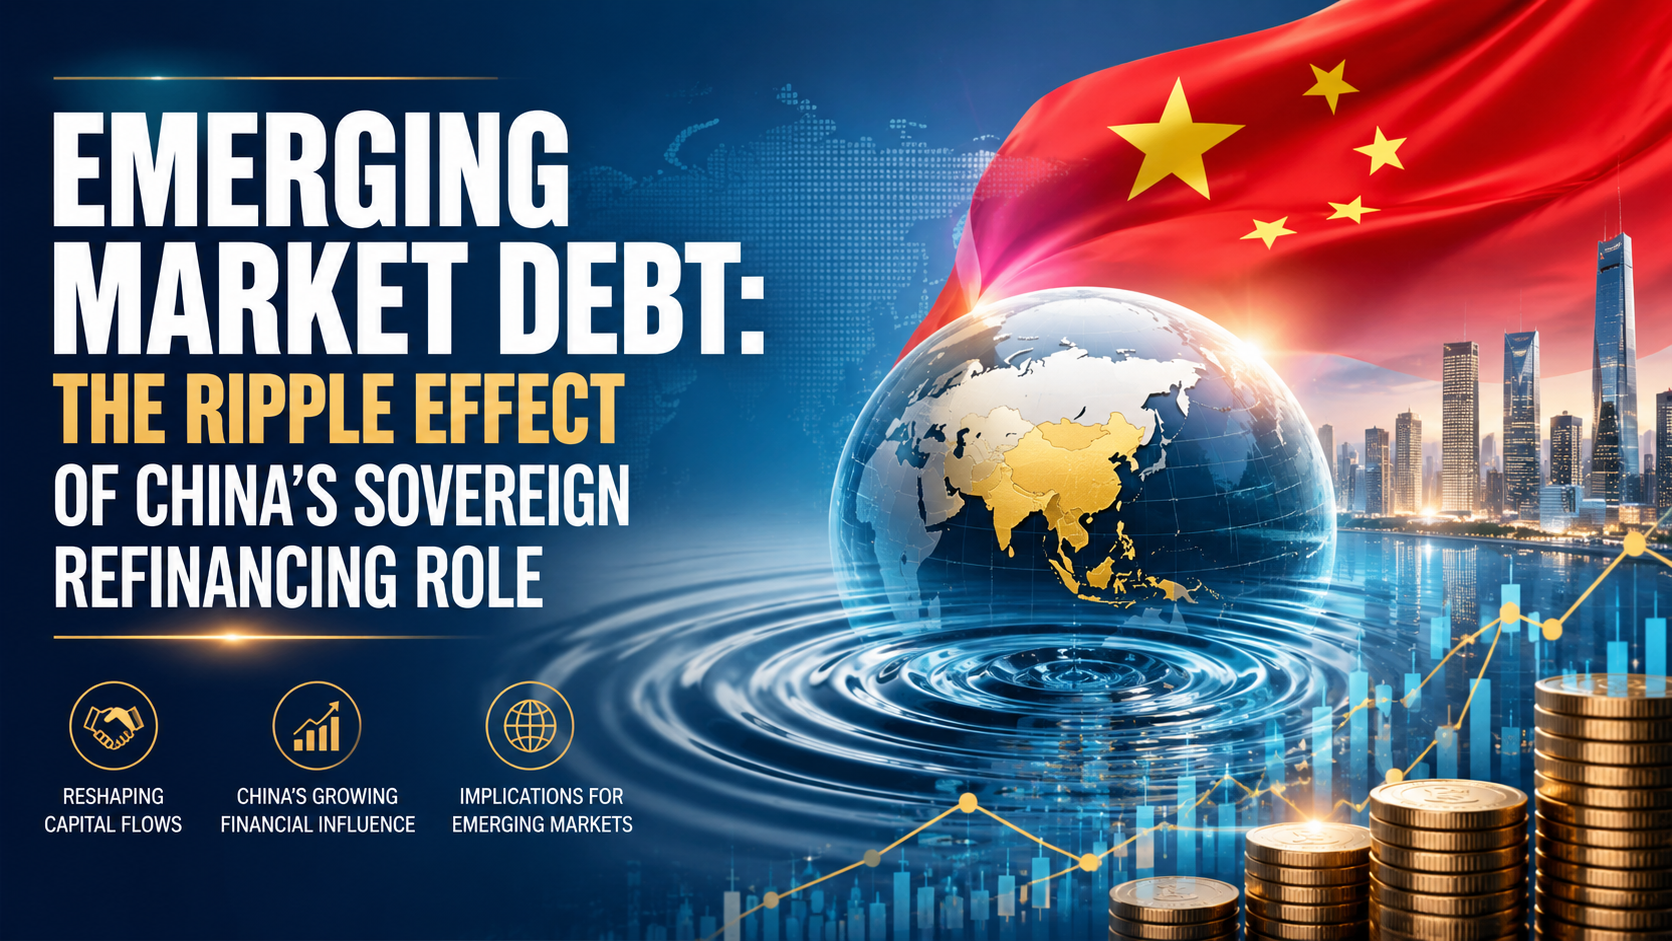
Emerging and developing economies face refinancing needs of more than $9 trillion in 2026, according to the Institute of International Finance’s Global Debt Monitor — the largest wall of maturing sovereign and corporate debt these markets have ever faced simultaneously. At the center of that system sits China, now the single largest issuer of emerging-market sovereign debt and, increasingly, the largest bilateral lender of last resort when smaller economies can’t refinance on their own. For institutional investors and foreign-policy-adjacent business strategists, understanding China’s dual role — dominant issuer and dominant creditor — is now a prerequisite for pricing emerging-market risk correctly.
Editorial note on sourcing: a specific figure describing a discrete “$1.3 billion” China sovereign refinancing transaction could not be independently verified against primary reporting at the time of writing. This article instead builds its analysis on verified, dated figures from the OECD, IIF, Moody’s, and peer-reviewed research, and any deal-level claim should be confirmed against primary sources (finance ministry statements, rating-agency releases) before publication or citation.
China’s Dual Role: Issuer and Creditor of Last Resort
China accounted for 45% of total EMDE sovereign bond issuance in 2024, up sharply from just 17% in the 2007–2014 period, according to the OECD’s Global Debt Report 2025. By 2025, China remained the top borrower among a concentrated group — China, India, Brazil, Egypt, and Argentina together represented 78% of EMDE central-government borrowing, per the OECD’s Global Debt Report 2026.
Domestically, Beijing has simultaneously executed one of the largest local-government debt refinancing programs in history: a 6 trillion yuan (roughly $839 billion) swap of “hidden” local-government debt into standardized bonds, approved in late 2024 and implemented through 2026, according to VOA News. By mid-2026, Chinese provinces had used nearly 94% of that swap allowance, according to Bloomberg.
Internationally, China has also re-entered dollar sovereign bond markets at scale — its 2026 international offering was reported as its largest ever, oversubscribed well beyond target, according to Business Standard/Reuters reporting on the prior comparable issuance. This dual positioning — massive domestic refinancing plus expanding international issuance — gives China outsized influence over EM bond-market liquidity and pricing benchmarks that smaller sovereigns then reference for their own issuance.
The $9 Trillion Wall: Why 2026 Is Different
The scale of what’s coming due matters more than any single deal. Key figures from the IIF’s Global Debt Monitor and OECD’s 2026 report:
- Gross EMDE central-government borrowing crossed $4 trillion in 2025, up from roughly $3 trillion in 2024.
- Around 36% of outstanding EMDE bond stock matures within three years.
- Low-income countries face the sharpest cliff: 52% of their outstanding bonds mature by 2028, with 29% due by the end of 2026 alone.
- Secondary-market yields on maturing debt now exceed 10% for non-investment-grade sovereigns, meaning refinancing at current rates locks in materially higher debt-service costs than the original issuance.
Refinancing Cost Comparison: Then vs. Now
| Issuer Tier | Original Issuance Yield (illustrative range) | 2026 Refinancing Yield | Refinancing Risk |
|---|---|---|---|
| Investment-grade EMDEs (e.g., select Gulf, Southeast Asia sovereigns) | 3–5% | 5–7% | Moderate — absorbable within fiscal space |
| Non-investment-grade EMDEs | 6–8% | 10%+ | High — debt-service costs rising faster than revenue growth |
| Low-income issuers (heavy China bilateral exposure) | Concessional/below-market | Market-rate or restructured terms | Severe — 29% of debt stock matures by end of 2026 |
Source: OECD Global Debt Report 2025/2026 (see citations above); ranges are illustrative of documented tier-level trends, not specific bond issues.
The Restructuring Precedent: What Happens When Refinancing Fails
China’s response to sovereign distress has evolved into a distinct pattern that investors increasingly price into risk premiums. Research published via the National Bureau of Economic Research documents a rising trend of “re-structurings” — repeated restructurings of the same debt with the same creditor — echoing the drawn-out resolution patterns of prior global debt crises. Angola, Ecuador, Seychelles, Sri Lanka, and Venezuela have each undergone two or more restructurings with Chinese state creditors.
Sri Lanka’s case is illustrative of the mechanics: China Development Bank extended a $500 million financing facility in 2020, and a subsequent equity-linked arrangement brought in $1.12 billion in cash that Colombo used to repay non-Chinese creditors, according to Oxford Academic’s International Affairs journal. These bilateral bridge arrangements illustrate how China’s rescue lending functions as a parallel track to traditional Paris Club-style restructuring — often faster to arrange, but less transparent to third-party bondholders pricing the same sovereign’s risk.
Regional Ripple Effects: Where Investors Should Watch Closely
Direct Exposure Zones
- Sub-Saharan Africa: Heaviest concentration of low-income issuers facing near-term maturity walls and prior China restructuring history (Angola, Zambia).
- South Asia: Sri Lanka’s precedent shapes how markets price Pakistan and Bangladesh refinancing risk.
- Latin America: Ecuador and Venezuela carry documented repeat-restructuring histories; Argentina remains among the top-five EMDE borrowers by volume.
Indirect / Second-Order Exposure
- Gulf and Southeast Asian investment-grade sovereigns face rising benchmark yields even without direct restructuring risk, simply because China’s issuance volume moves the EM bond-pricing benchmark broadly.
- Enterprise B2B lenders and trade-finance providers operating in these corridors should treat sovereign-refinancing stress as a leading indicator of counterparty and currency risk, not a lagging one.
An Investor Risk-Monitoring Framework
- Track maturity-wall concentration, not headline debt-to-GDP. A country with moderate debt-to-GDP but a heavy 2026–2028 maturity cliff carries more near-term risk than a higher-leverage country with a smoothed maturity profile.
- Distinguish China’s domestic refinancing (yuan-denominated, largely contained) from its role as an external EM creditor (dollar/foreign-currency exposure, higher spillover risk).
- Watch for repeat-restructuring signals. Countries with a prior China restructuring are statistically more likely to require another, per the NBER research above — treat this as a standing risk flag, not a one-time resolved event.
- Monitor secondary-market yield spreads on maturing debt versus issuance-year yields as the clearest real-time signal of refinancing stress building in a specific sovereign.
The Bottom Line
China’s simultaneous role as the largest domestic debt-refinancer in EM history and the most influential external creditor to distressed sovereigns makes it the single most important variable in the 2026 emerging-market debt outlook. The $9 trillion refinancing wall isn’t a uniform risk — it’s concentrated in low-income issuers with the heaviest prior China bilateral exposure, and that concentration is exactly where enterprise investors, trade-finance providers, and sovereign-risk analysts should be focusing due diligence through the remainder of 2026.
Discover more from The Economy
Subscribe to get the latest posts sent to your email.

United Airlines’ 10 New 2027 Routes: Full List, Cities & Launch Dates

Robert Kiyosaki’s $1.2B Debt Explained: Real Estate Leverage & 2026 Predictions

Gavin Baker AI Outlook: Why the Compute Shortage Persists Through 2028

Social Security 2027 COLA: Latest Projections, Earnings Limits & Key Dates

10-Year Treasury Yield Hits 4.80%: What It Means for Rates & Portfolios

PANW Stock Post-Earnings: Record RPO, FY27 Guidance & Dip Buy Strategy

Dell Stock Surges on $95B AI Backlog: Q2 FY27 Earnings Analysis & Price Target

Latest iPhone Rumors 2026: iPhone 18 Pro & Foldable Specs

ATF Data Breach Details: What the Qilin Ransomware Leak Exposed

GoPro Stock Analysis (GPRO): Why It Surged 46% in One Day

Buddy Stephens Football Coach: Why He Left EMCC in 2026

High School Football National Rankings 2026: Full Guide

Tesla Stock Buy or Sell 2026: TSLA Q2 Earnings Breakdown

Shein Clothes Quality & Safety in 2026: What Lab Tests Show

State Farm’s $5B Dividend 2026: Who Qualifies & Payout Dates

Top 15 Financial Stocks for Investment in PSX

US-China Relations in Q3 2026: Trade Tariffs and Supply Chain Risks

Gold’s Wild 2026: From a Record $5,600 Peak to a 24% Crash and Back Toward $4,500

Oil Surges as Strait of Hormuz Traffic Collapses Again

Gold Price 2026: Why Bullion Has Fallen 25% From Its January Record High

SpaceX Stock Lockup Expiration Explained: Why $123B in Shares Could Hit the Market

The Rocket That Won’t Quit: Inside SpaceX’s Falcon 9 Launch Machine

Russia Oil Revenue 2026: The Iran War Windfall and What a Hormuz Deal Means for Moscow

China Economy 2026: How AI Exports and a Property Crash Are Splitting Growth in Two

Pakistan Economy 2026: Why GDP Growth Isn’t Reaching Ordinary Households

Bank of England Set to Hold Rates Through Year-End, Reuters Poll Shows

July Jobs Shock: Why the Fed’s September Rate Decision Just Flipped (2026 Analysis)

Retail Earnings Week: What Home Depot, Target & Walmart Reveal
-

 Markets & Finance8 months ago
Top 15 Stocks for Investment in 2026 in PSX: Your Complete Guide to Pakistan’s Best Investment Opportunities
-

 Analysis6 months ago
Johor’s Investment Boom: The Hidden Costs Behind Malaysia’s Most Ambitious Economic Surge
-

 Analysis7 months ago
Top 10 Stocks for Investment in PSX for Quick Returns in 2026
-

 Analysis7 months ago
Brazil’s Rare Earth Race: US, EU, and China Compete for Critical Minerals as Tensions Rise
-

 Banks8 months ago
Best Investments in Pakistan 2026: Top 10 Low-Price Shares and Long-Term Picks for the PSX
-

 Investment8 months ago
Top 10 Mutual Fund Managers in Pakistan for Investment in 2026: A Comprehensive Guide for Optimal Returns
-

 Global Economy8 months ago
15 Most Lucrative Sectors for Investment in Pakistan: A 2025 Data-Driven Analysis
-

 Global Economy8 months ago
Pakistan’s Export Goldmine: 10 Game-Changing Markets Where Pakistani Businesses Are Winning Big in 2025